

-
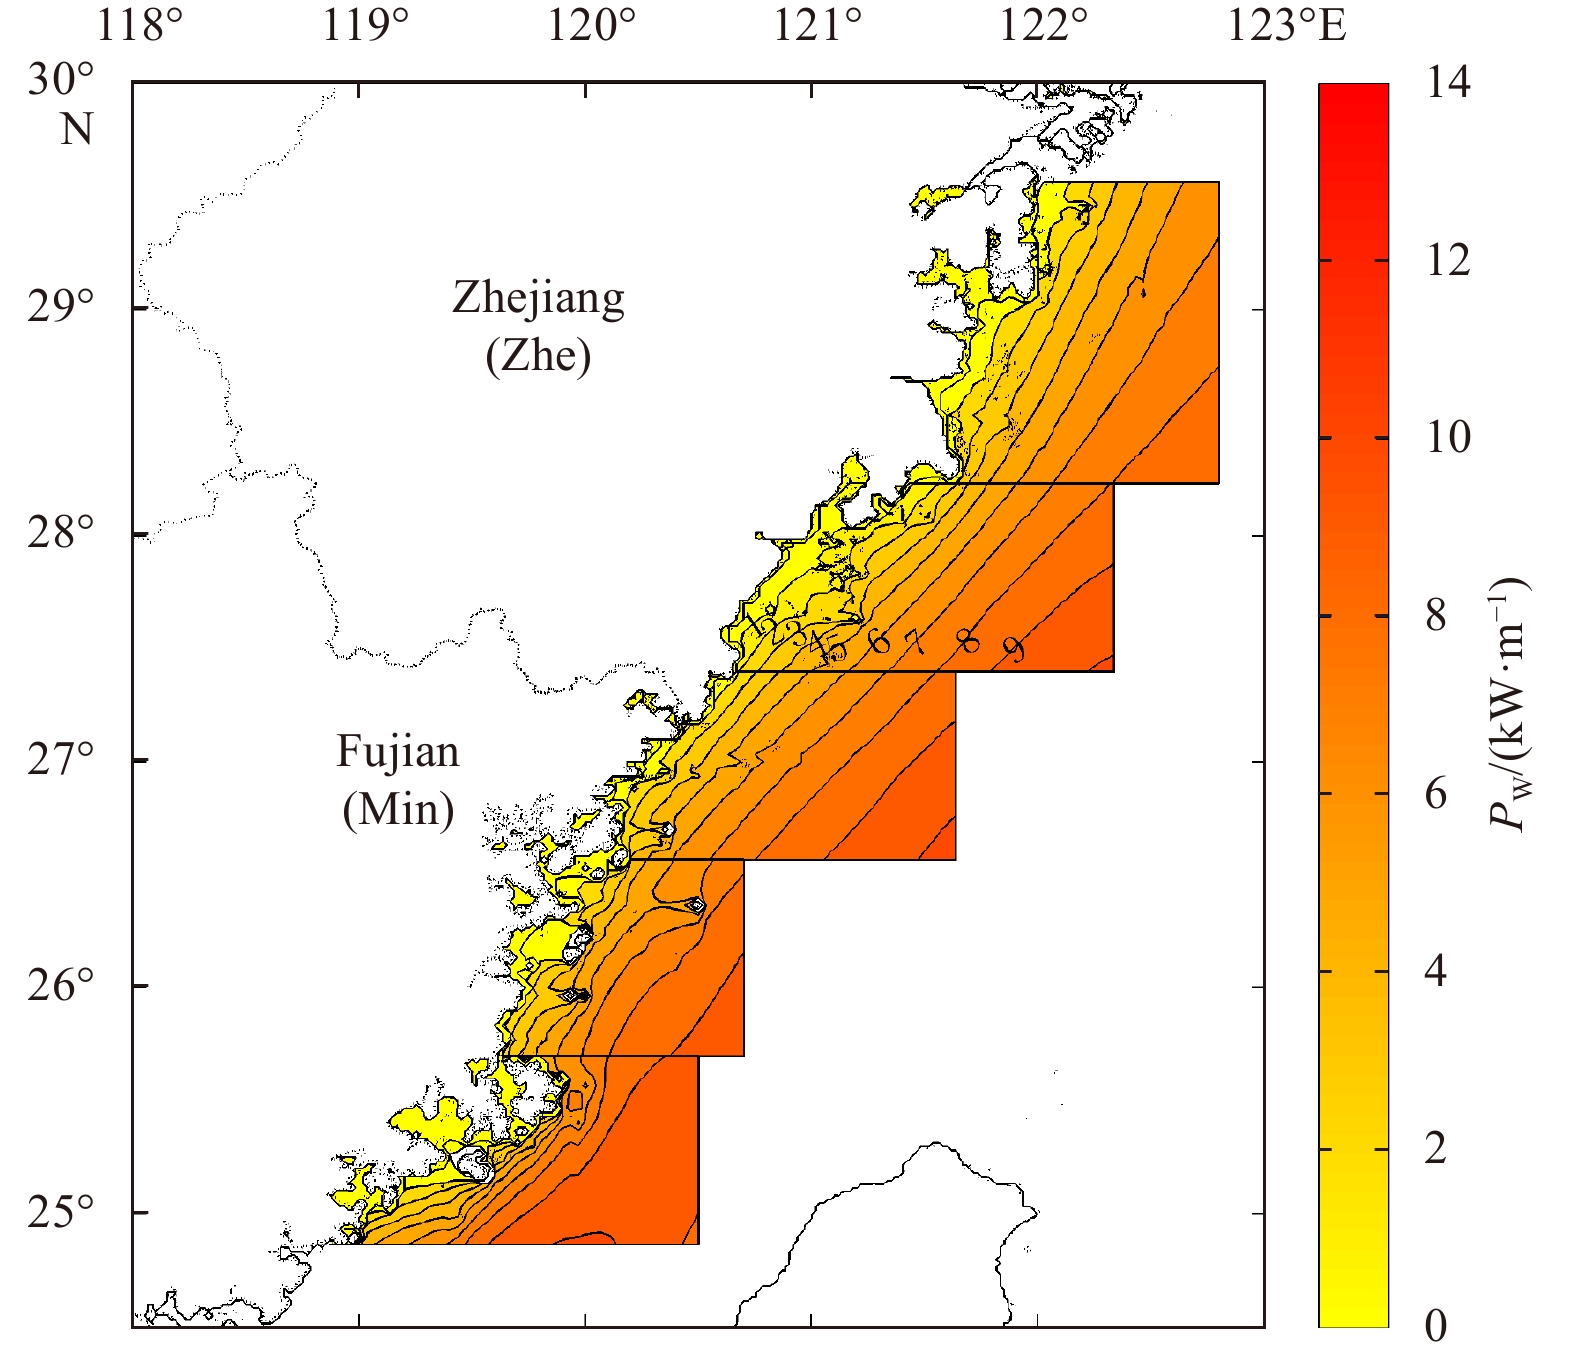
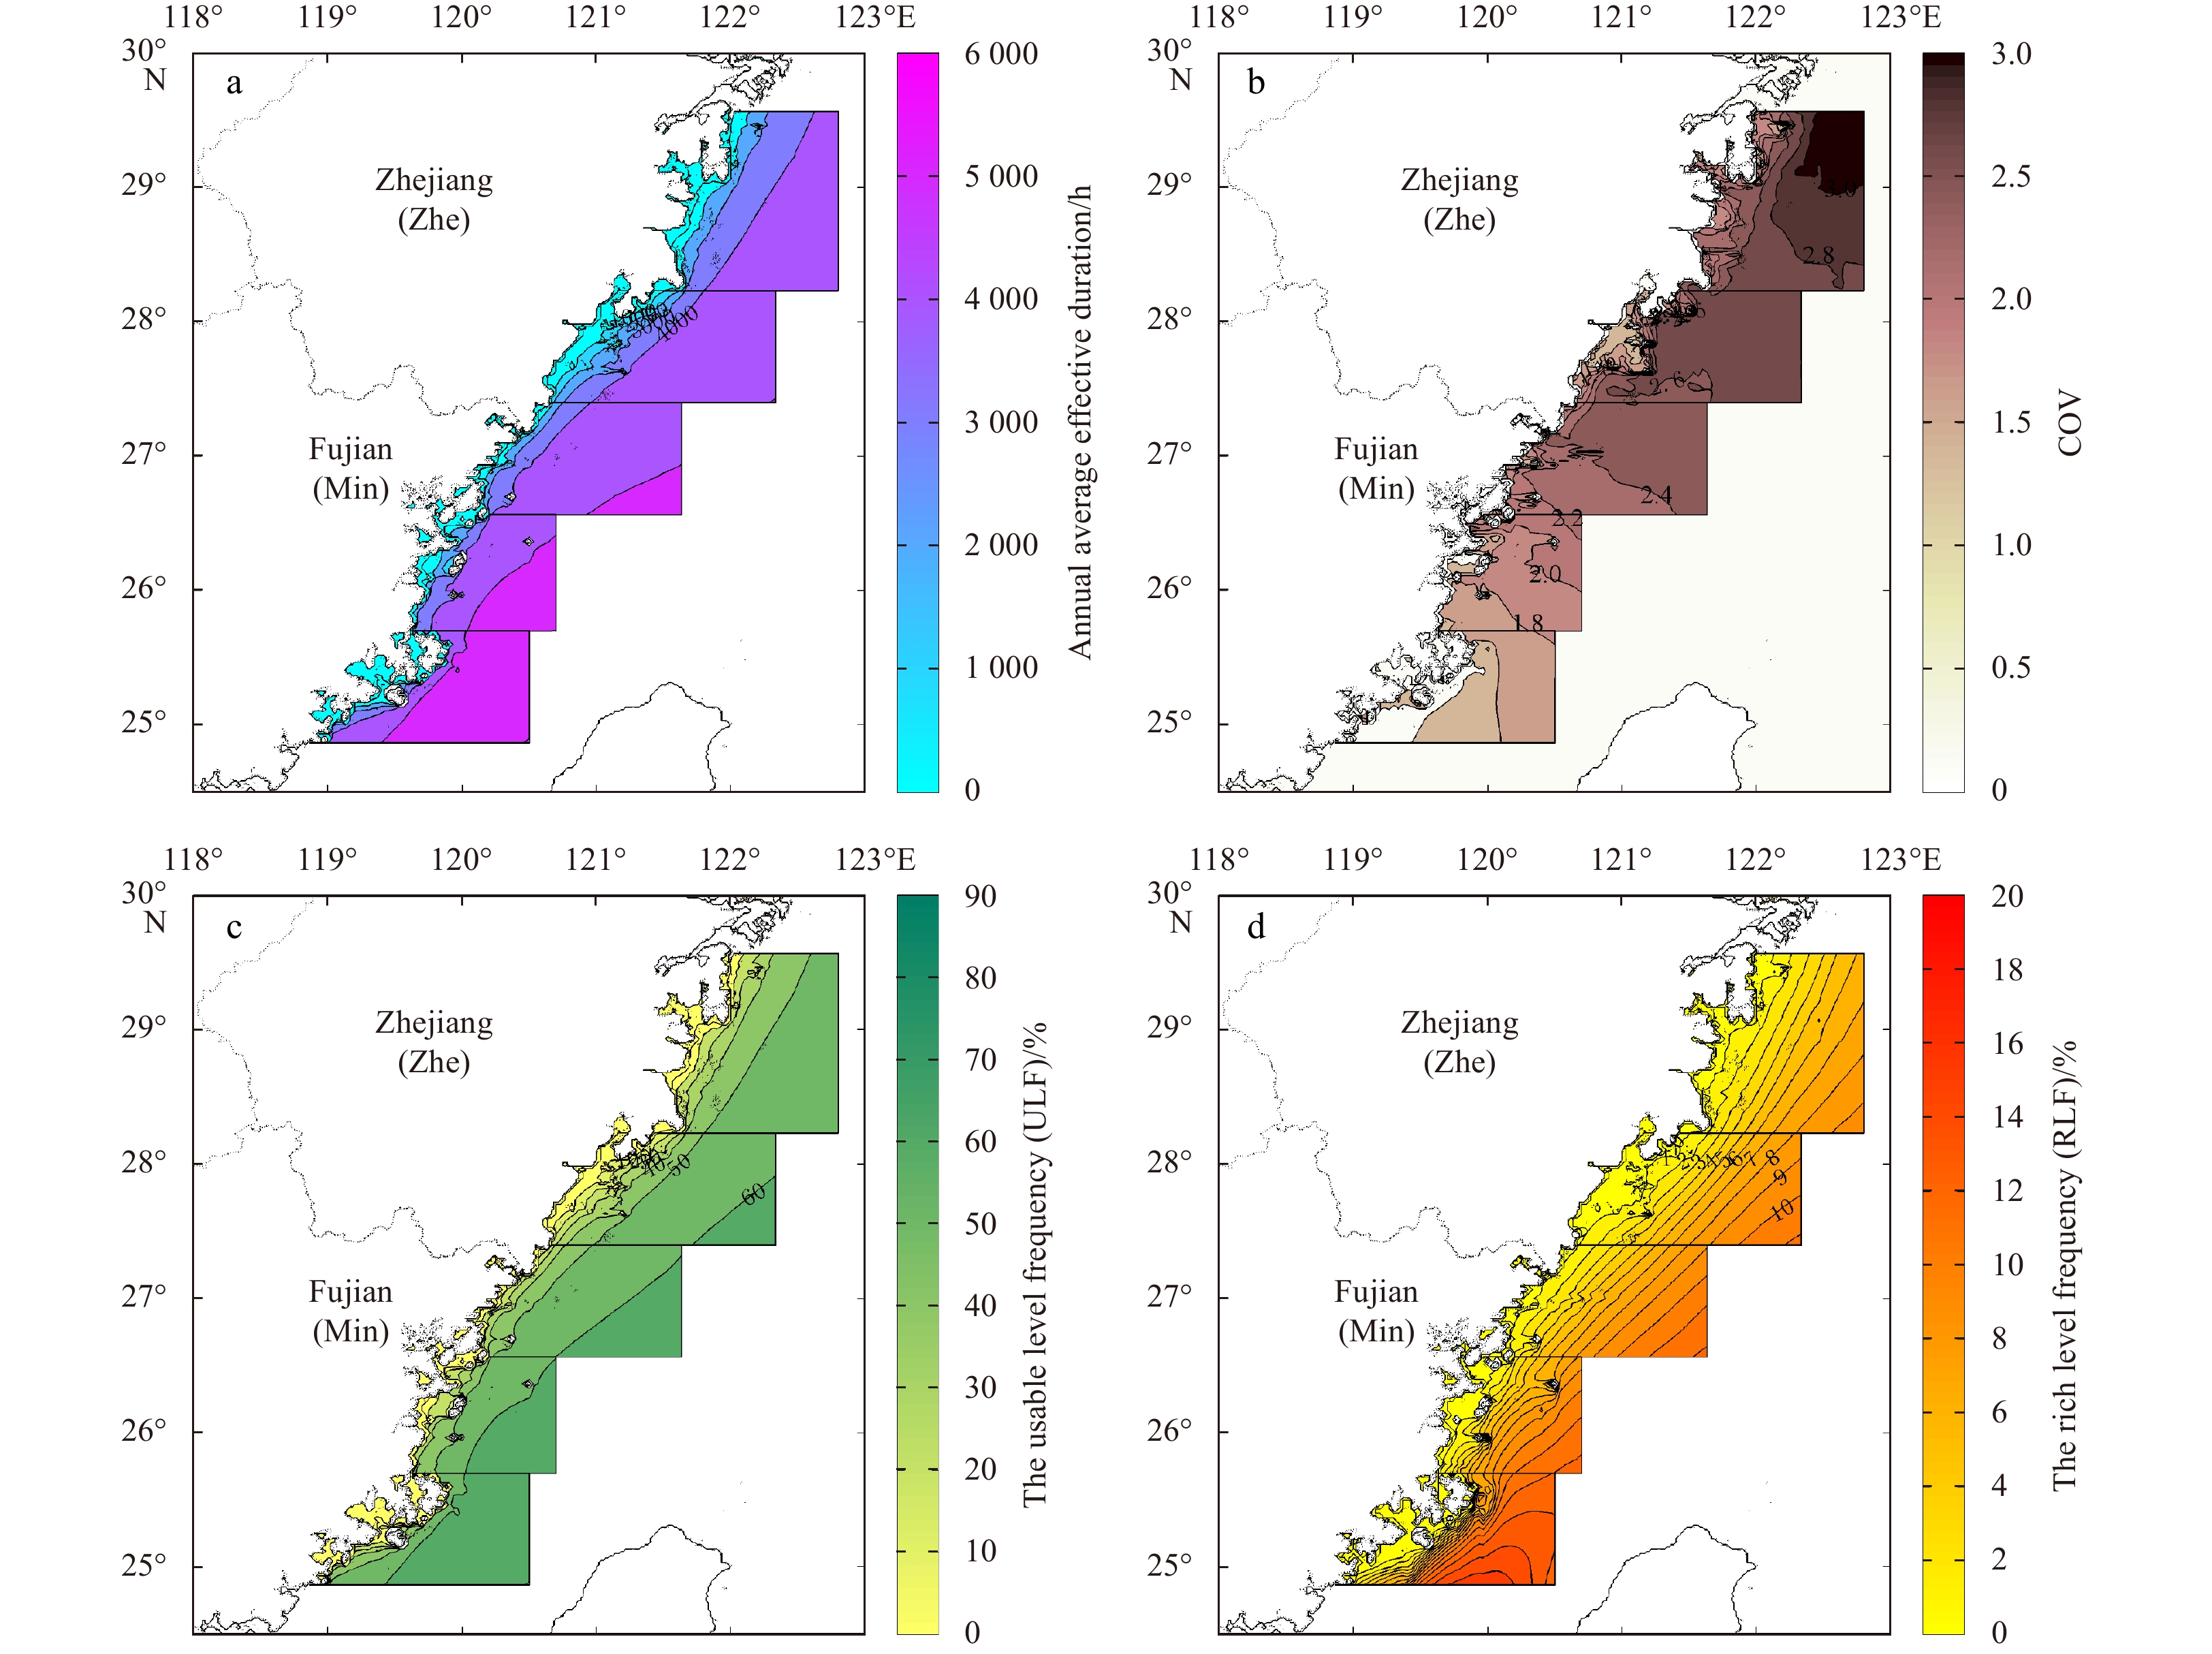
Abstract: A 10-year (2003–2012) hindcast was conducted to study the wave field in the Zhe-Min coastal area (Key Area OE-W2) located off Zhejiang and Fujian provinces of China. Forced by the wind field from a weather research and forecasting model (WRF), high-resolution wave modelling using the SWAN was carried out in the study area. The simulated wave fields show a good agreement with observations. Using the simulation results, we conducted statistical analysis of wave power density in terms of spatial distribution and temporal variation. The effective duration of wave energy in the sea area was discussed, and the stability of wave energy was evaluated using the coefficient of variation of wave power density. Results indicate that the wave energy resource in the study area was about 4.11×10⁶ kW. The distribution of wave energy tends to increase from the north (off Zhejiang coast) to the south (off Fujian coast), and from near-shore area to the open sea. The sea areas with wave power density greater than 2 kW/m are mostly distributed seaward of the 10-m isobath, and the contours of the wave power density are almost parallel to the shoreline. The sea areas around the islands that are far from the mainland are rich in wave energy, usually more than 6 kW/m, and therefore are of obvious advantages in planning wave energy development and utilization. The effective duration of wave energy in the offshore area shows an increasing trend from north (off Zhejiang coast) to south (off Fujian coast), with values of ~3 500 h in the north and ~4 450 h in the south. The coefficient of variation of wave energy in this region is mostly in the range of 1.5–3.0, and gradually decreases from the north to the south, suggesting that the wave energy in the south is more stable than that in the north.
-
Key words:
- SWAN model /
- wave energy /
- wave power density /
- effective duration /
- Zhe-Min coastal area
-
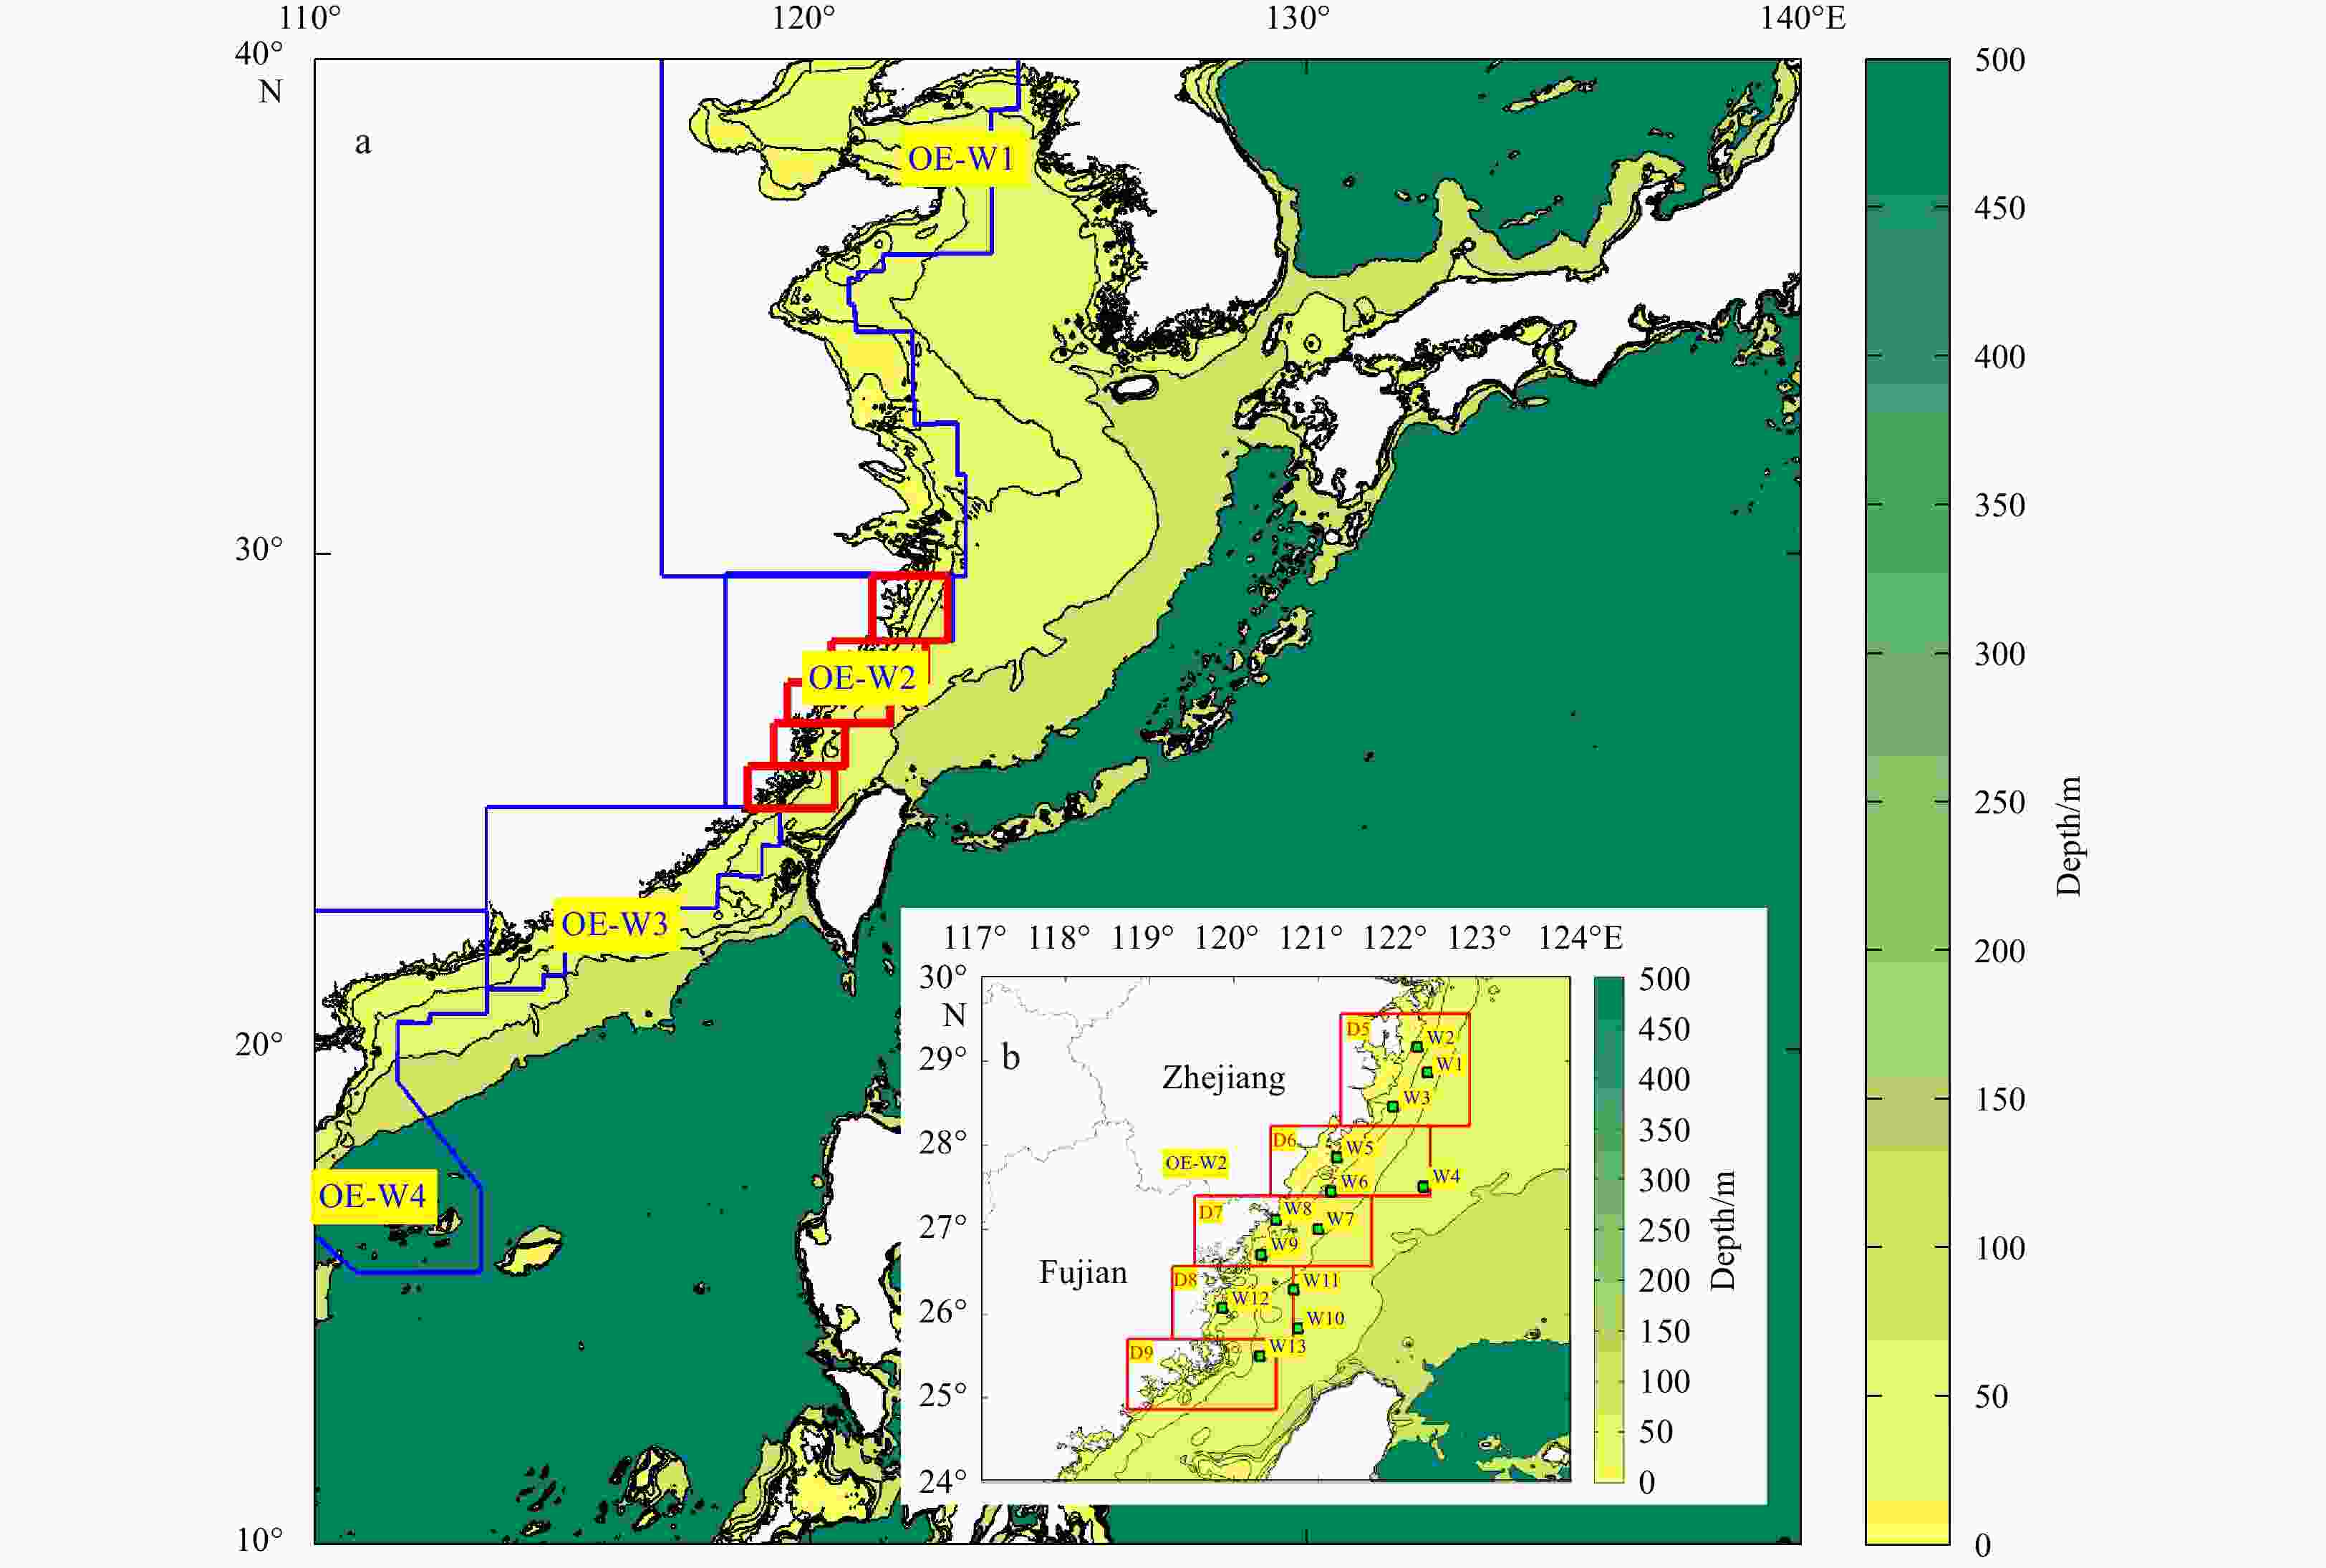
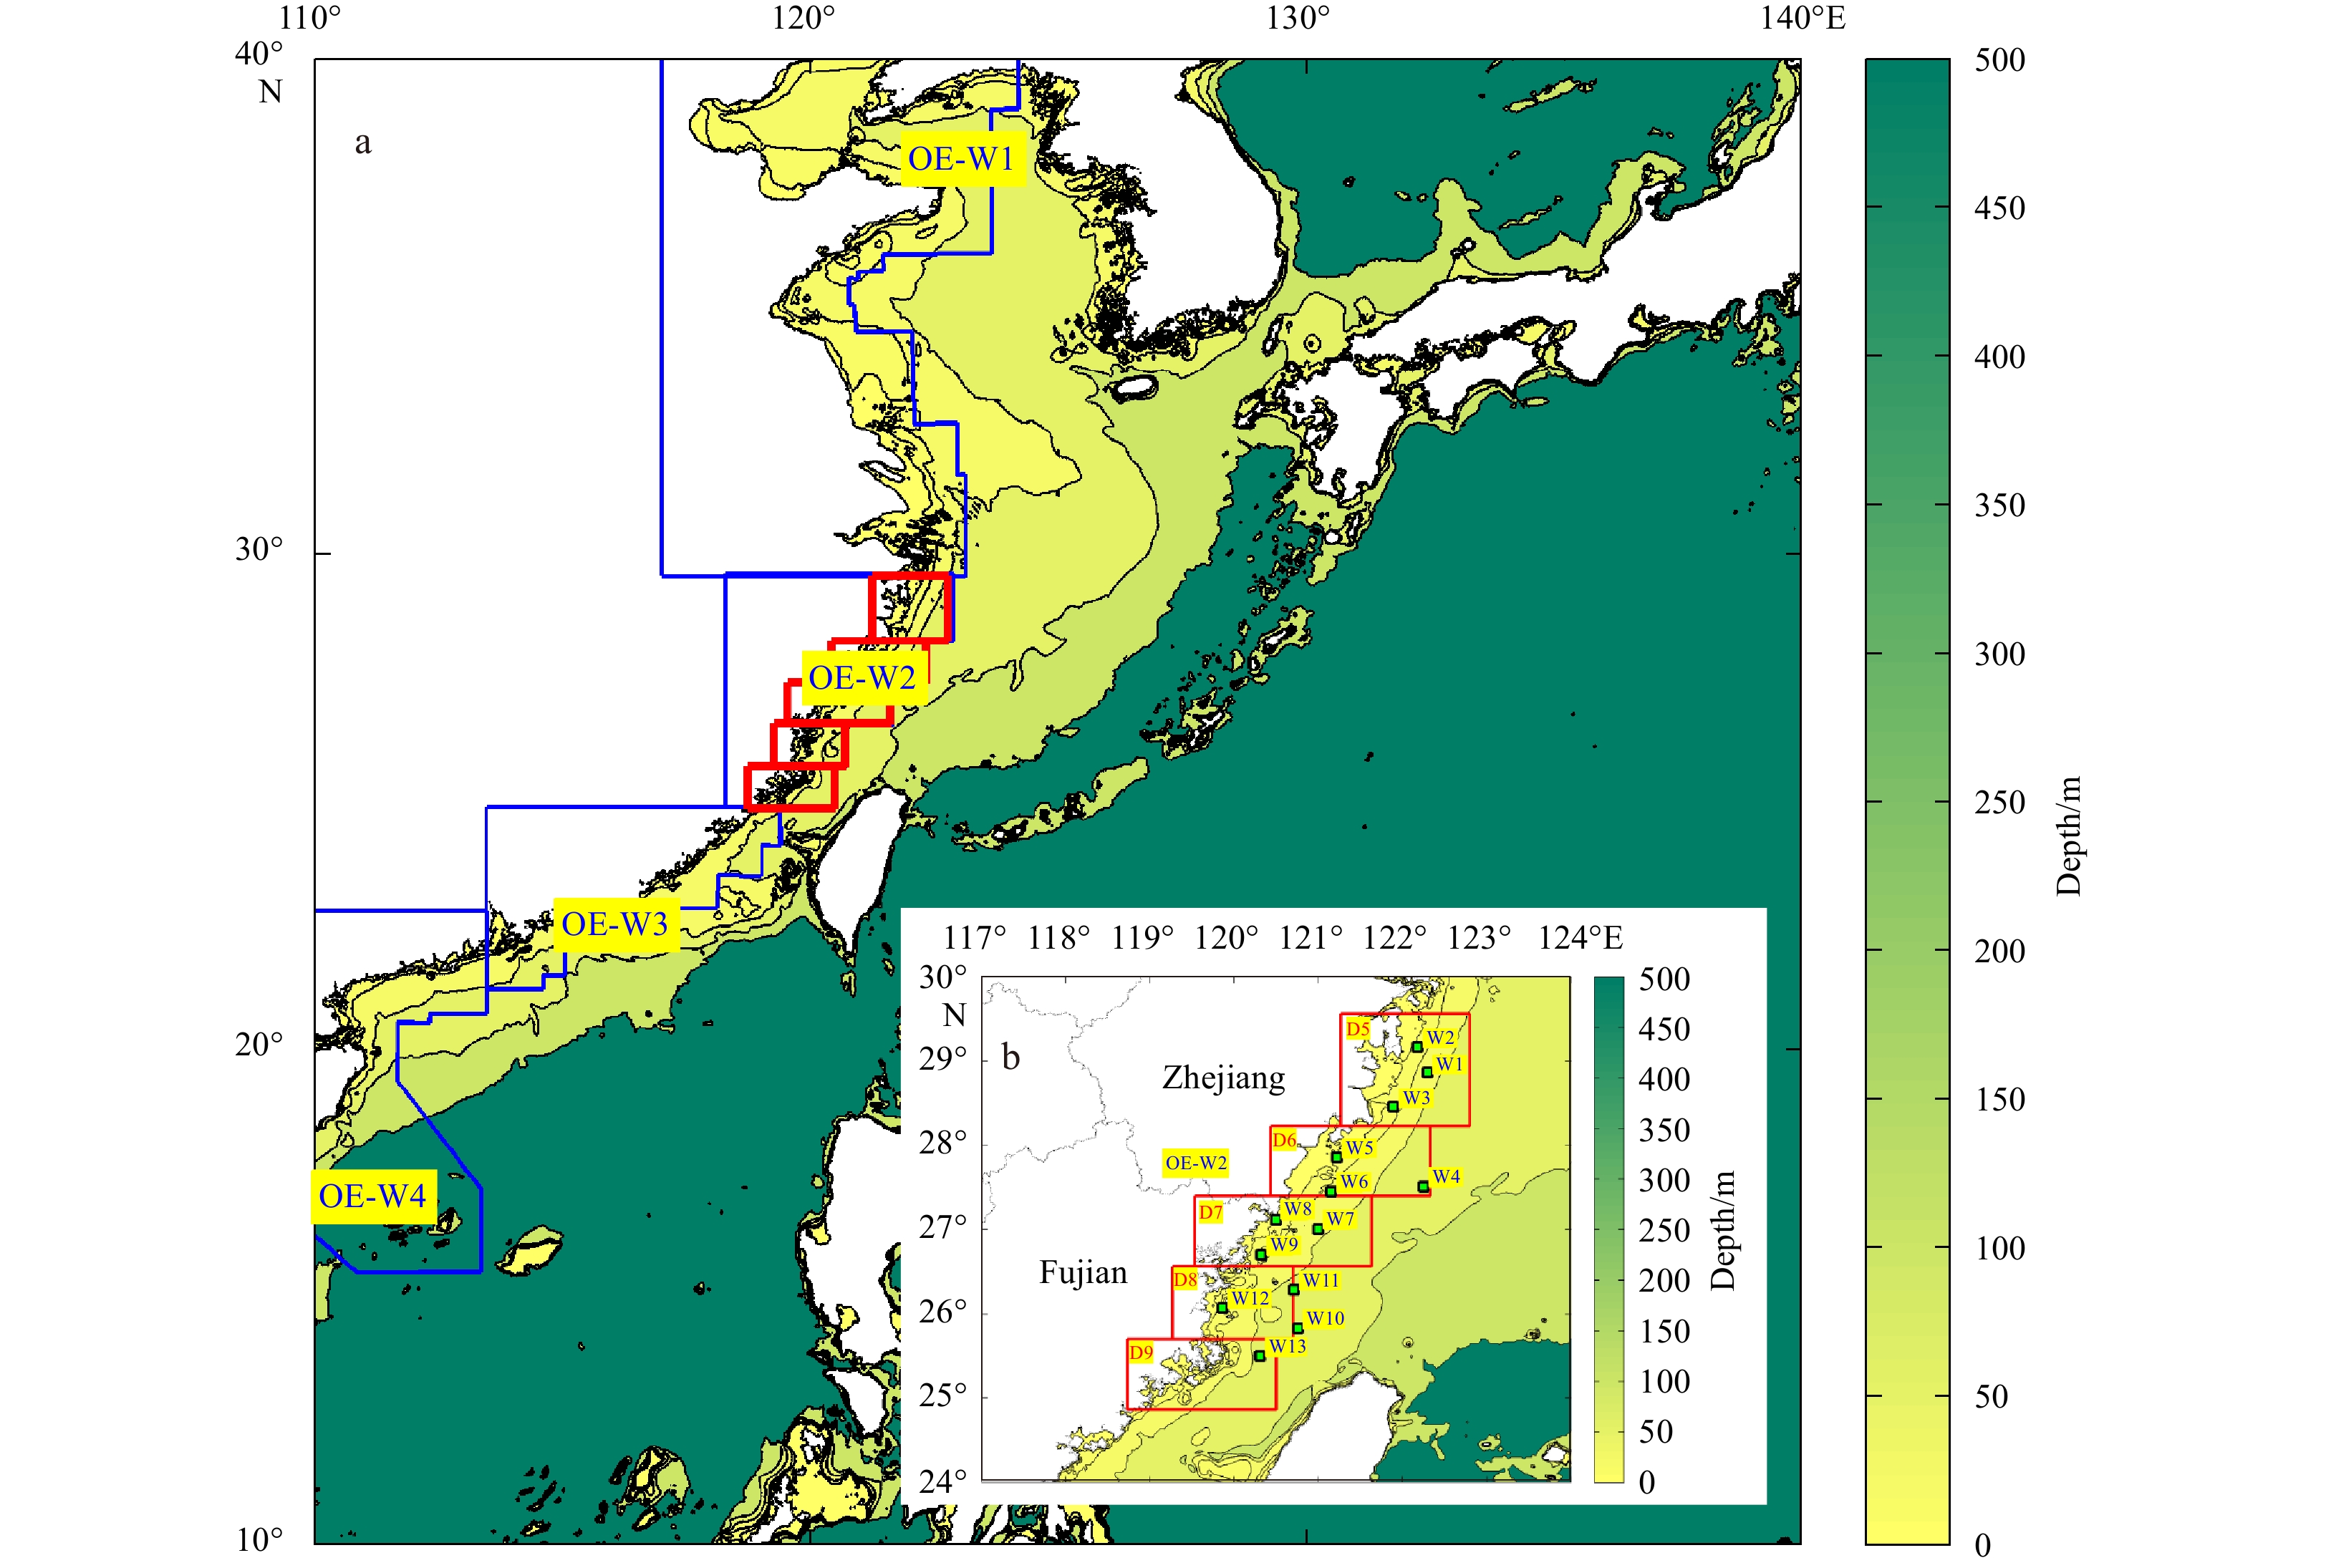
Figure 1. Schematic of three-nested grids (a) and wave observation stations in each key area with in OE-W2 (b). Blue polygons named as OE-W1, OE-W2, OE-W3 and OE-W4 are four areas divided by the national project, here only Region OE-W2 is studied; five red rectangles named D5−D9 denote the boundaries of small child grids in the wave model; W1−W13 indicate the gauge stations.
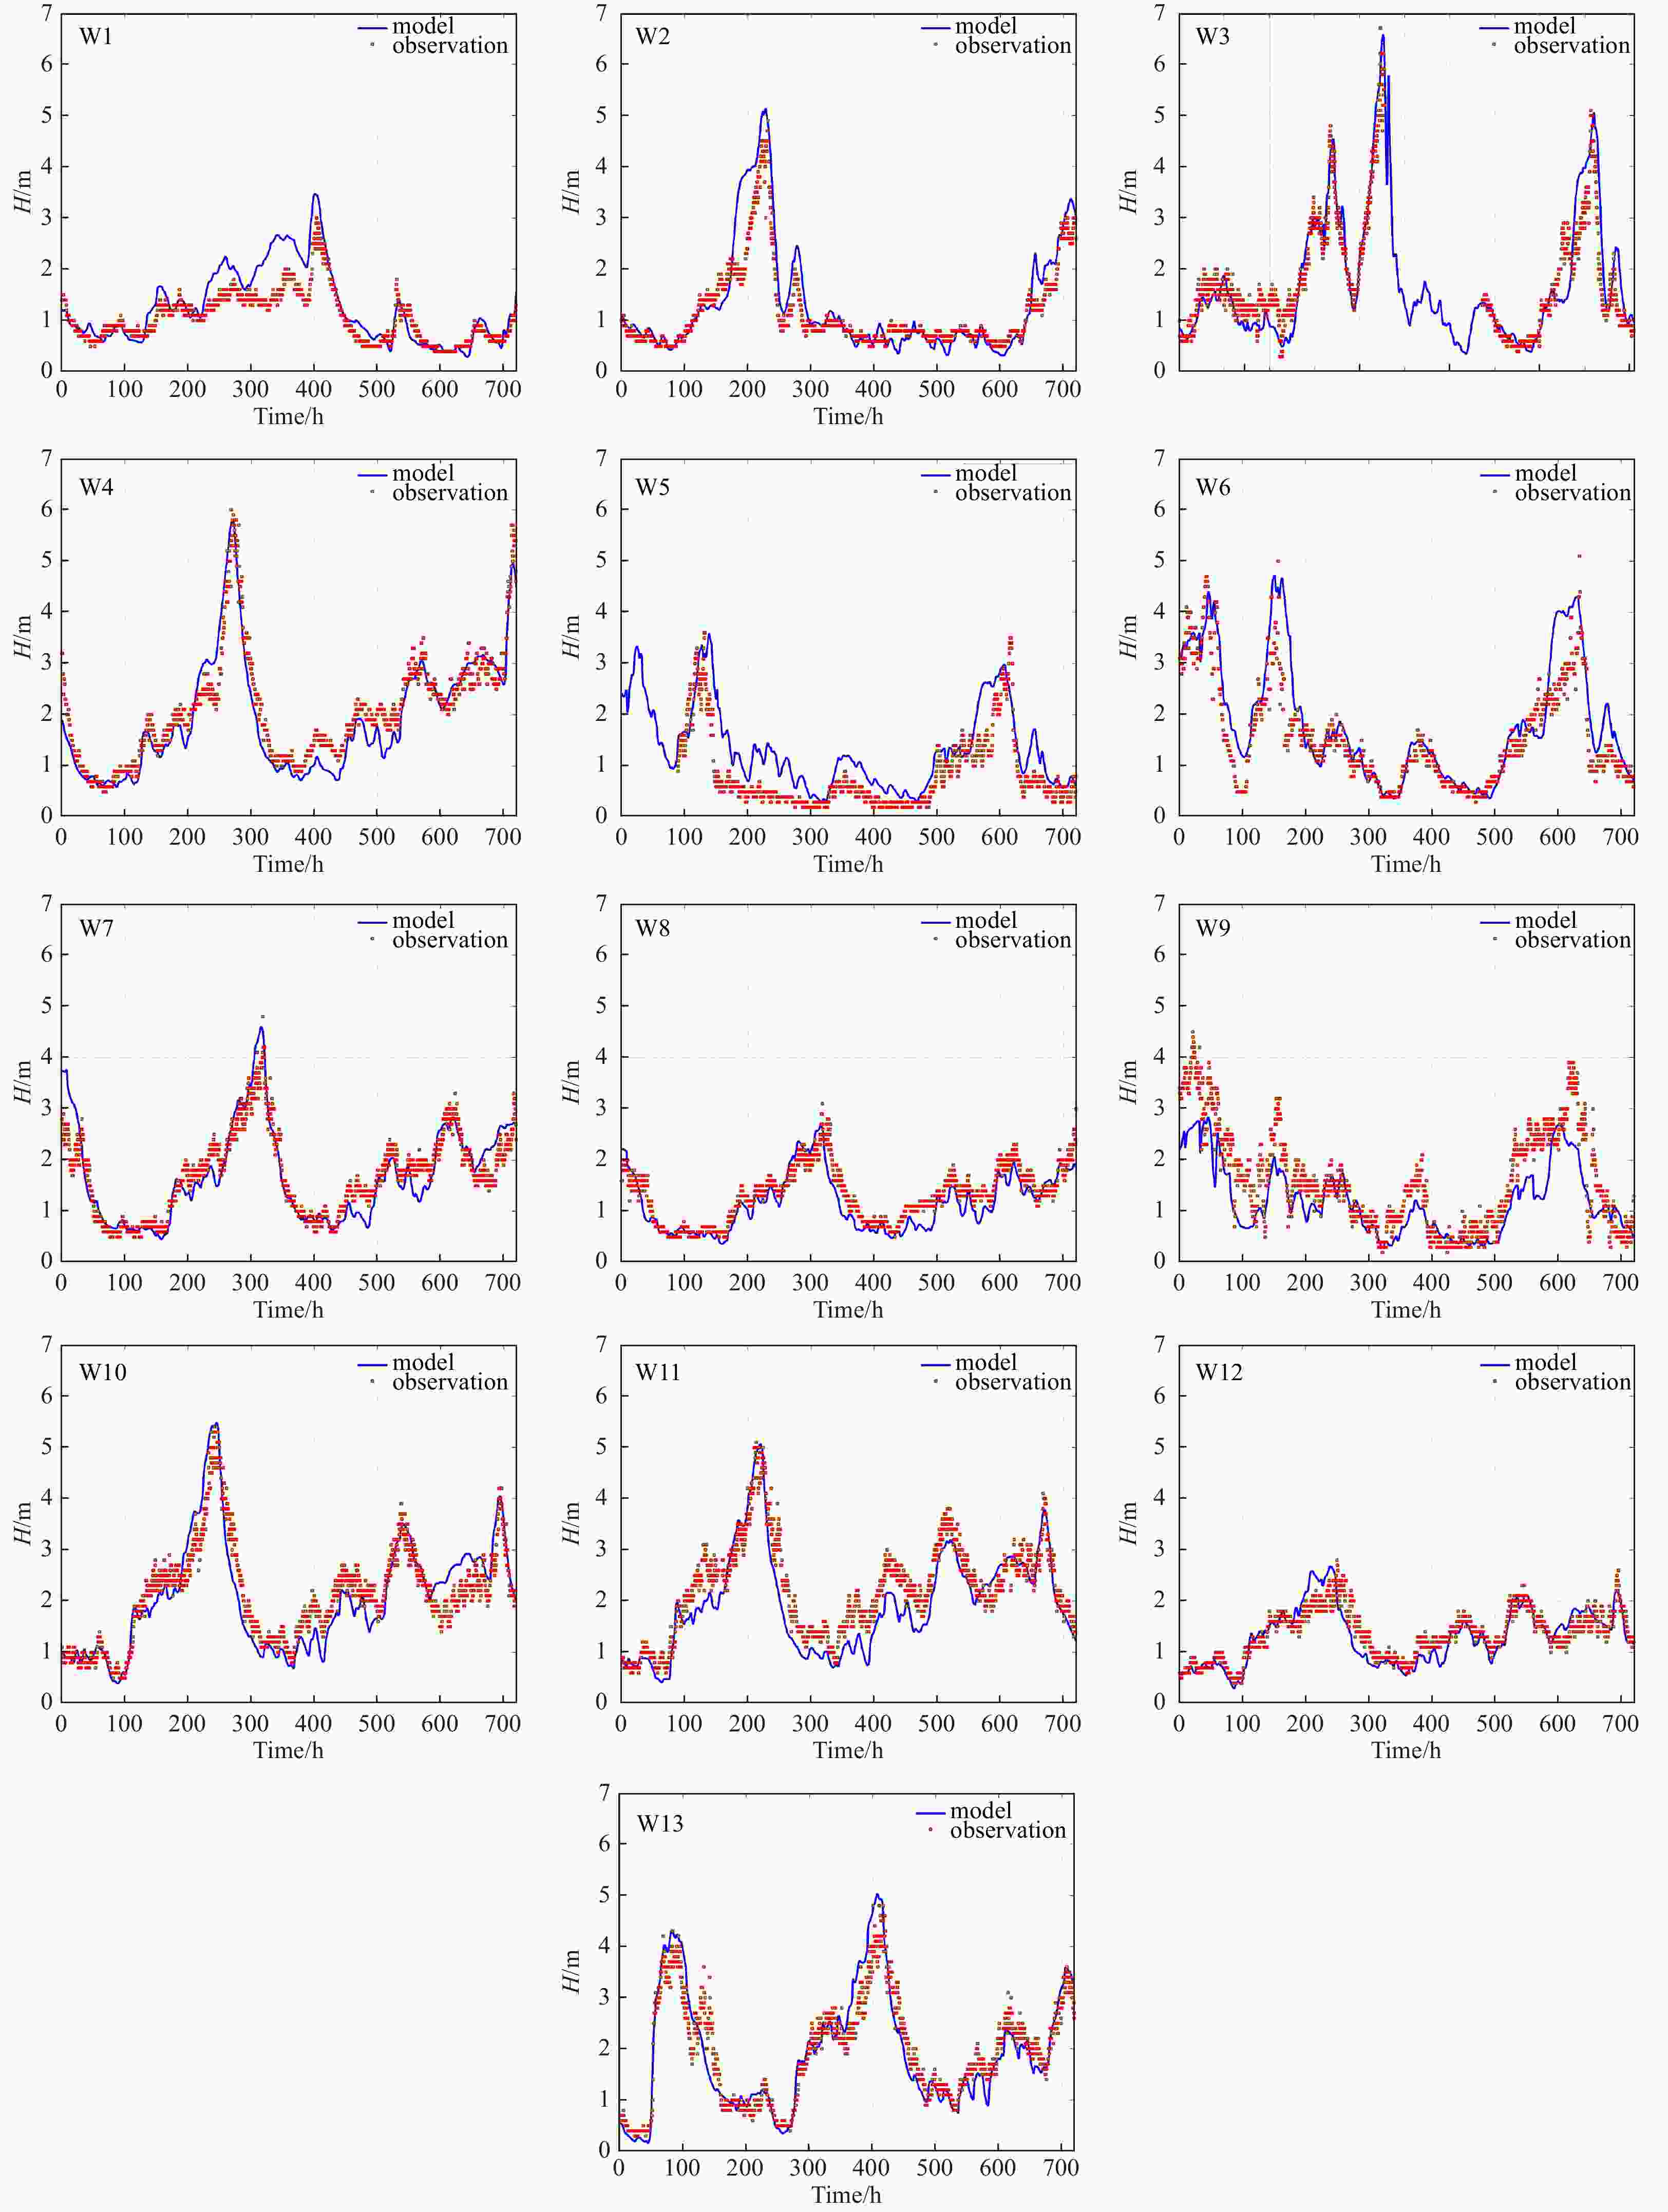
Figure 2. Comparison between measured (dots) and modeled (curve) significant wave height (HS) at the gauge stations W1−W13.
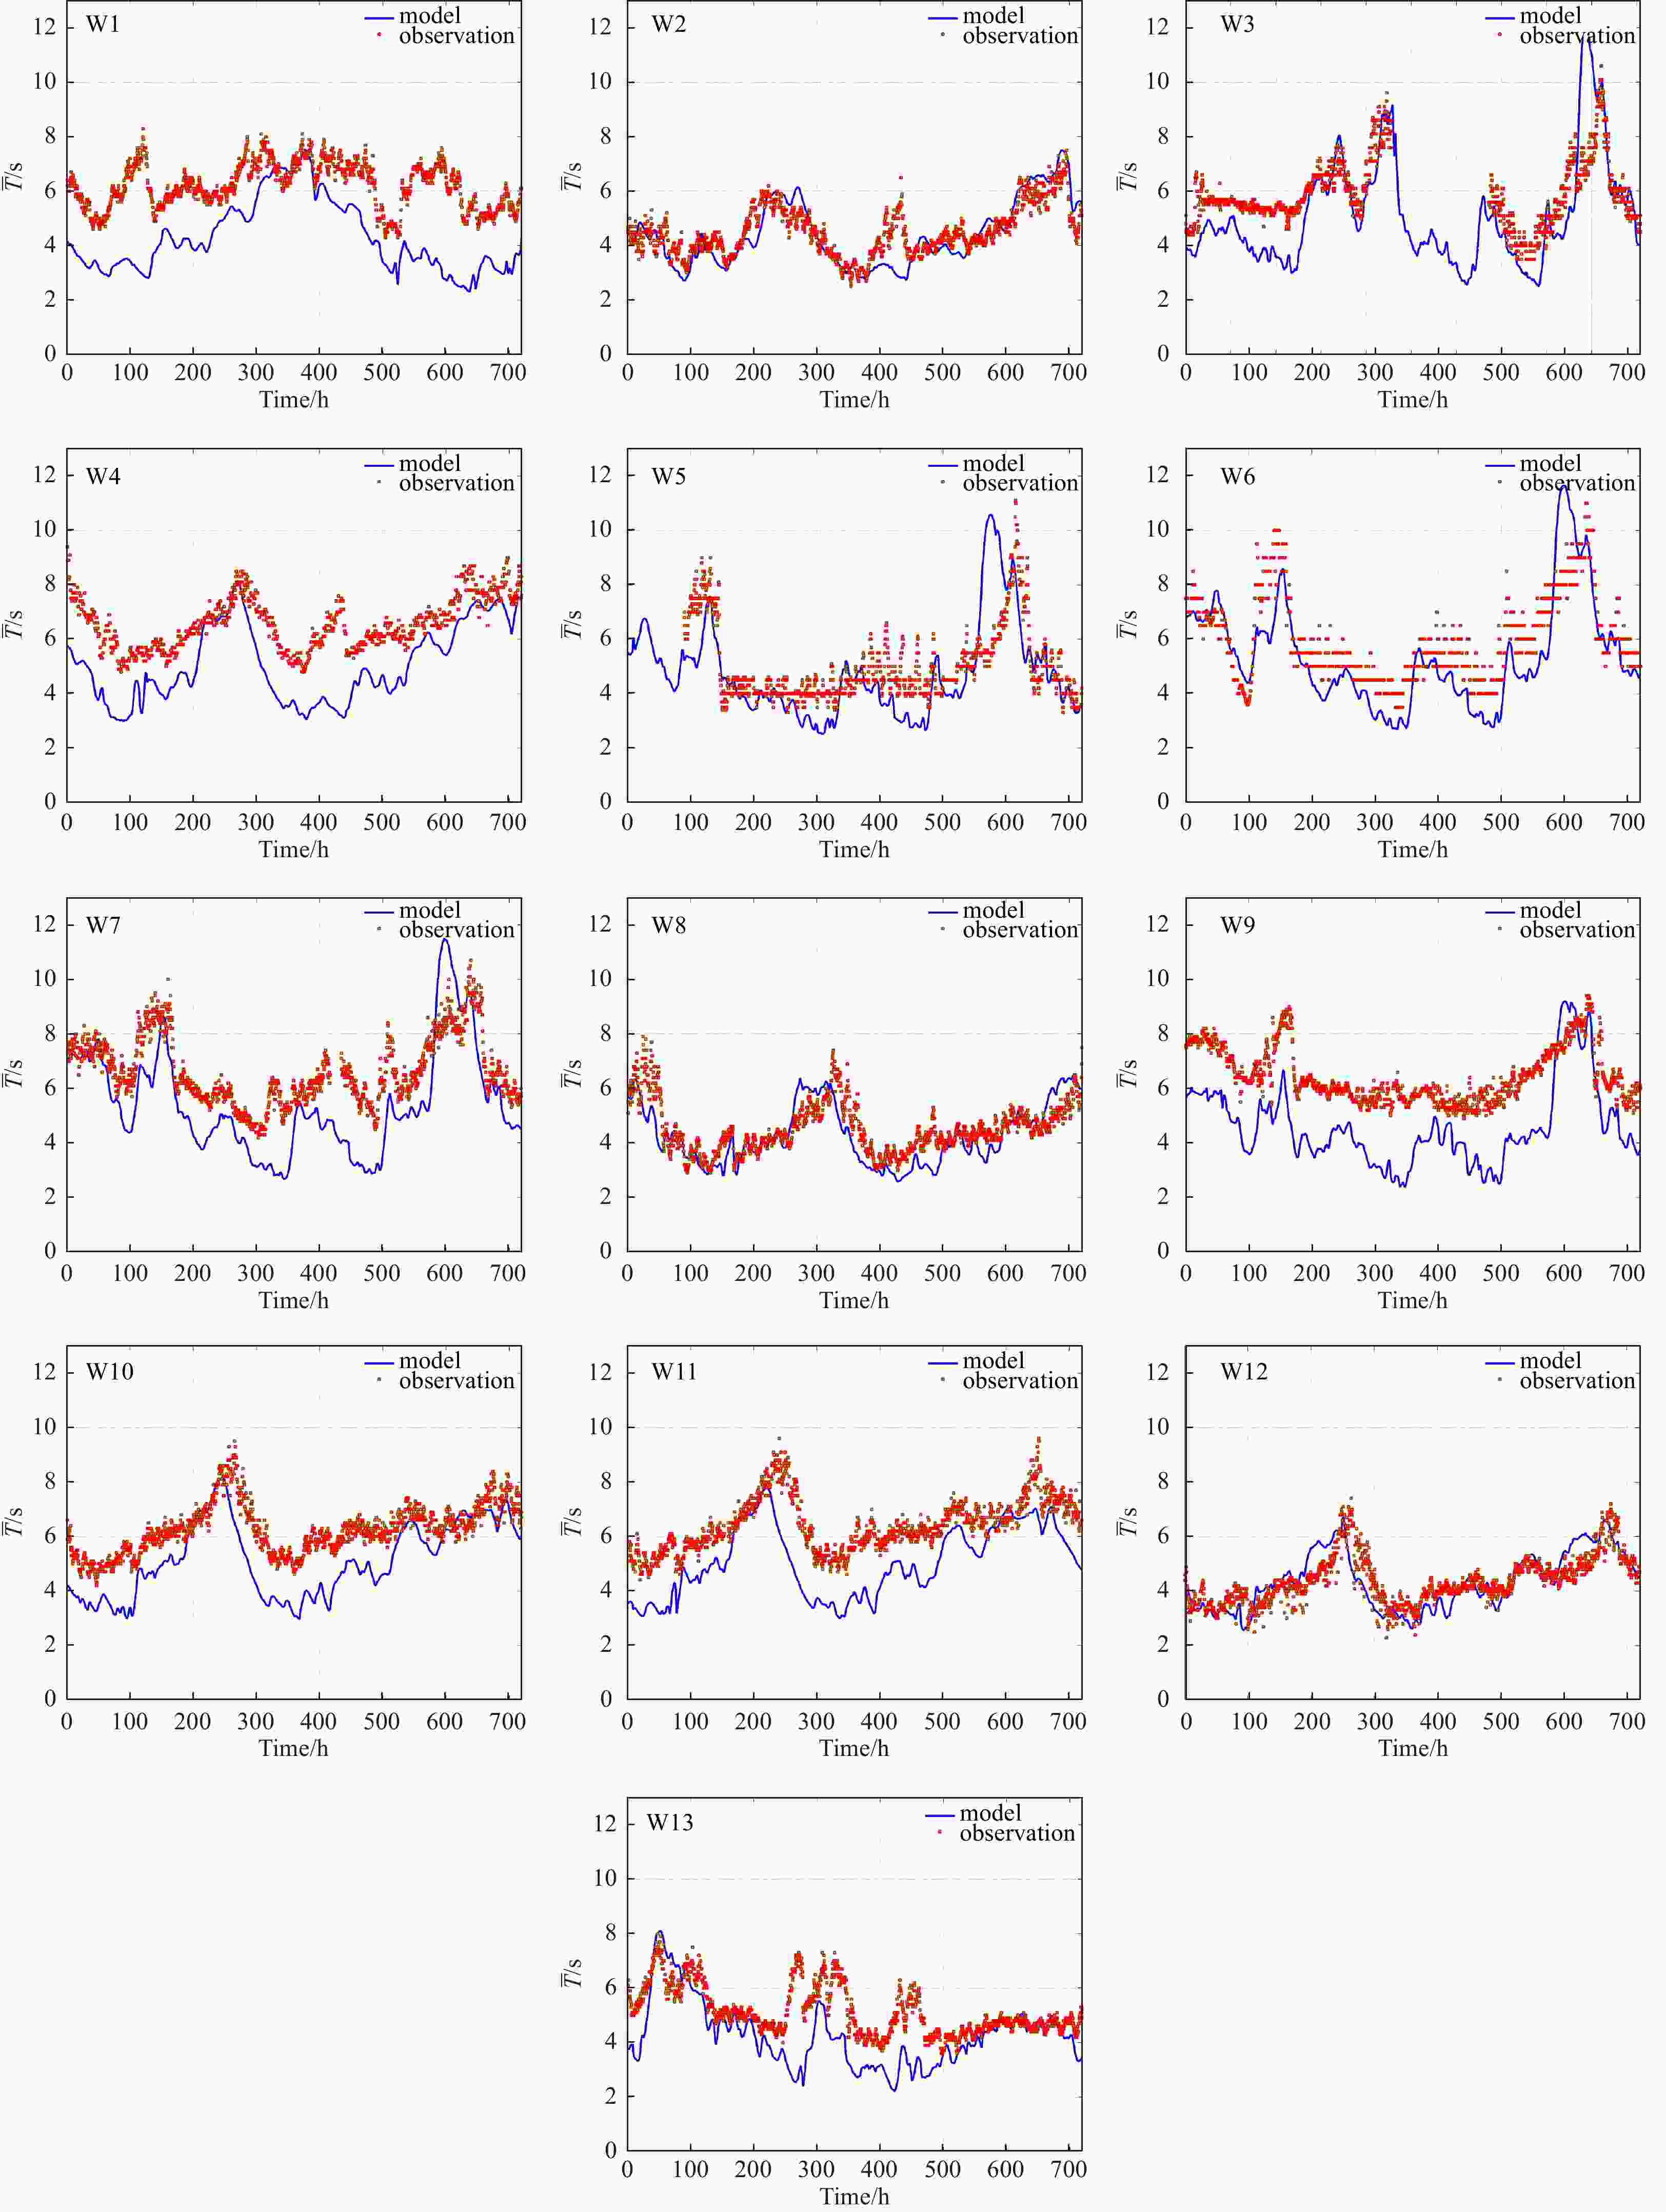
Figure 3. Comparison between measured (dots) and modeled (curve) mean wave period (
${\overline {T}}$ ) at the gauge stations W1−W13.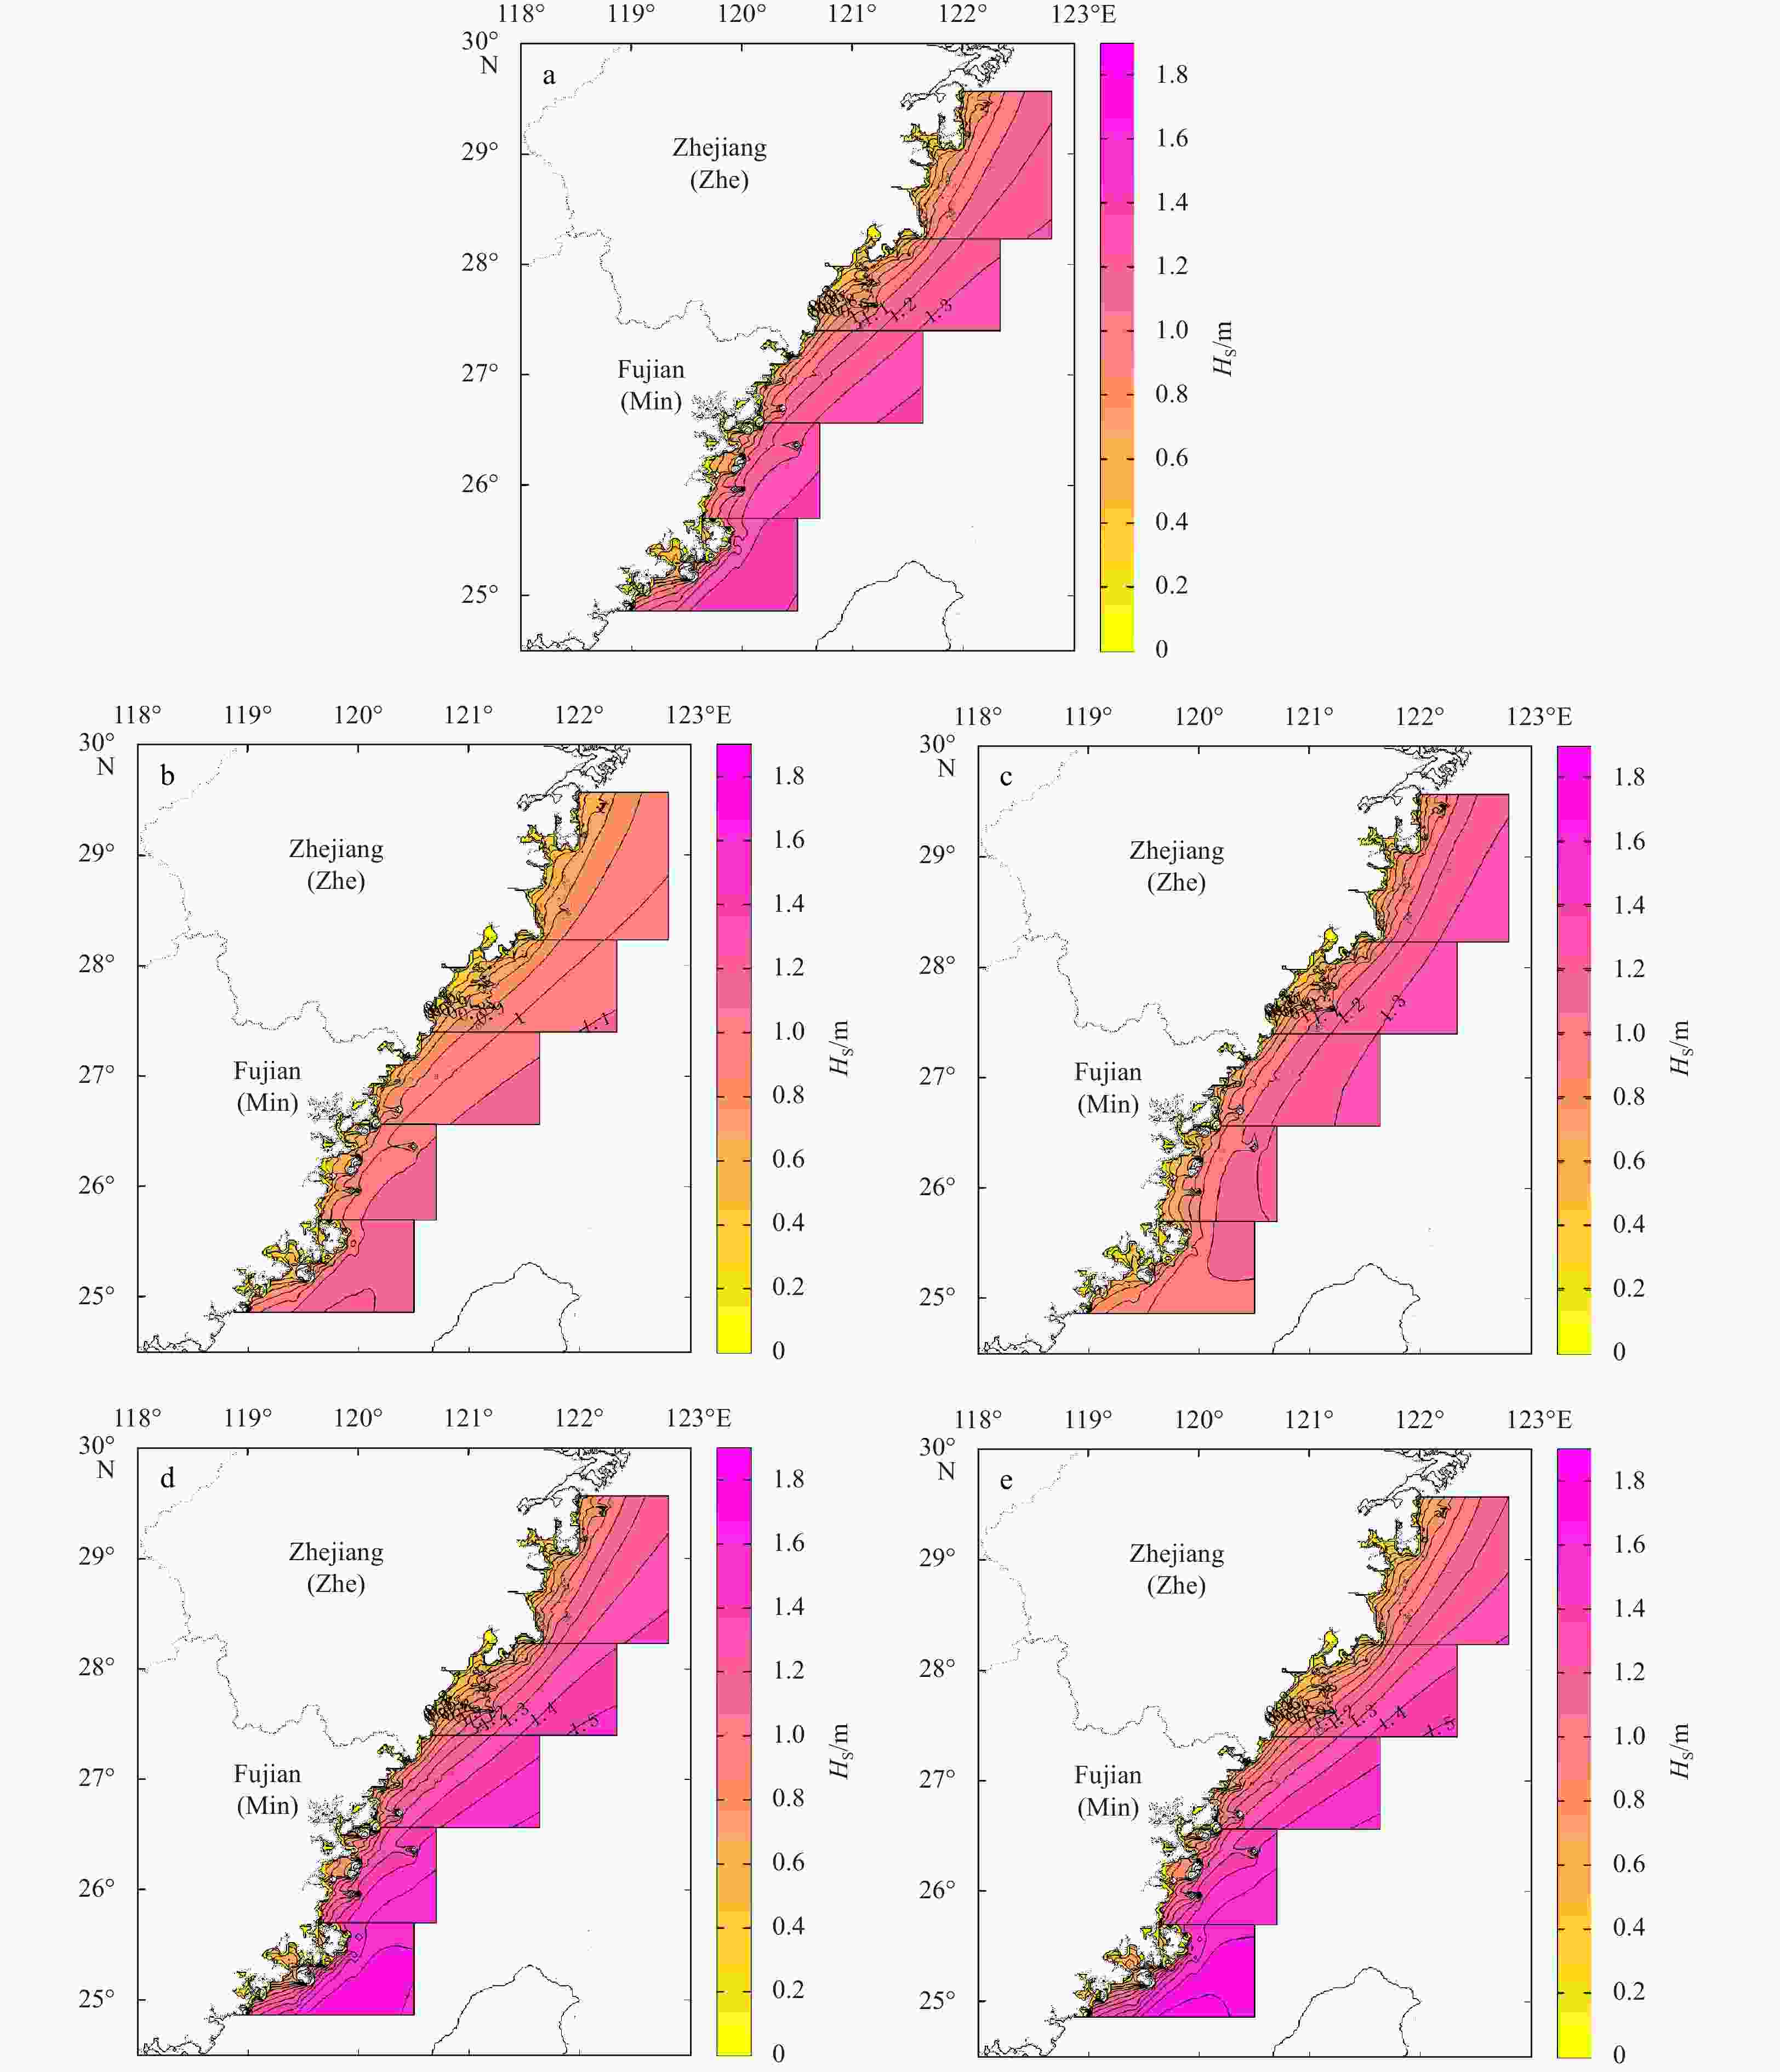
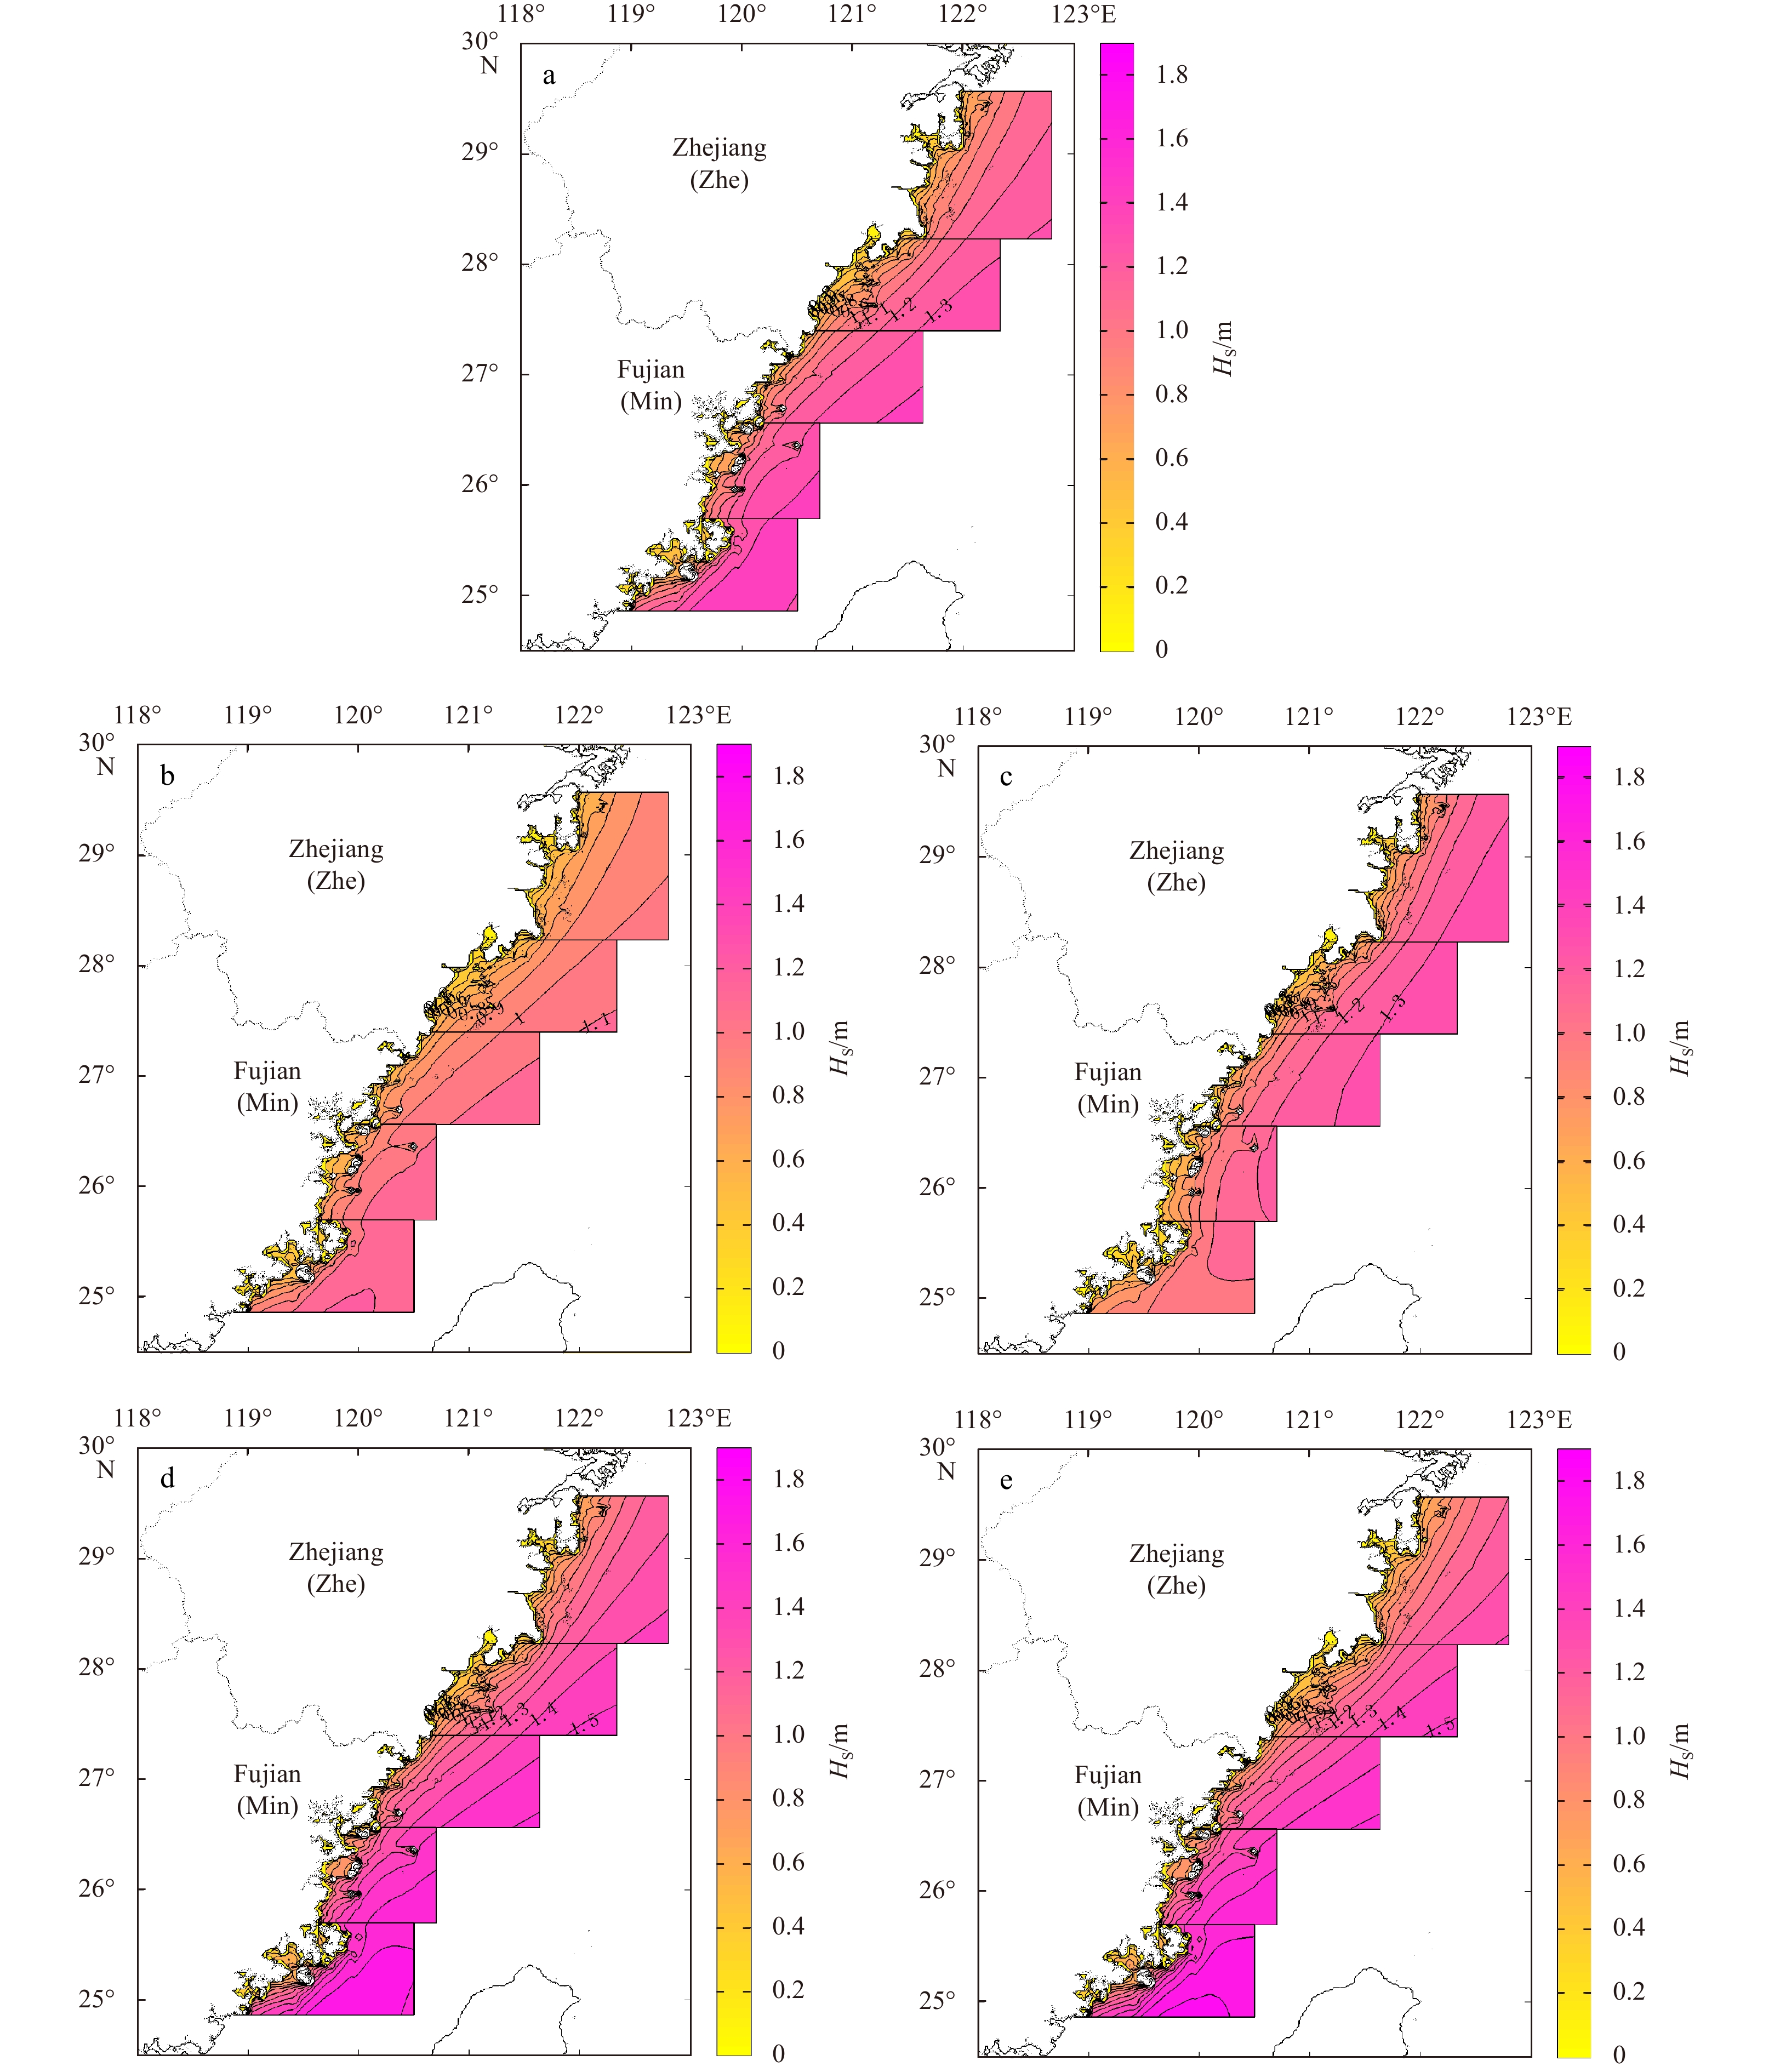
Figure 4. Spatial distributions of annual average (a), spring (b), summer (c), autumn (d), and winter (e) significant wave height (HS) .
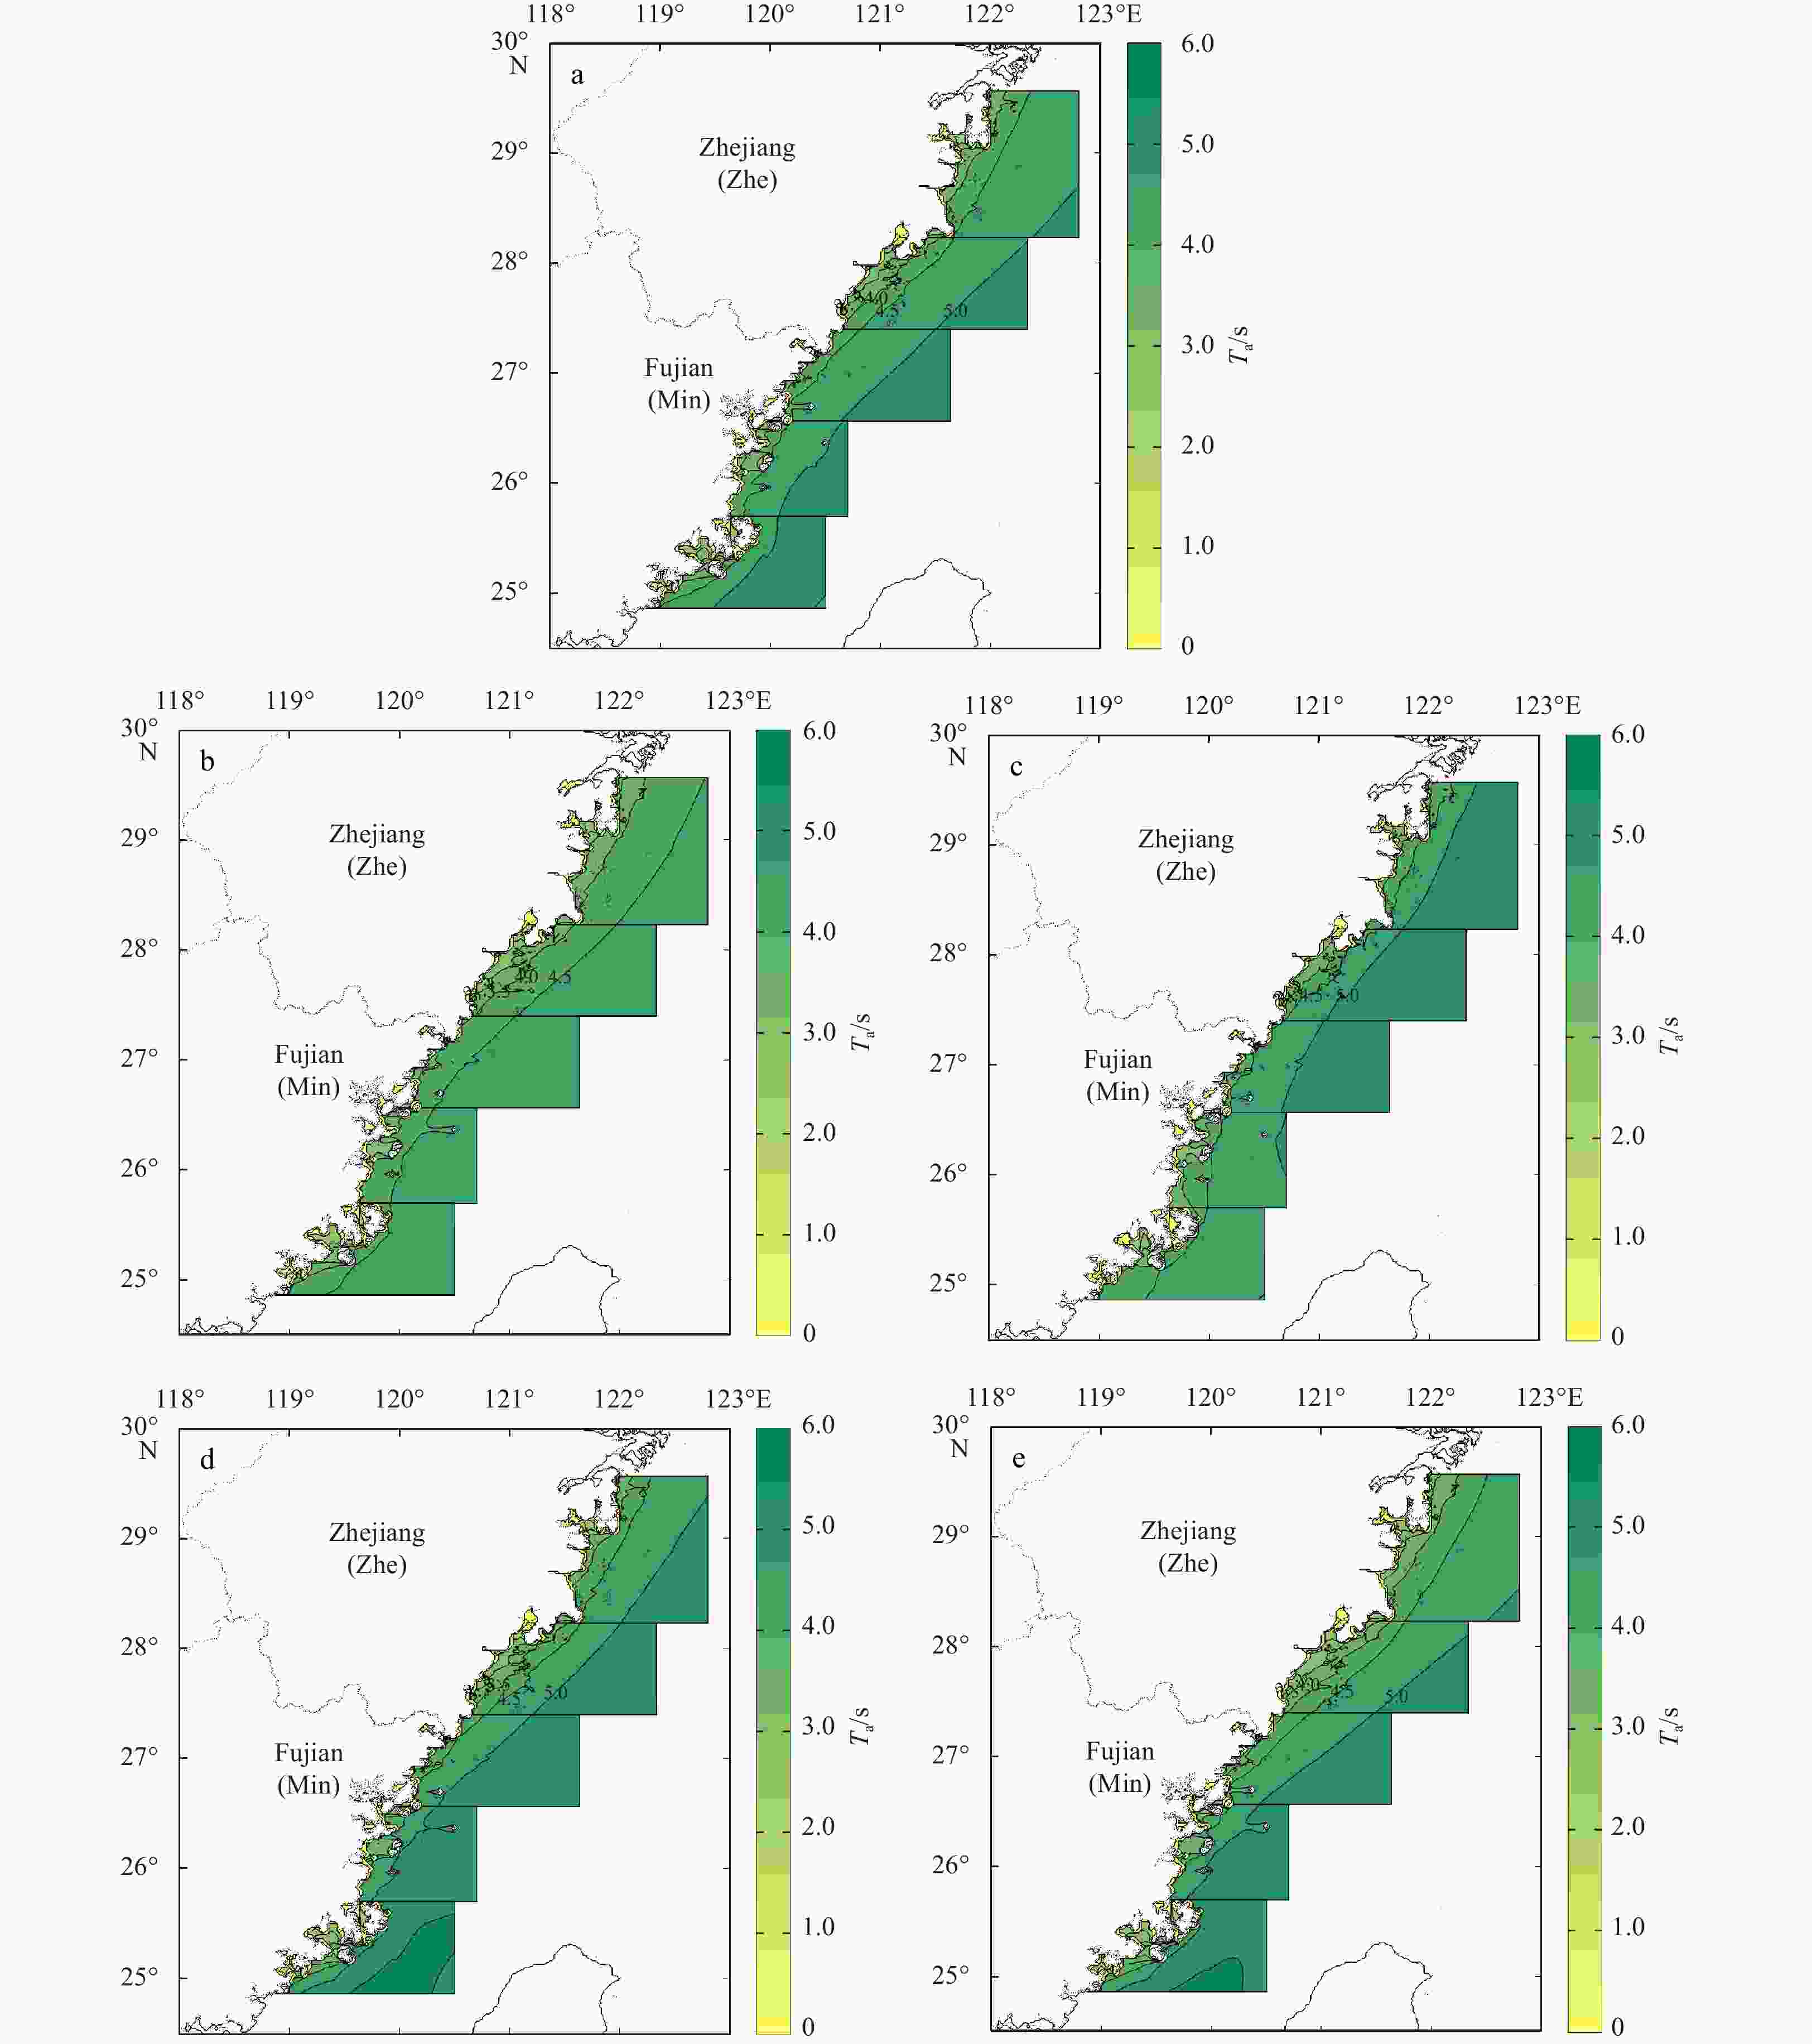
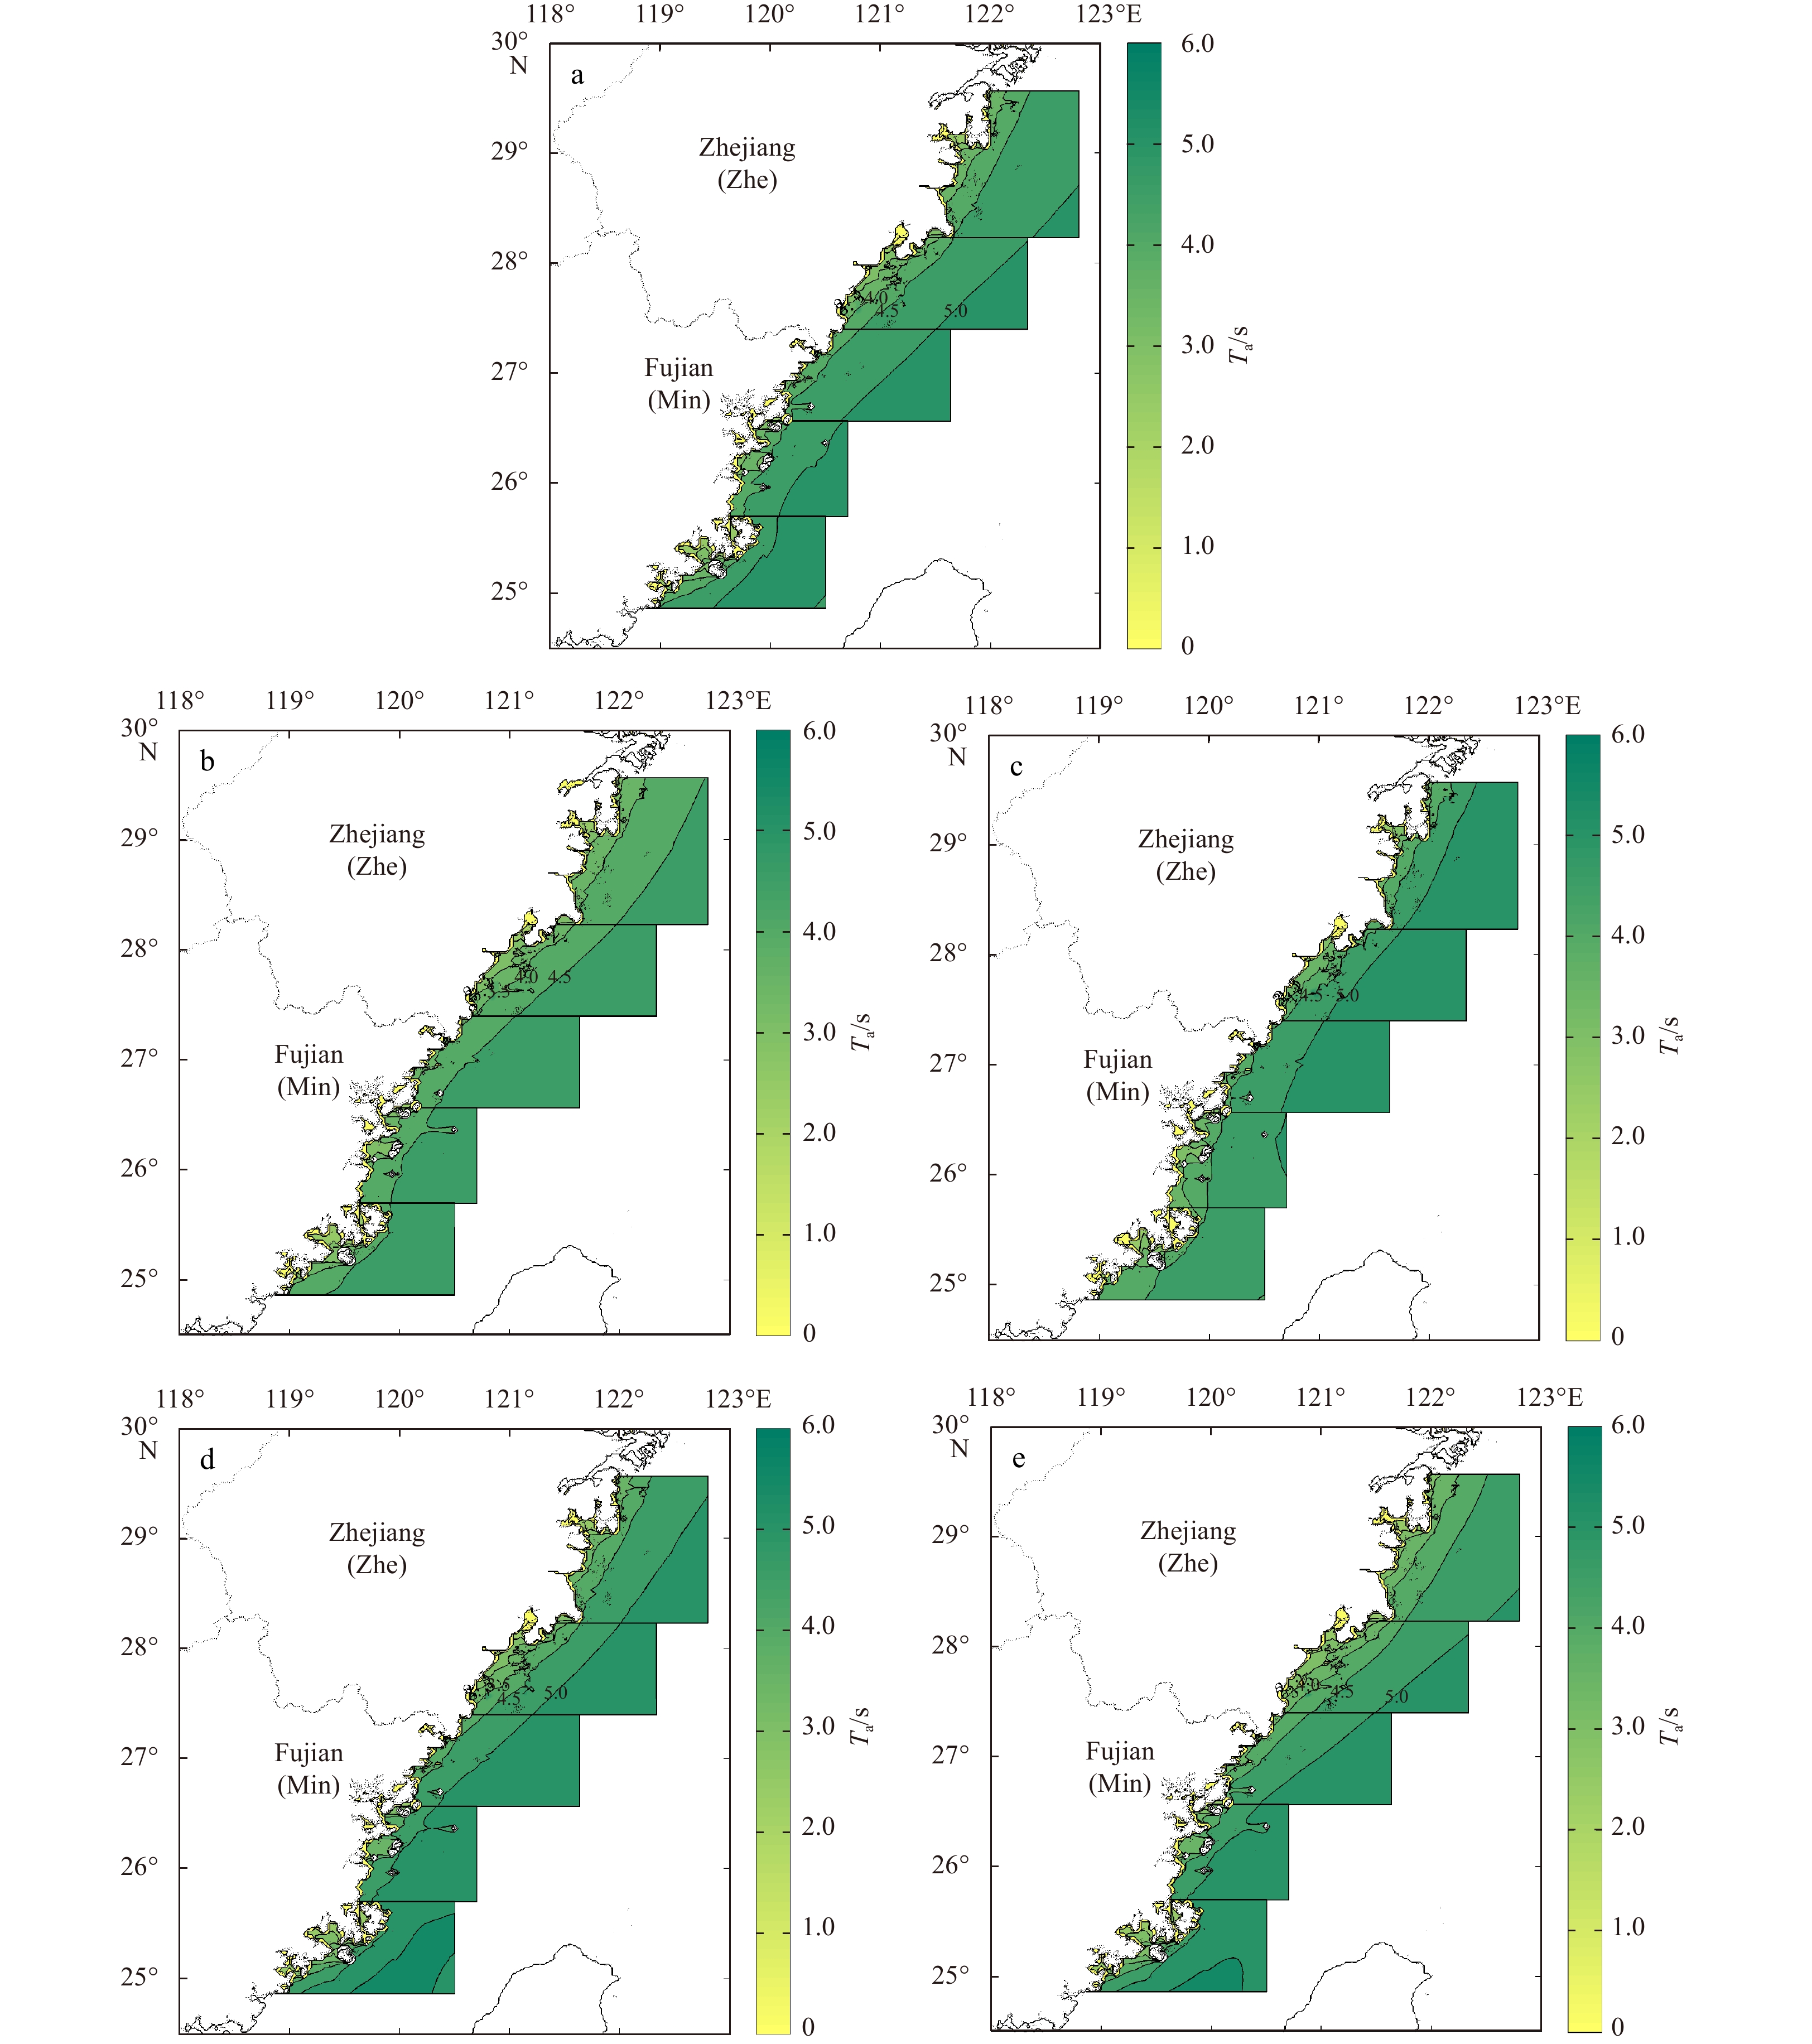
Figure 5. Spatial distributions of annual average period
${\overline{T}}_{\rm{a}}$ (a), and average periods in spring (b), summer (c), autumn (d), and winter (e).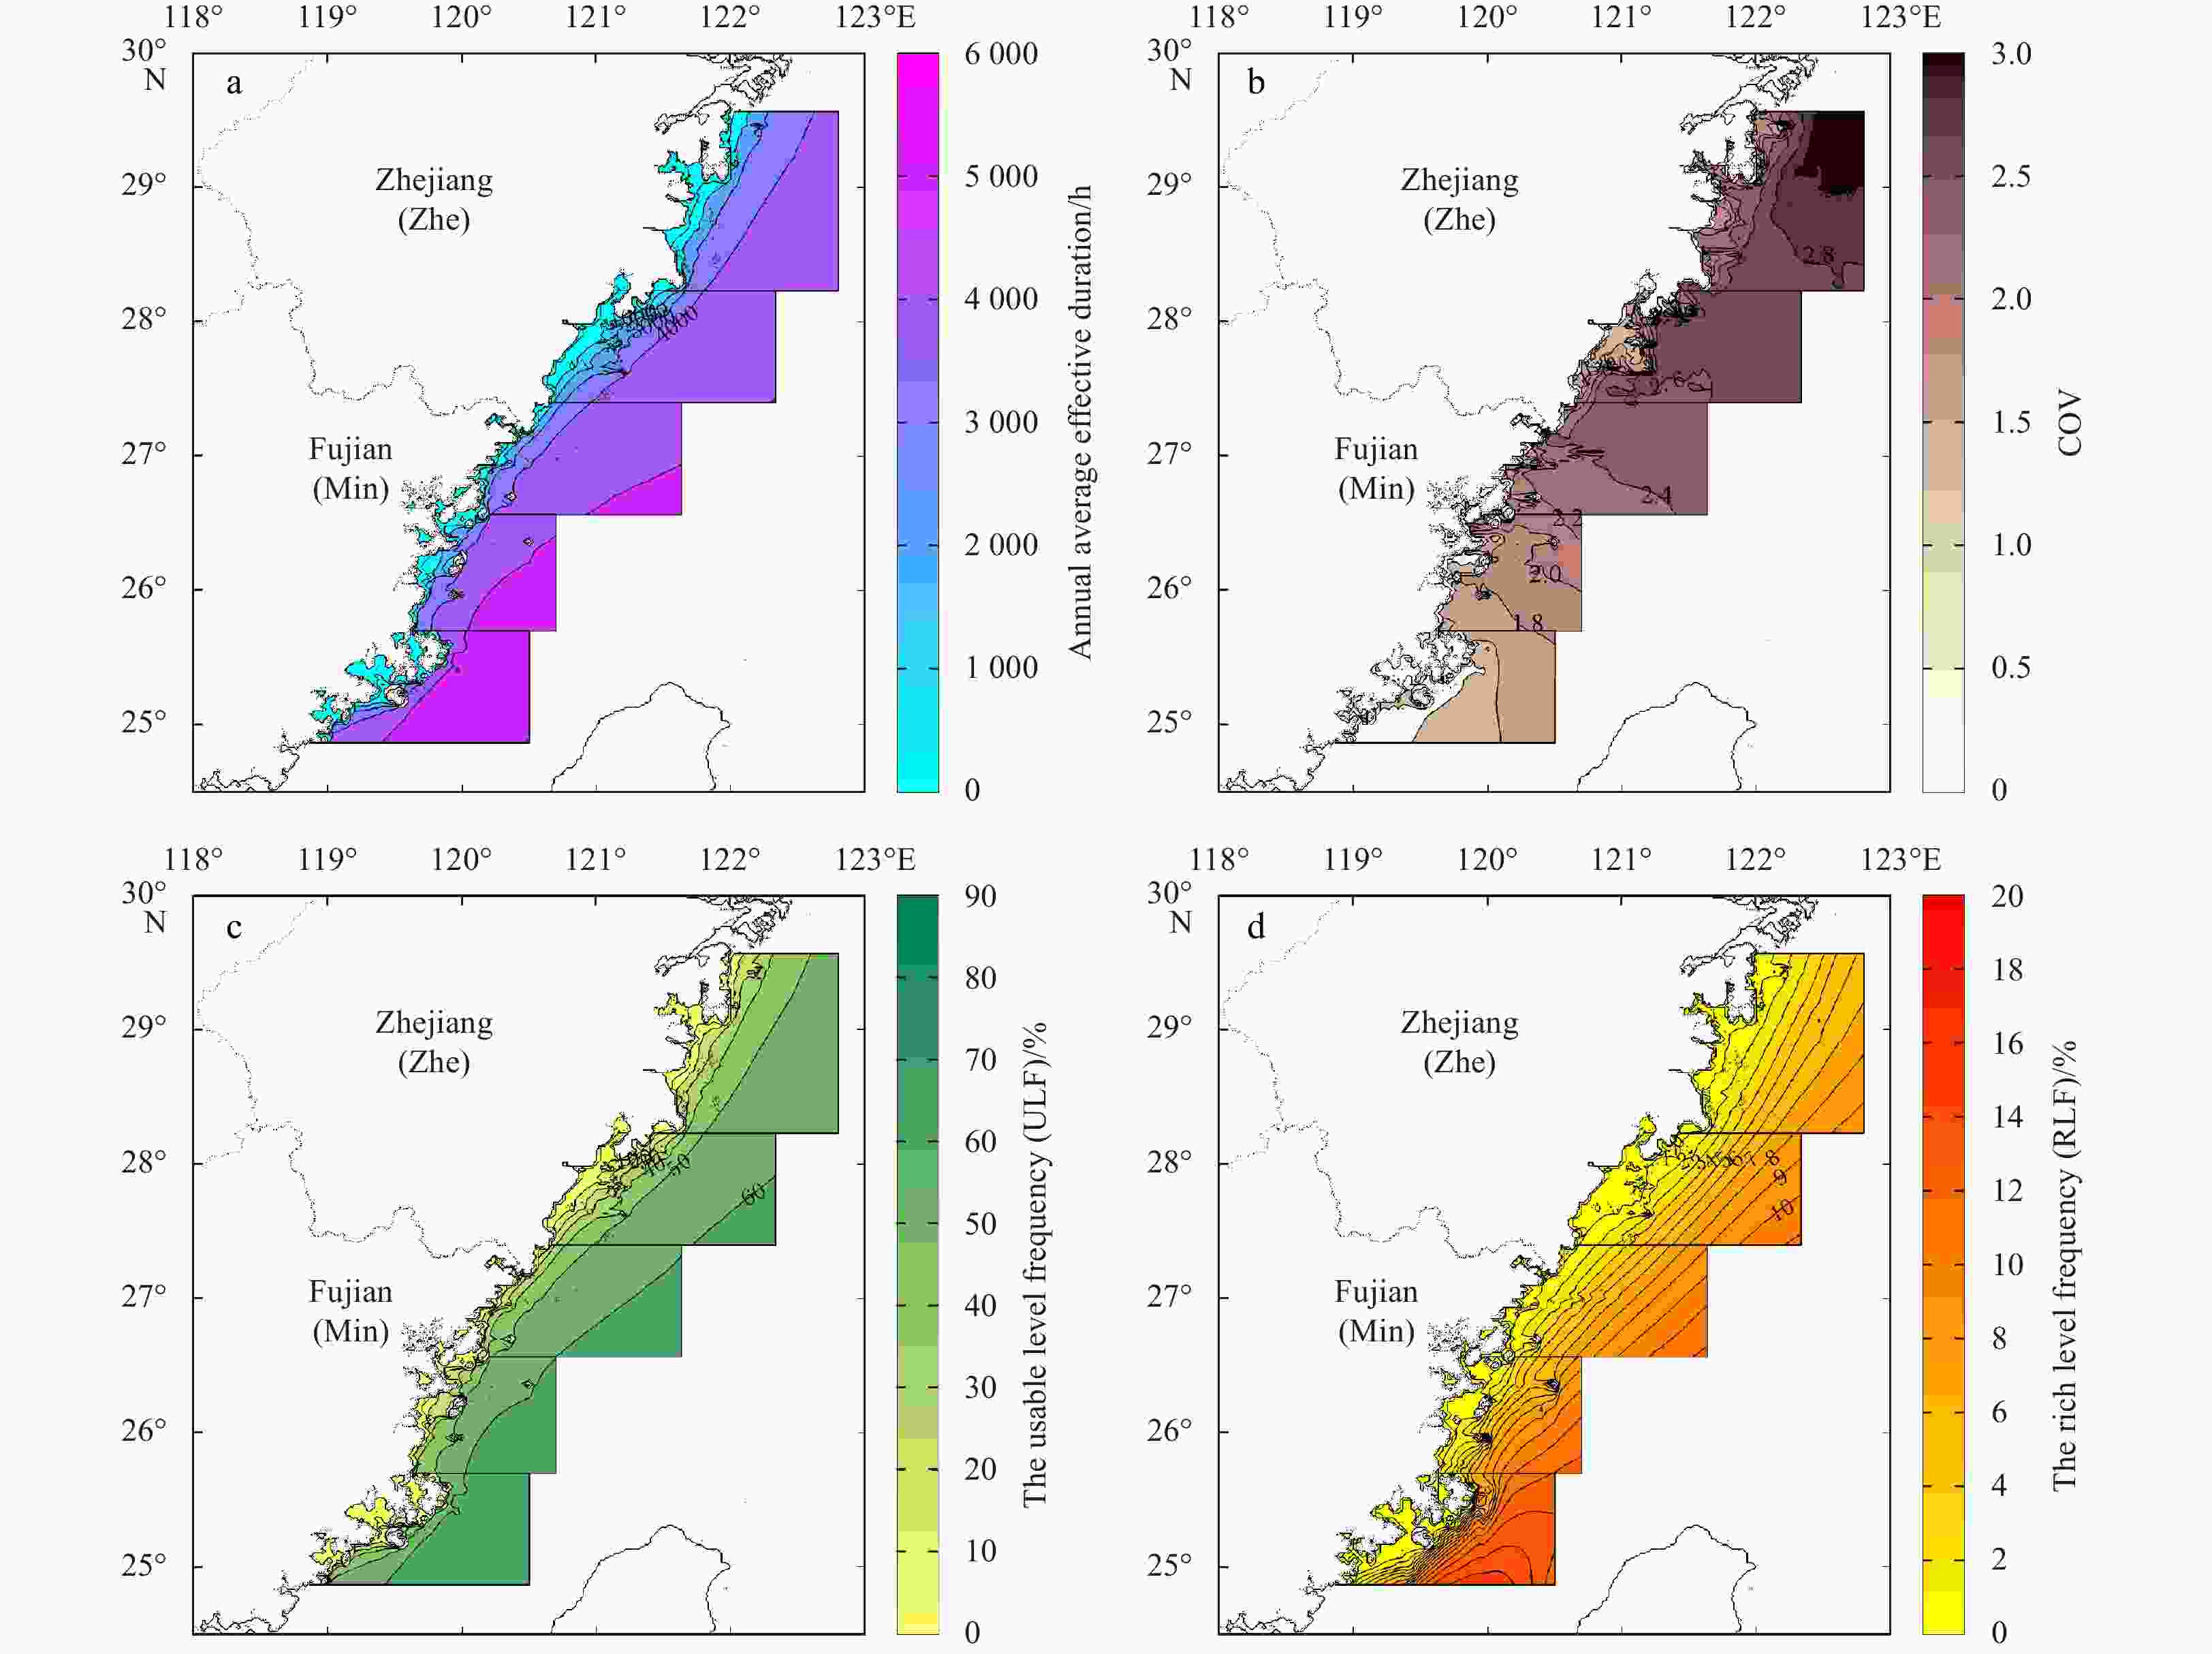
Figure 7. Effective duration (a), coefficient of variation (b), usable level frequency (c), and rich level frequency (d) of wave energy.
Table 1. Statistical results of annual average wave power density in each area
Key area Spatial mean value$/({\rm{kW}} \cdot {{\rm{m}}^{ - 1} })$ Maximum$/({\rm{kW}} \cdot {{\rm{m}}^{ - 1} })$ $ {P_{\text{W}}} $≥2 ${\rm{kW}}/{\rm{m}}$ ratio/% $ {P_{\text{W}}} $≥4 ${\rm{kW} }/{\rm{m} }$ ratio/% $ {P_{\text{W}}} $≥6 ${\rm{kW} }/{\rm{m} }$ ratio/% D5 5.3 8.9 87.0 71.0 47.0 D6 5.7 10.2 83.7 70.3 54.0 D7 6.6 10.4 93.8 82.8 65.2 D8 6.2 9.5 89.4 78.8 61.5 D9 7.0 10.1 87.0 79.7 70.3  下载: 导出CSV
Table 2. Statistical results of annual average effective duration in each area
Key area Spatial mean
value/hMaximum/h ≥1 500 h
ratio/%≥3 000 h
ratio/%≥5 000 h
ratio/%D5 3 518.1 4 784.7 90.0 76.8 0.0 D6 3 705.2 5 009.3 87.1 75.9 0.2 D7 4 286.2 5 135.7 95.6 90.1 13.1 D8 4 324.8 5 277.7 95.2 87.0 34.9 D9 4 450.5 5 350.3 89.0 85.8 65.2
下载: 导出CSV
Table 3. Statistics of monthly averaged reserve of wave energy in each key area (104 kW)
Key area Jan. Feb. Mar. Apr. May Jun. Jul. Aug. Sept. Oct. Nov. Dec. D5 68 61 52 43 41 76 138 212 145 103 68 77 D6 58 54 44 37 34 62 118 139 109 85 59 63 D7 62 56 45 35 32 51 92 102 93 85 65 67 D8 85 72 56 38 32 40 62 75 89 107 91 90 D9 153 126 102 64 50 60 68 86 115 185 169 163
下载: 导出CSV
Table 4. Statistics of annual average reserve of wave energy in each key area
Key area Annual average reserve of wave
energy/(104 kW)Length of wave crest
line/kmAverage wave power density along wave
crest line/(kW∙m–1)D5 91 174.2 5.2 D6 72 131.0 5.5 D7 66 124.8 5.3 D8 70 117.1 6.0 D9 112 157.7 7.1 OE-W2 411 704.8 5.8
下载: 导出CSV
-
[1] Ahn S, Haas K A, Neary V S. 2020. Wave energy resource characterization and assessment for coastal waters of the United States. Applied Energy, 267: 114922 [2] Aboobacker V M, Shanas P R, Alsaafani M A, et al. 2017. Wave energy resource assessment for Red Sea. Renewable Energy, 114: 46–58 [3] Arinaga R A, Cheung K F. 2012. Atlas of global wave energy from 10 years of reanalysis and hindcast data. Renewable Energy, 39(1): 49–64 [4] Bingölbali B, Majidi A G, Akpınar A. 2021. Inter- and intra-annual wave energy resource assessment in the south-western Black Sea coast. Renewable Energy, 169: 809–819 [5] Cai Xiaojie, Dai Jianhua, Zhu Zhihui, et al. 2019. Quality control and forecast verification of wind field in coastal waters of Shanghai. Meteorological Science and Technology (in Chinese), 47(2): 214–221 [6] Chen Junwen, Cai Yang, Bai Yiping, et al. 2014. Simulation of one gale case in winter in the South China Sea. Marine Forecasts (in Chinese), 31(4): 32–40 [7] Goharnejad H, Nikaein E, Perrie W. 2021. Assessment of wave energy in the Persian Gulf: An evaluation of the impacts of climate change. Oceanologia, 63(1): 27–39 [8] Gonçalves M, Martinho P, Soares C G. 2018. A 33-year hindcast on wave energy assessment in the western French coast. Energy, 165: 790–801 [9] Gunn K, Stock-Williams C. 2012. Quantifying the global wave power resource. Renewable Energy, 44: 296–304 [10] Jacobson P, Hagerman G. 2011. Mapping and assessment of the United States ocean wave energy resource. Palo, Alto, CA: EPRI [11] Jiang Bo, Ding Jie, Wu He, et al. 2017. Wave energy resource assessment along Bohai Sea, Yellow Sea and East China Sea. Acta Energiae Solaris Sinica (in Chinese), 38(6): 1711–1716 [12] Kompor W, Ekkawatpanit C, Kositgittiwong D. 2018. Assessment of ocean wave energy resource potential in Thailand. Ocean & Coastal Management, 160: 64–74 [13] Li Luping, Tian Suzhen, Xu Laisheng, et al. 1984. Power resource estimation of ocean surface waves in the Bohai Sea and Huanghai Sea and an evalution of prospects for converting wave power. Journal of Oceanography of Huanghai & Bohai Seas (in Chinese), 2(2): 14–23 [14] Li Yongbo, Wu Kejian, Bi Fan, et al. 2013. Wave energy resources assessment in the Chengshan cape sea during the last 20 years by using SWAN wave model. Transactions of Oceanology and Limnology (in Chinese), (3): 1–9 [15] Lin Yifan, Dong Sheng, Wang Zhifeng, et al. 2019. Wave energy assessment in the China adjacent seas on the basis of a 20-year SWAN simulation with unstructured grids. Renewable Energy, 136: 275–295 [16] Luo Xuye, Xia Dengwen. 2017. Resource Characteristics and Evaluation Analysis of Ocean Energy in Offshore Key Areas of China (in Chinese). Beijing: China Ocean Press, 247 [17] Ma Huaishu, Yu Qingwu. 1983. The preliminary eastimate for the potential surface wave energy resources in the adjacent sea areas of China. Marine Science Bulletin, 2(3): 73–81 [18] Quitoras M R D, Abundo M L S, Danao L A M. 2018. A techno-economic assessment of wave energy resources in the Philippines. Renewable and Sustainable Energy Reviews, 88: 68–81 [19] Ribal A, Babanin A V, Zieger S, et al. 2020. A high-resolution wave energy resource assessment of Indonesia. Renewable Energy, 160: 1349–1363 [20] Rusu E, Onea F. 2019. A parallel evaluation of the wind and wave energy resources along the Latin American and European coastal environments. Renewable Energy, 143: 1594–1607 [21] Shi Hongyuan, You Zaijin, Luo Xuye, et al. 2017. Assessment of wave energy resources for China Sea area based on 35 years’ ERA-Interim reanalysis data. Transactions of Oceanology and Limnology (in Chinese), (6): 30–37 [22] Wan Yong, Zhang Jie, Meng Junmin, et al. 2015. Exploitable wave energy assessment based on ERA-Interim reanalysis data—A case study in the East China Sea and the South China Sea. Acta Oceanologica Sinica, 34(9): 143–155 [23] Wan Yong, Zheng Chongwei, Li Ligang, et al. 2020. Wave energy assessment related to wave energy convertors in the coastal waters of China. Energy, 202: 117741 [24] Wang Chuankun. 1984. Primary analysis of the coastal wave energy source off China. Donghai Marine Science (in Chinese), 2(2): 32–38 [25] Wang Zhifeng, Dong Sheng, Dong Xiangke, et al. 2016a. Assessment of wind energy and wave energy resources in Weifang sea area. International Journal of Hydrogen Energy, 41(35): 15805–15811 [26] Wang Lvqing, Feng Weibing, Tang Xiaoning. 2013. Wave energy features of China’s coastal provinces areas. Renewable Energy Resources, 31(11): 126–131 [27] Wang Weiyuan, He Qianqian, Li Ruiyuan. 2016b. Assessment of wave energy resources in Zhoushan Sea. Water Power (in Chinese), 42(1): 93–97 [28] Wang Chenghai, Hu Ju, Jin Shuanglong, et al. 2011. Application and test of lower level wind field simulation with Meso-scale model WRF in western region of Northwest China. Journal of Arid Meteorology (in Chinese), 29(2): 161–167 [29] Wang Chuankun, Lu Wei. 2009. Analysis Method and Reserve Evaluation of Ocean Energy Resources (in Chinese). Beijing: China Ocean Press, 113 [30] Ye Qin, Yang Zhongliang, Shi Weiyong, 2012. A preliminary study of the wave energy resources in the sea adjacent to Zhejiang. Journal of Marine Sciences (in Chinese), 30(4): 13–19 [31] Zhang Rong, Jiang Bo, Zhang Song, et al. 2014. Application of wave energy development and utilization selection method in key exploration area of OE-W01. Ocean Development and Management (in Chinese), (9): 33–39 [32] Zhang Jun, Xu Jindian, Guo Xiaogang. 2012. An evaluation and analysis of the ocean wave energy resource in nearshore waters of Fujian. Journal of Oceanography in Taiwan Strait (in Chinese), 31(1): 130–135 [33] Zheng Chongwei, Li Xunqiang. 2011. Wave energy resources assessment in the China Sea during the last 22 years by using WAVEWATCH-Ⅲ wave model. Periodical of Ocean University of China (in Chinese), 41(11): 5–12 [34] Zheng Chongwei, Zheng Yuyan, Chen Hongchun. 2011. Research on wave energy resources in the northern South China Sea during recent 10 years using SWAN wave model. Journal of Subtropical Resources and Environment (in Chinese), 6(2): 54–59 -


 点击查看大图
计量
- 文章访问数: 260
- HTML全文浏览量: 74
- PDF下载量: 22
- 被引次数: 0

