

Short-term variations and influencing factors of suspended sediment concentrations at the Heisha Beach, Guangdong, China
-
Abstract: Knowledge of sediment variation processes is essential to understand the evolution mechanism of beach morphology changes. Thus, a field measurement was conducted at the Heisha Beach, located on the west coast of the Zhujiang River (Pearl River) Estuary, to investigate the short-term variation in suspended sediment concentrations (SSCs) and the relationship between the SSC and turbulent kinetic energy, bottom shear stress (BSS), and relative wave height. Based on extreme event analysis results, extreme events have a greater influence on turbulent kinetic energy than SSC. Although a portion of the turbulent kinetic energy dissipates directly into the water column, it plays an important role in suspended sediment motion. Most of the time, the wave-current interaction is strong enough to drive sediment incipience and resuspension. When combined, the wave-current interaction and wave-induced BSSs have a greater influence on suspended sediment transport and SSC variation than current-induced BSS alone. The relative wave height also has a strong correlation with SSC, indicating that the combined effect of water depth and wave height significantly impacts SSC variation. Water depth is mainly controlled by the tide on the beaches; thus, the effects of tides and waves should be conjunctively considered when analyzing the factors influencing SSC.
-
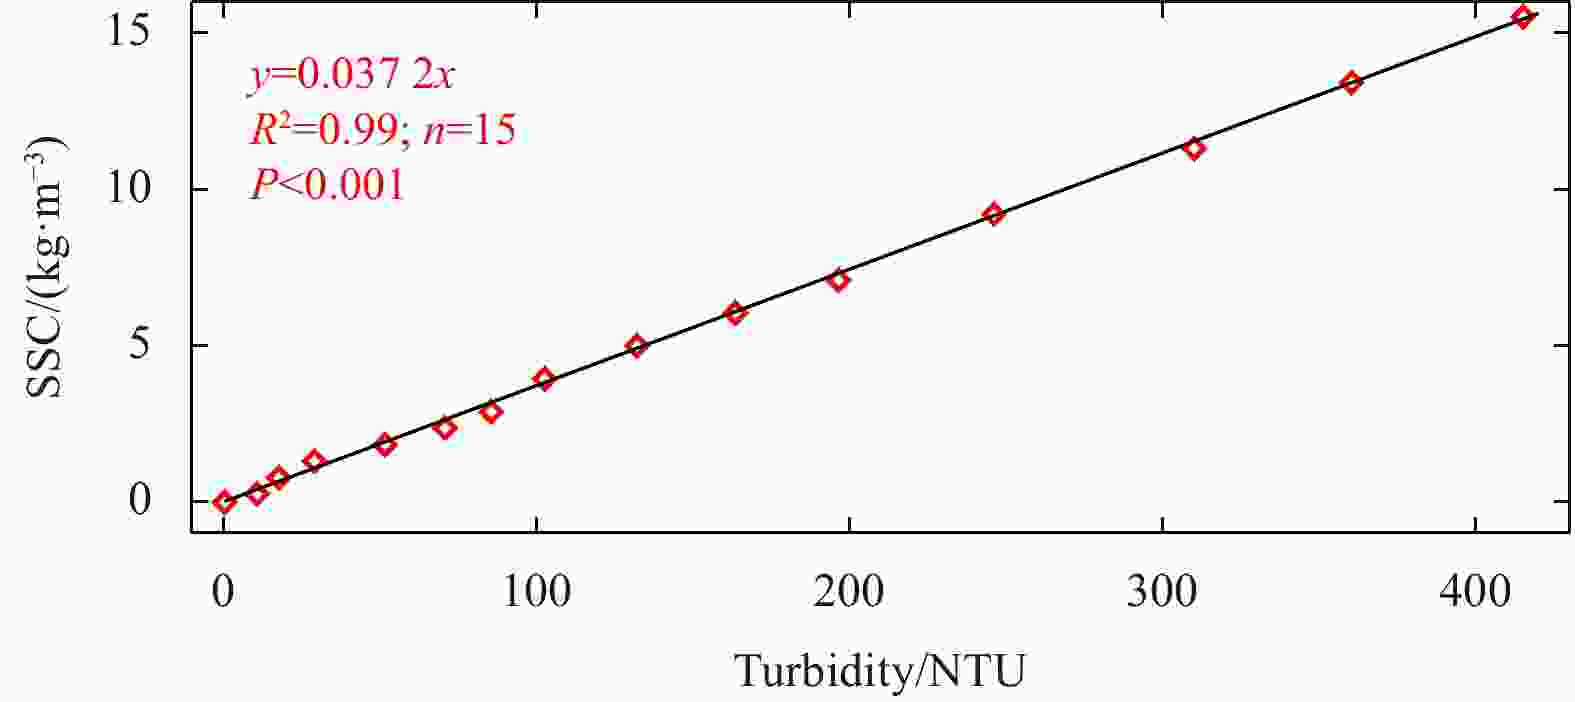
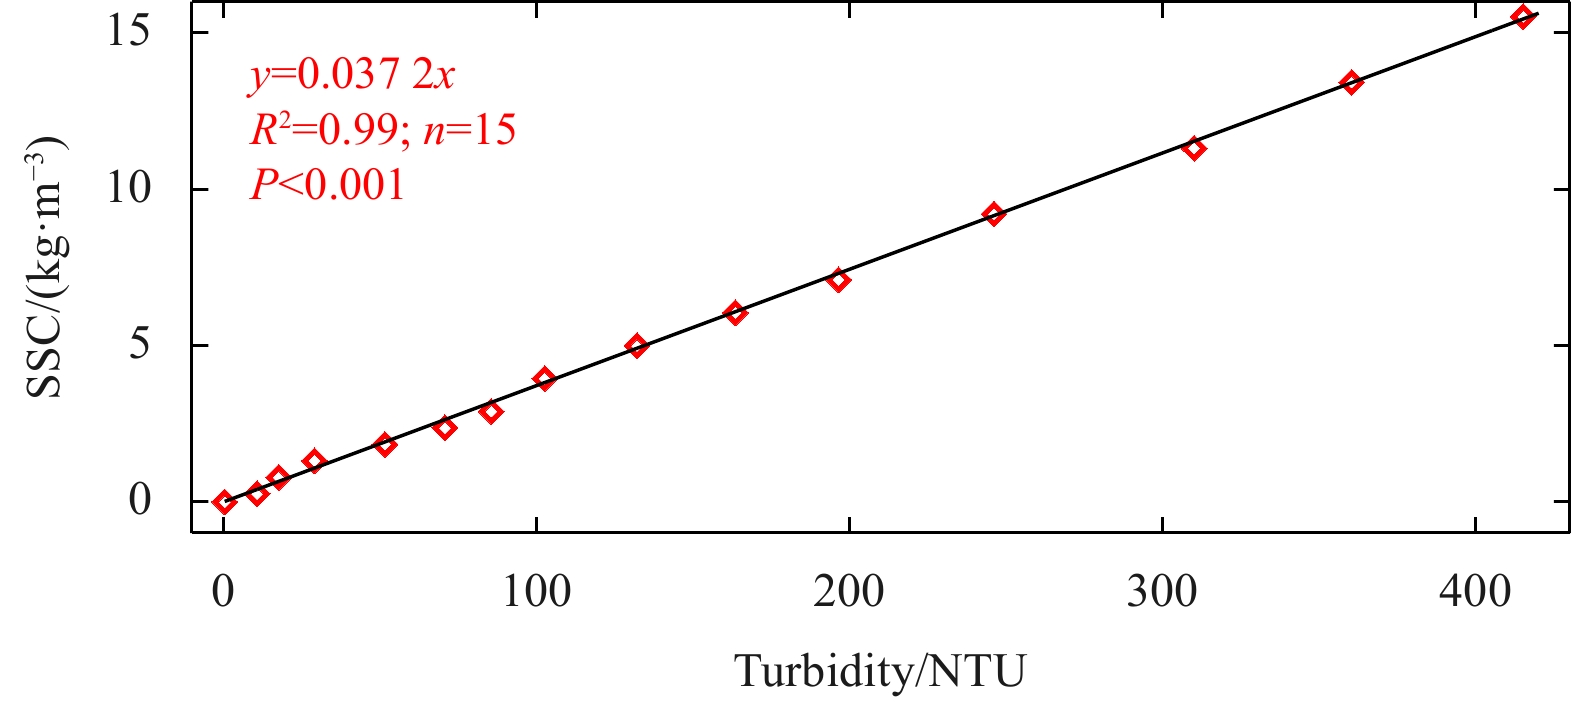
Figure 2. Linear least-squares line of best fit between turbidity and SSC of the water samples.

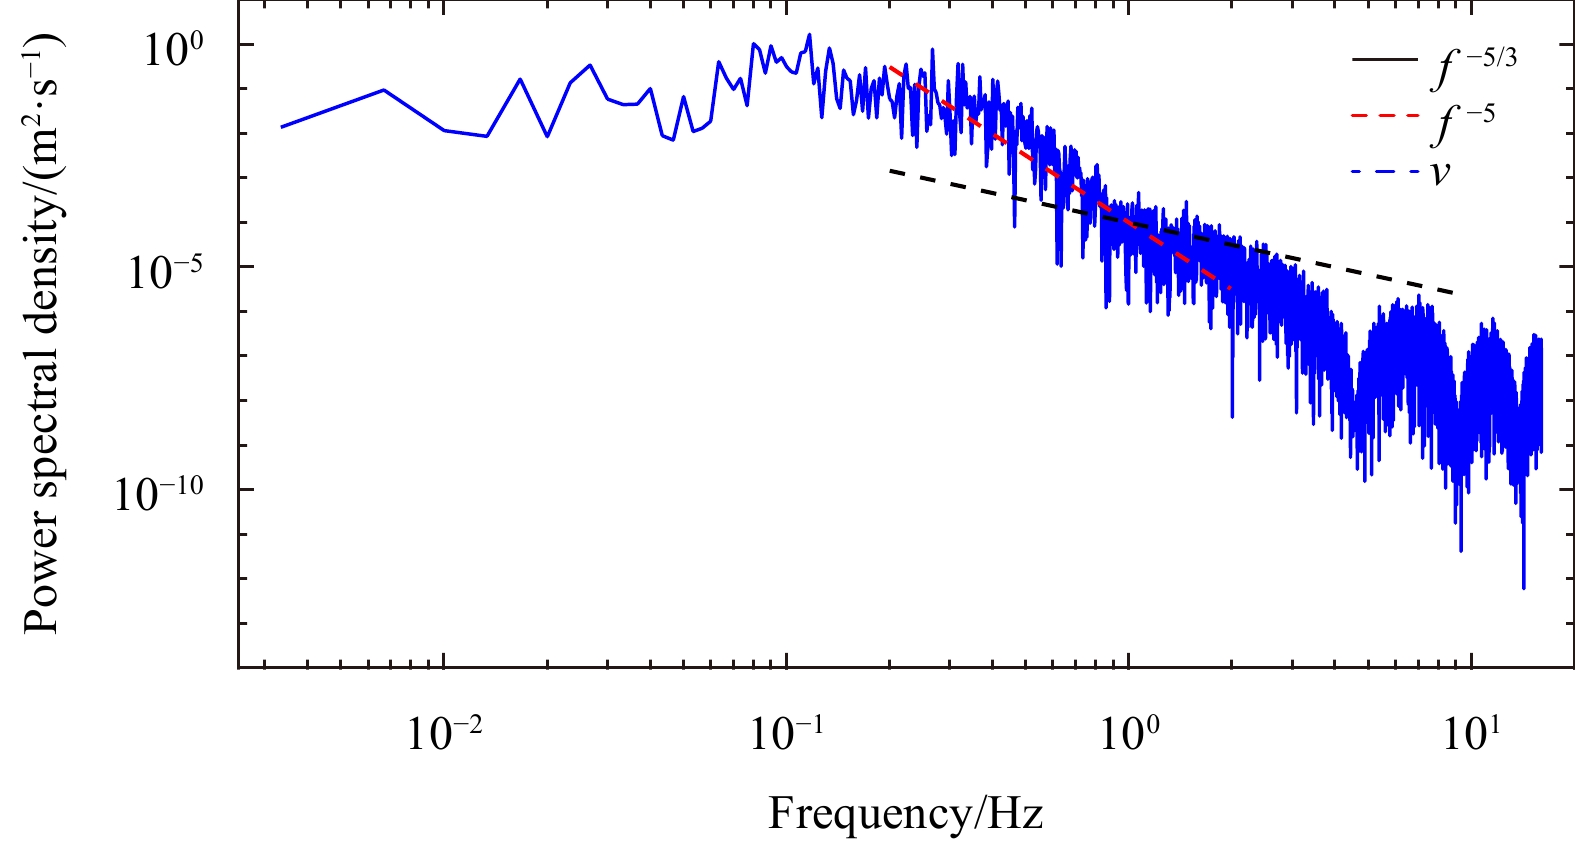
Figure 3. Power spectral density of cross-shore velocity (v) vs. frequency (blue line) for Burst 19. The red and black dashed lines indicate different spectral slopes.

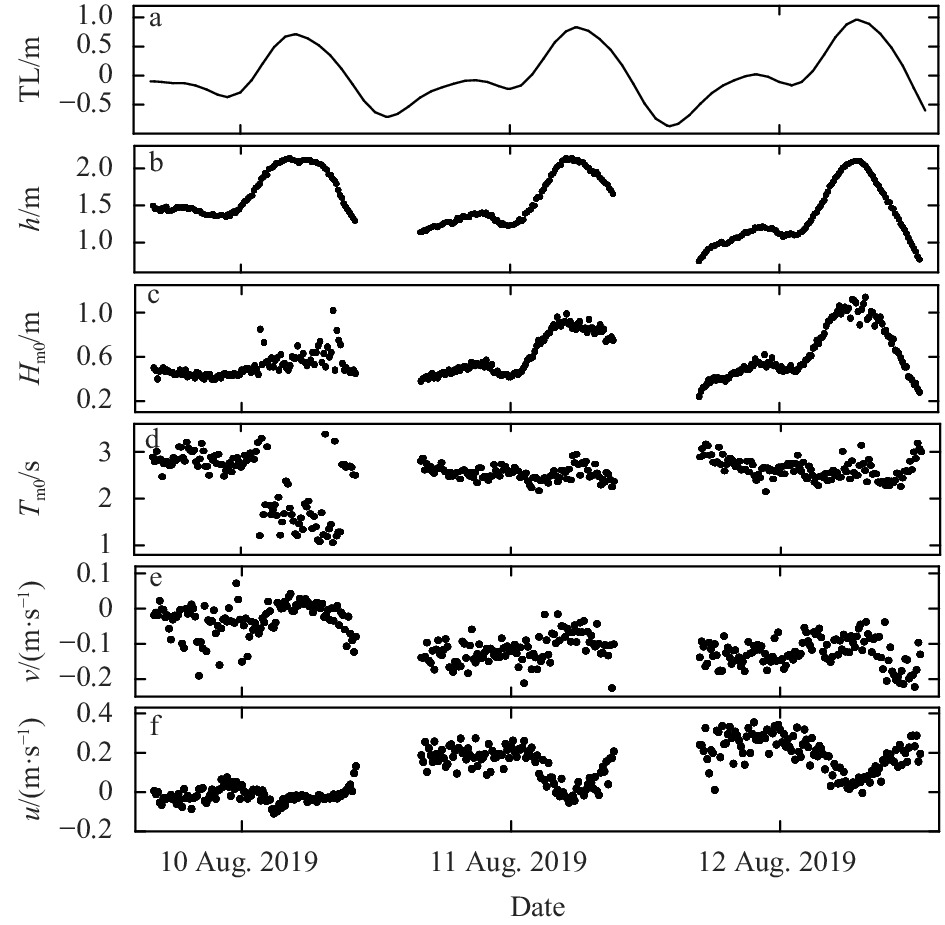
Figure 6. Hydrodynamic conditions during the observation period of tide level (TL) (a), water depth (h) (b), mean wave height (Hm0) (c), mean wave period (Tm0) (d), mean cross-shore current velocity (v) (e), and mean alongshore current velocity (u) (f).
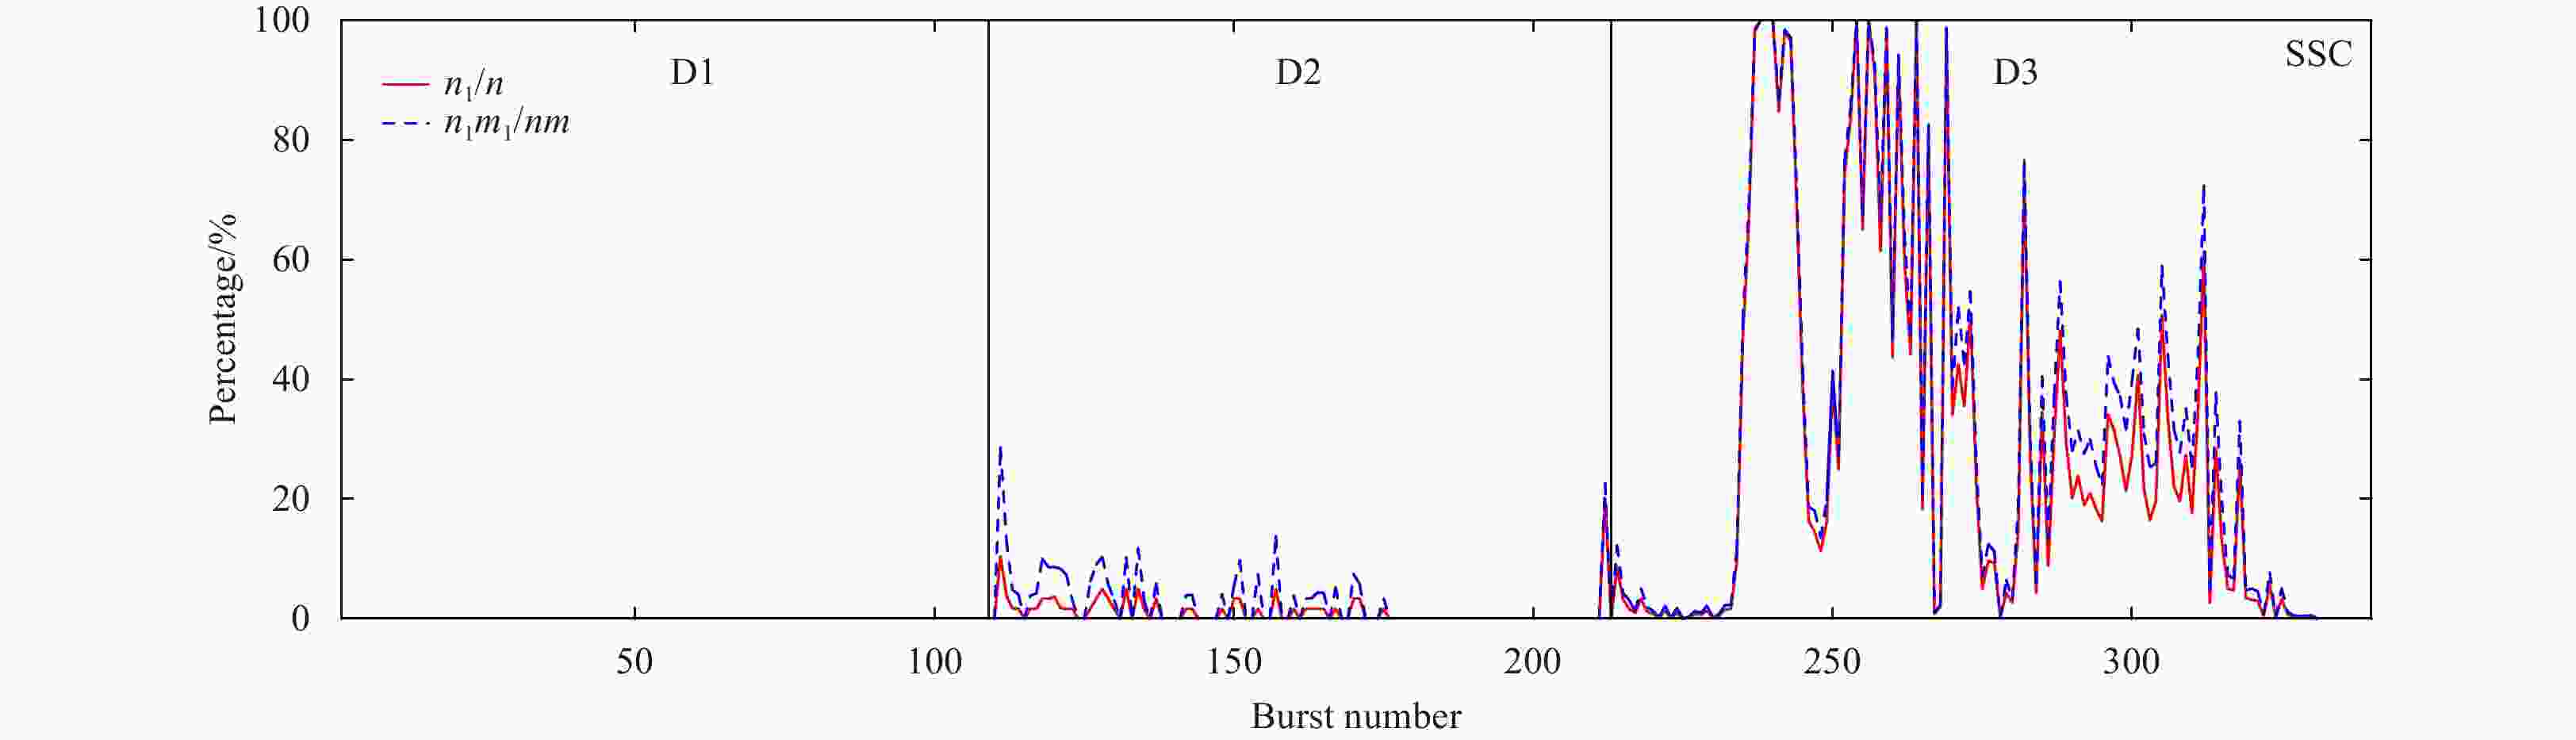
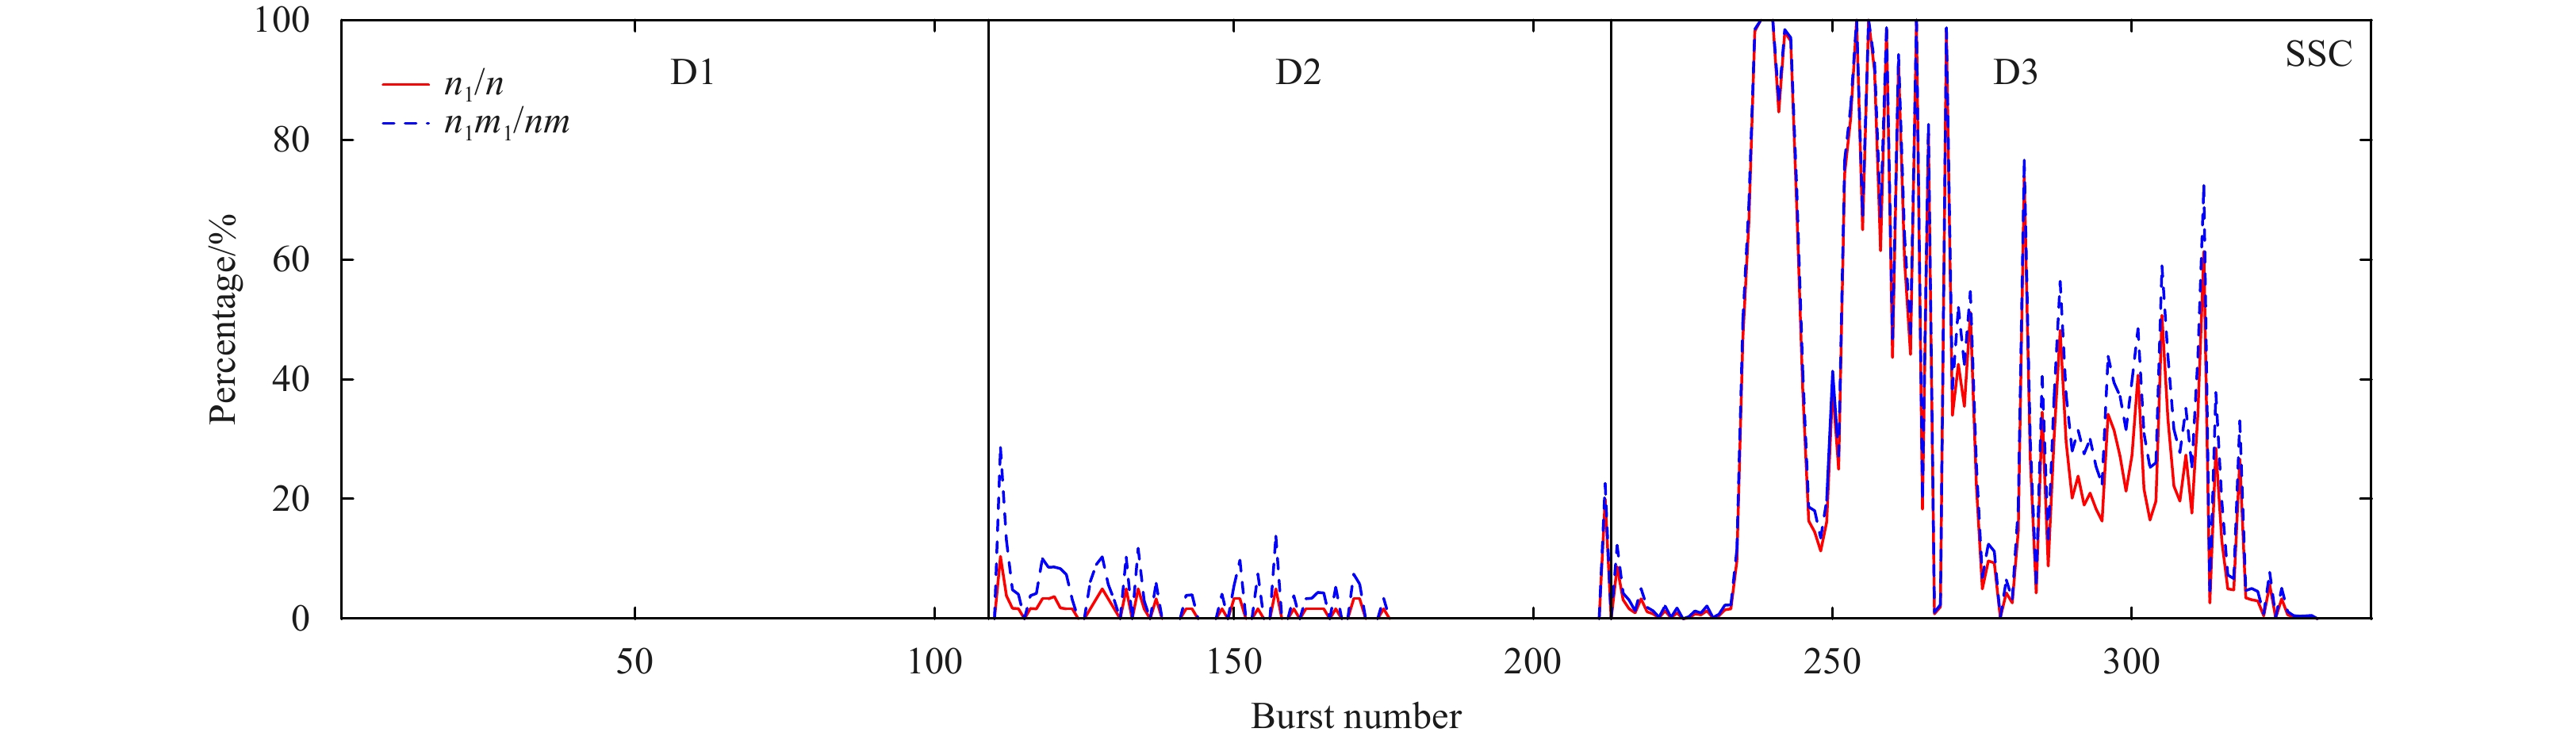
Figure 8. Fractions of extreme SSC events to the total data points (n1/n) and the SSC percentage contained in the extreme events in the entire time series (n1m1/nm).

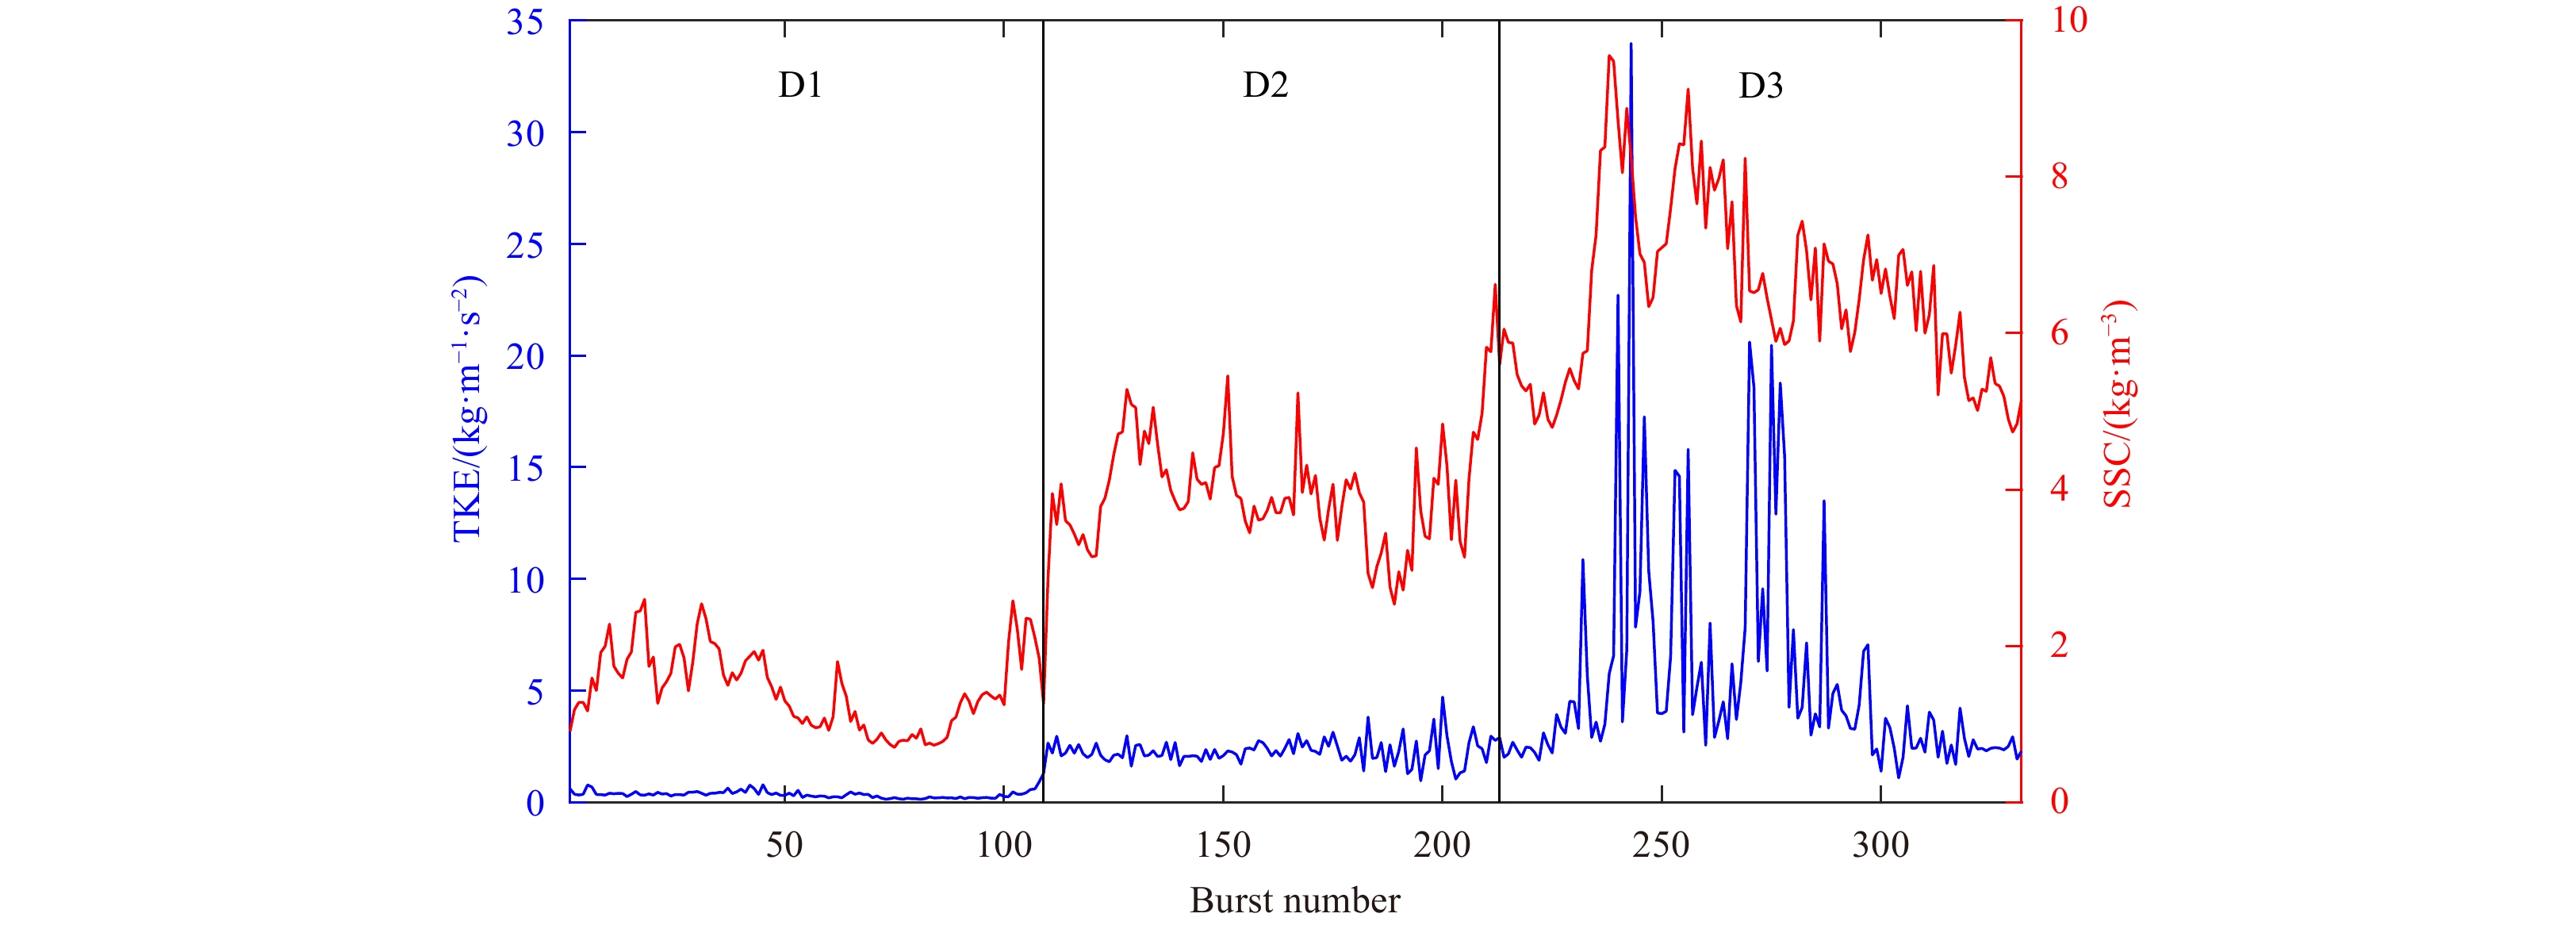
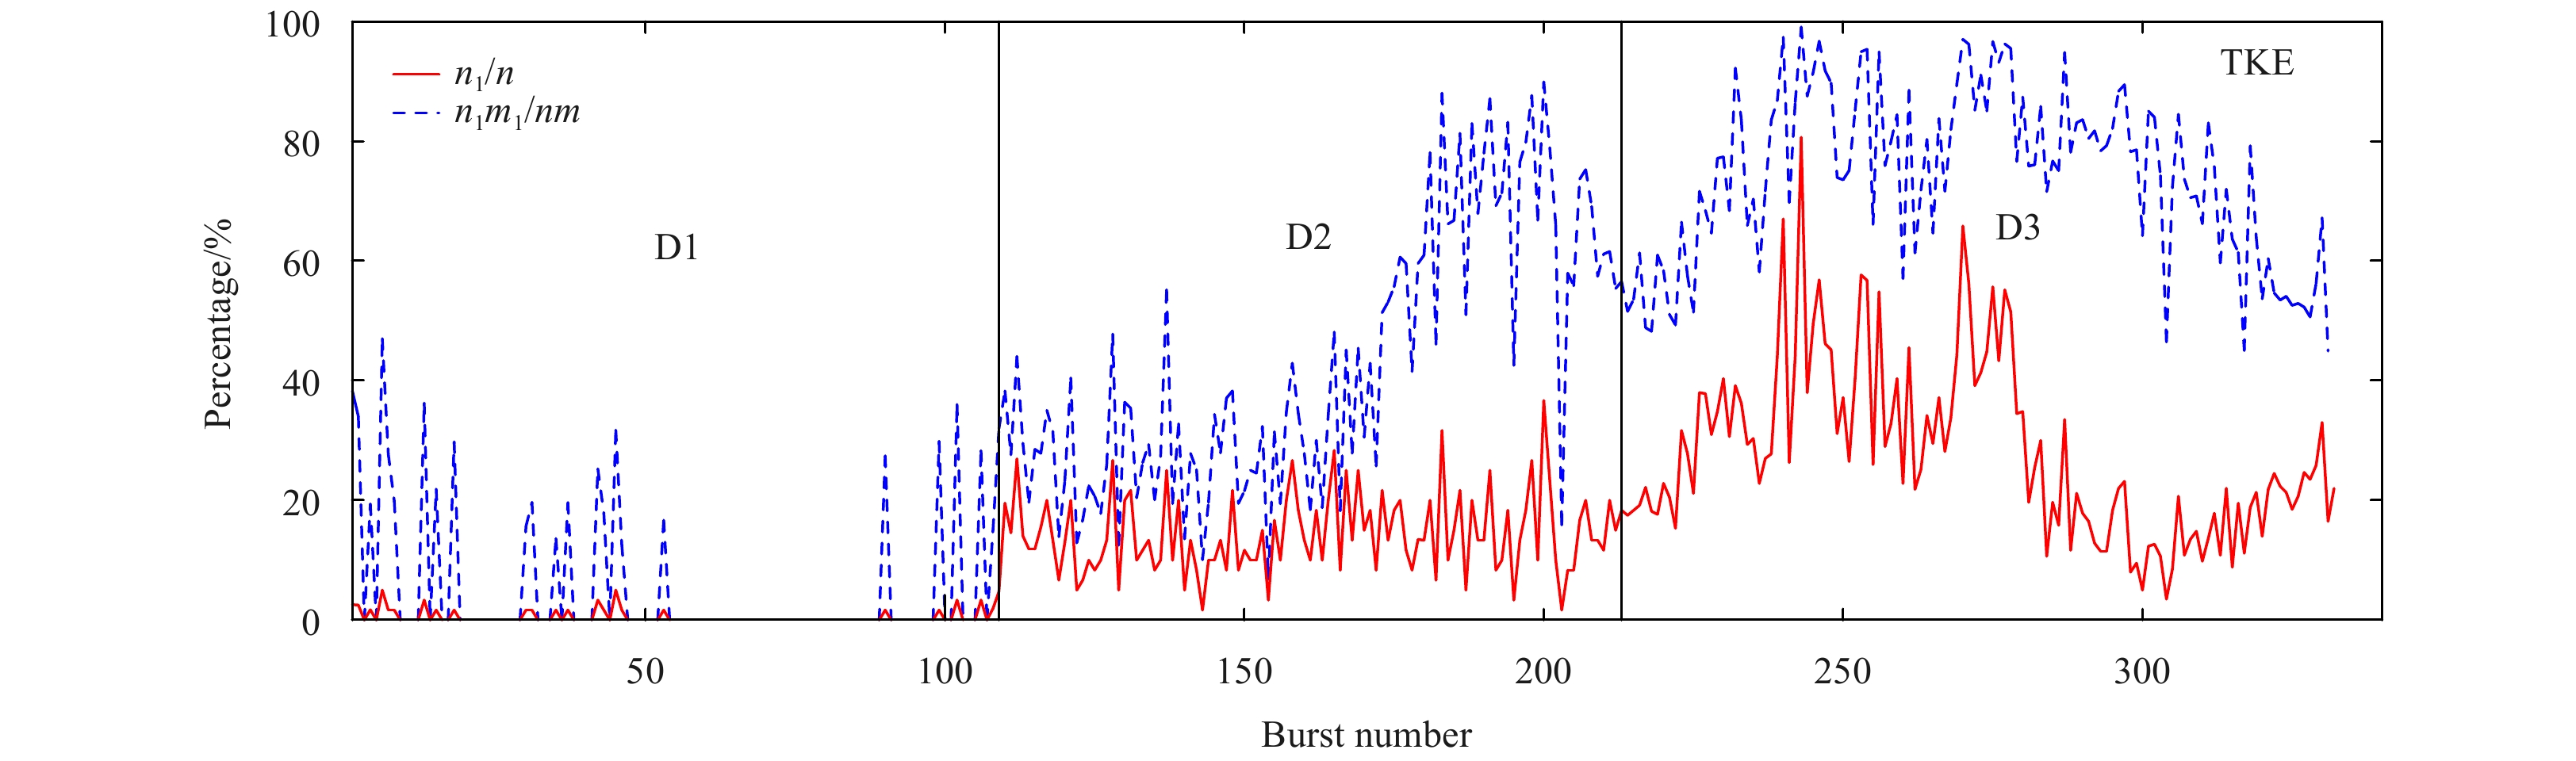
Figure 10. Fractions of extreme TKE events to the total data points (n1/n) and the TKE percentage contained in the extreme events in the entire data set (n1m1/nm).
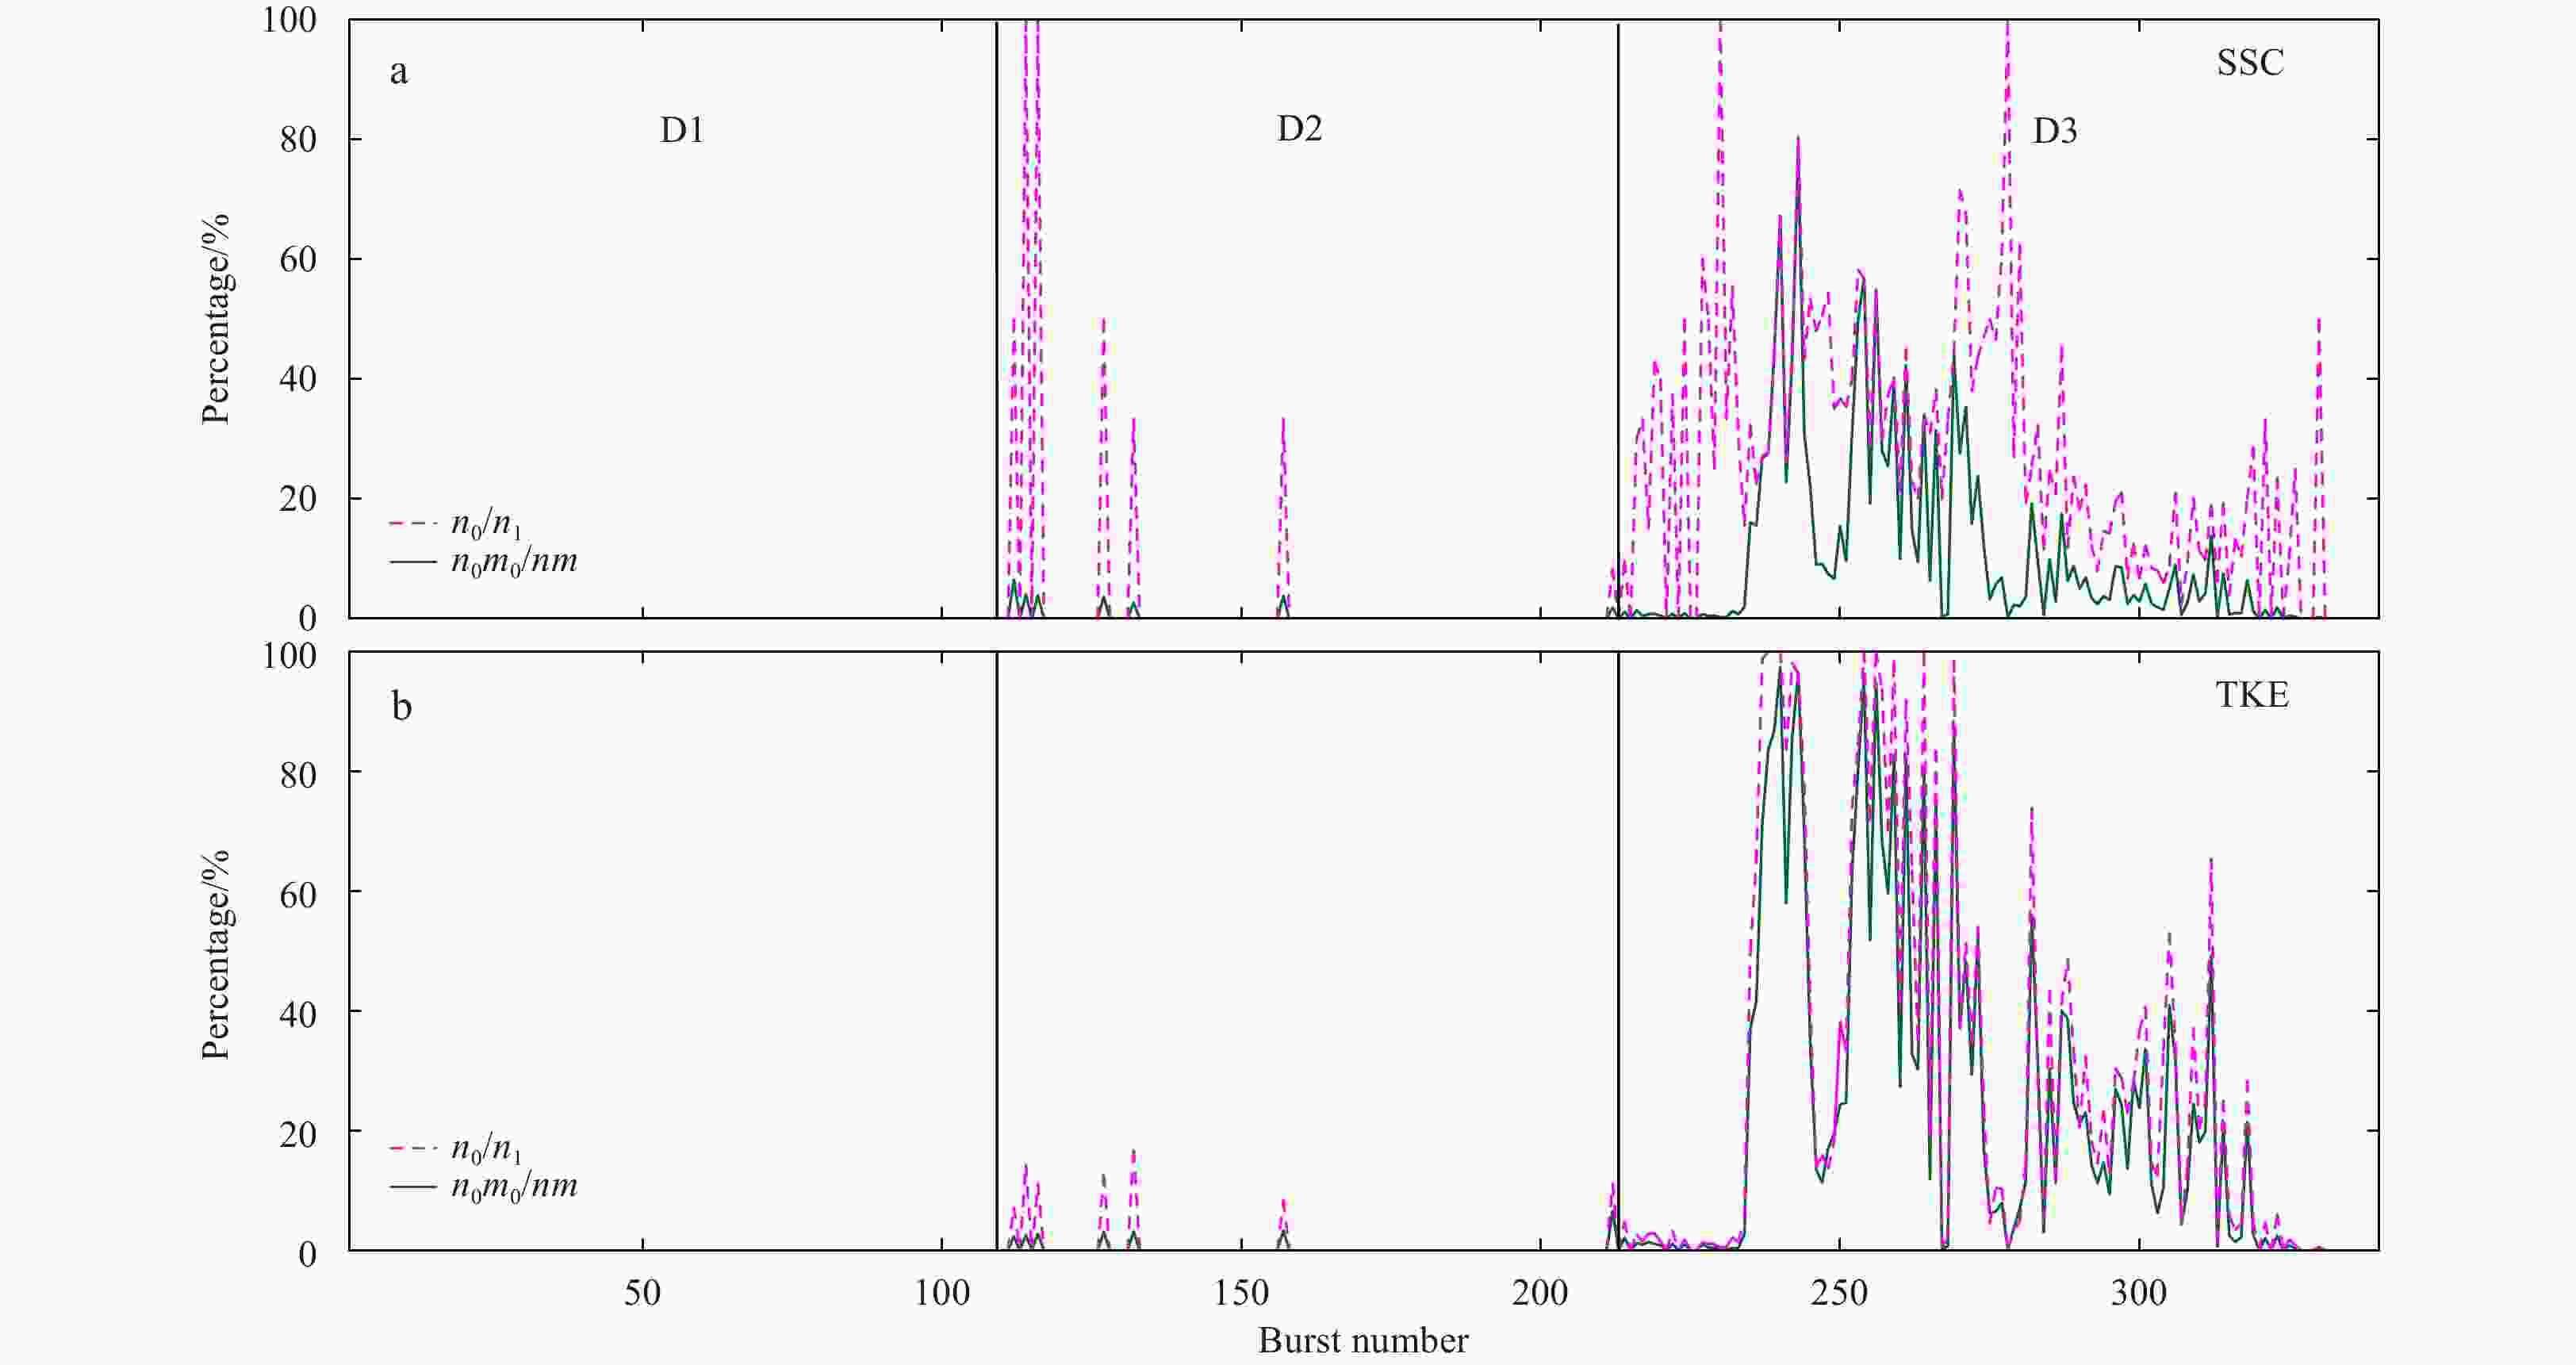
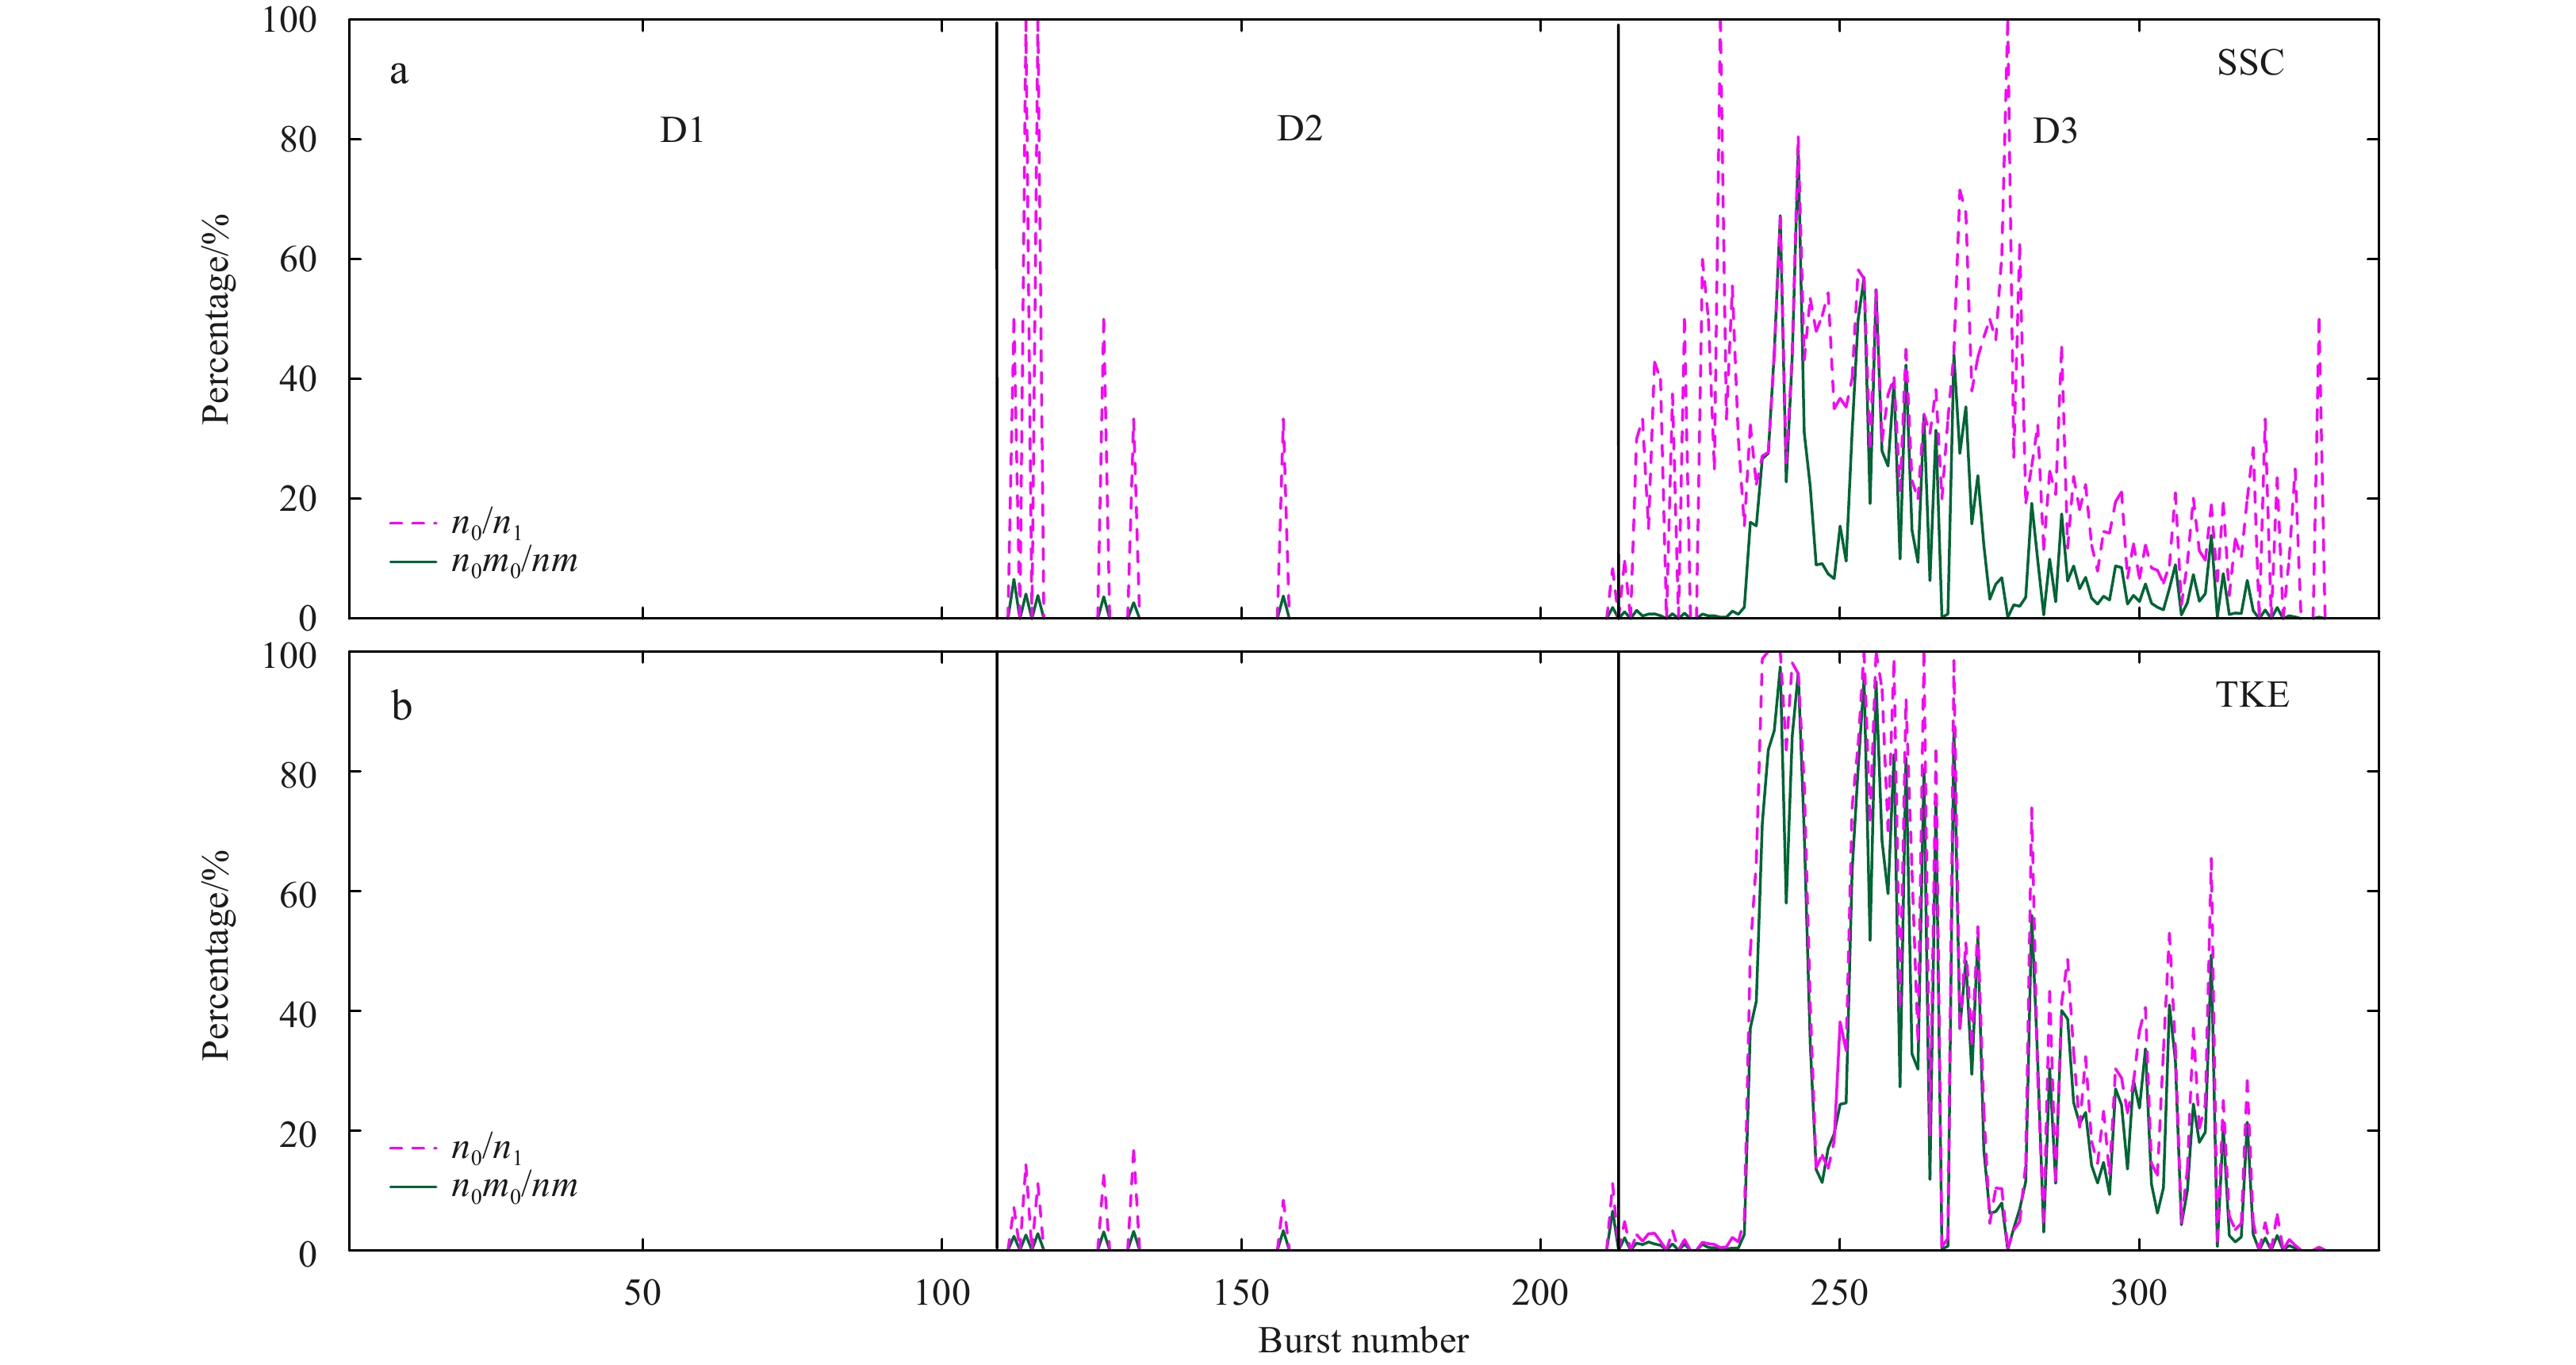
Figure 11. The fractions of correlated extreme events to the SSC (a) / TKE (b) extreme events (n0/n1) and the percent of the SSC (a) / TKE (b) contained in the correlated extreme events in relation to that in the entire time series (n0m0/nm).
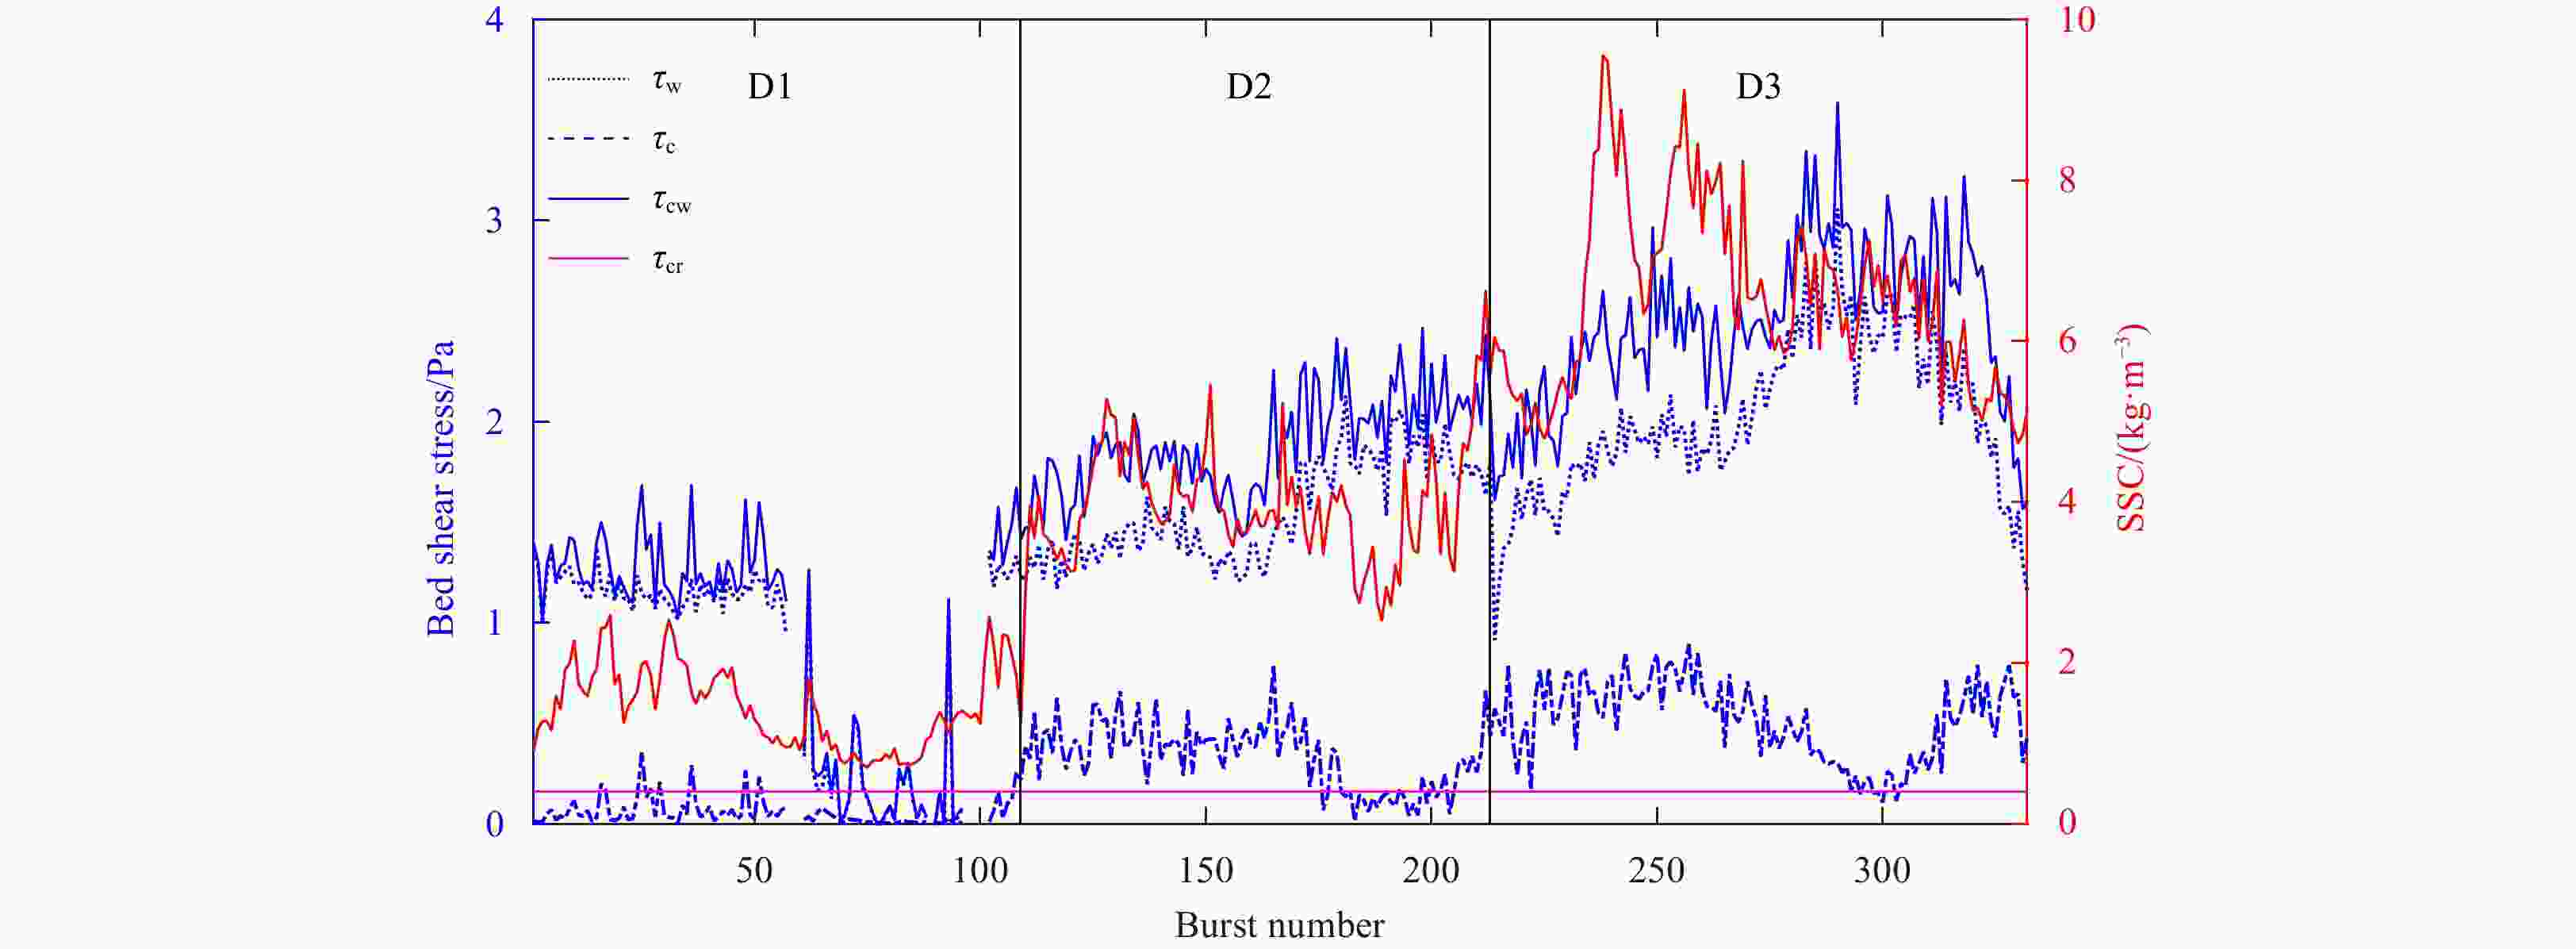
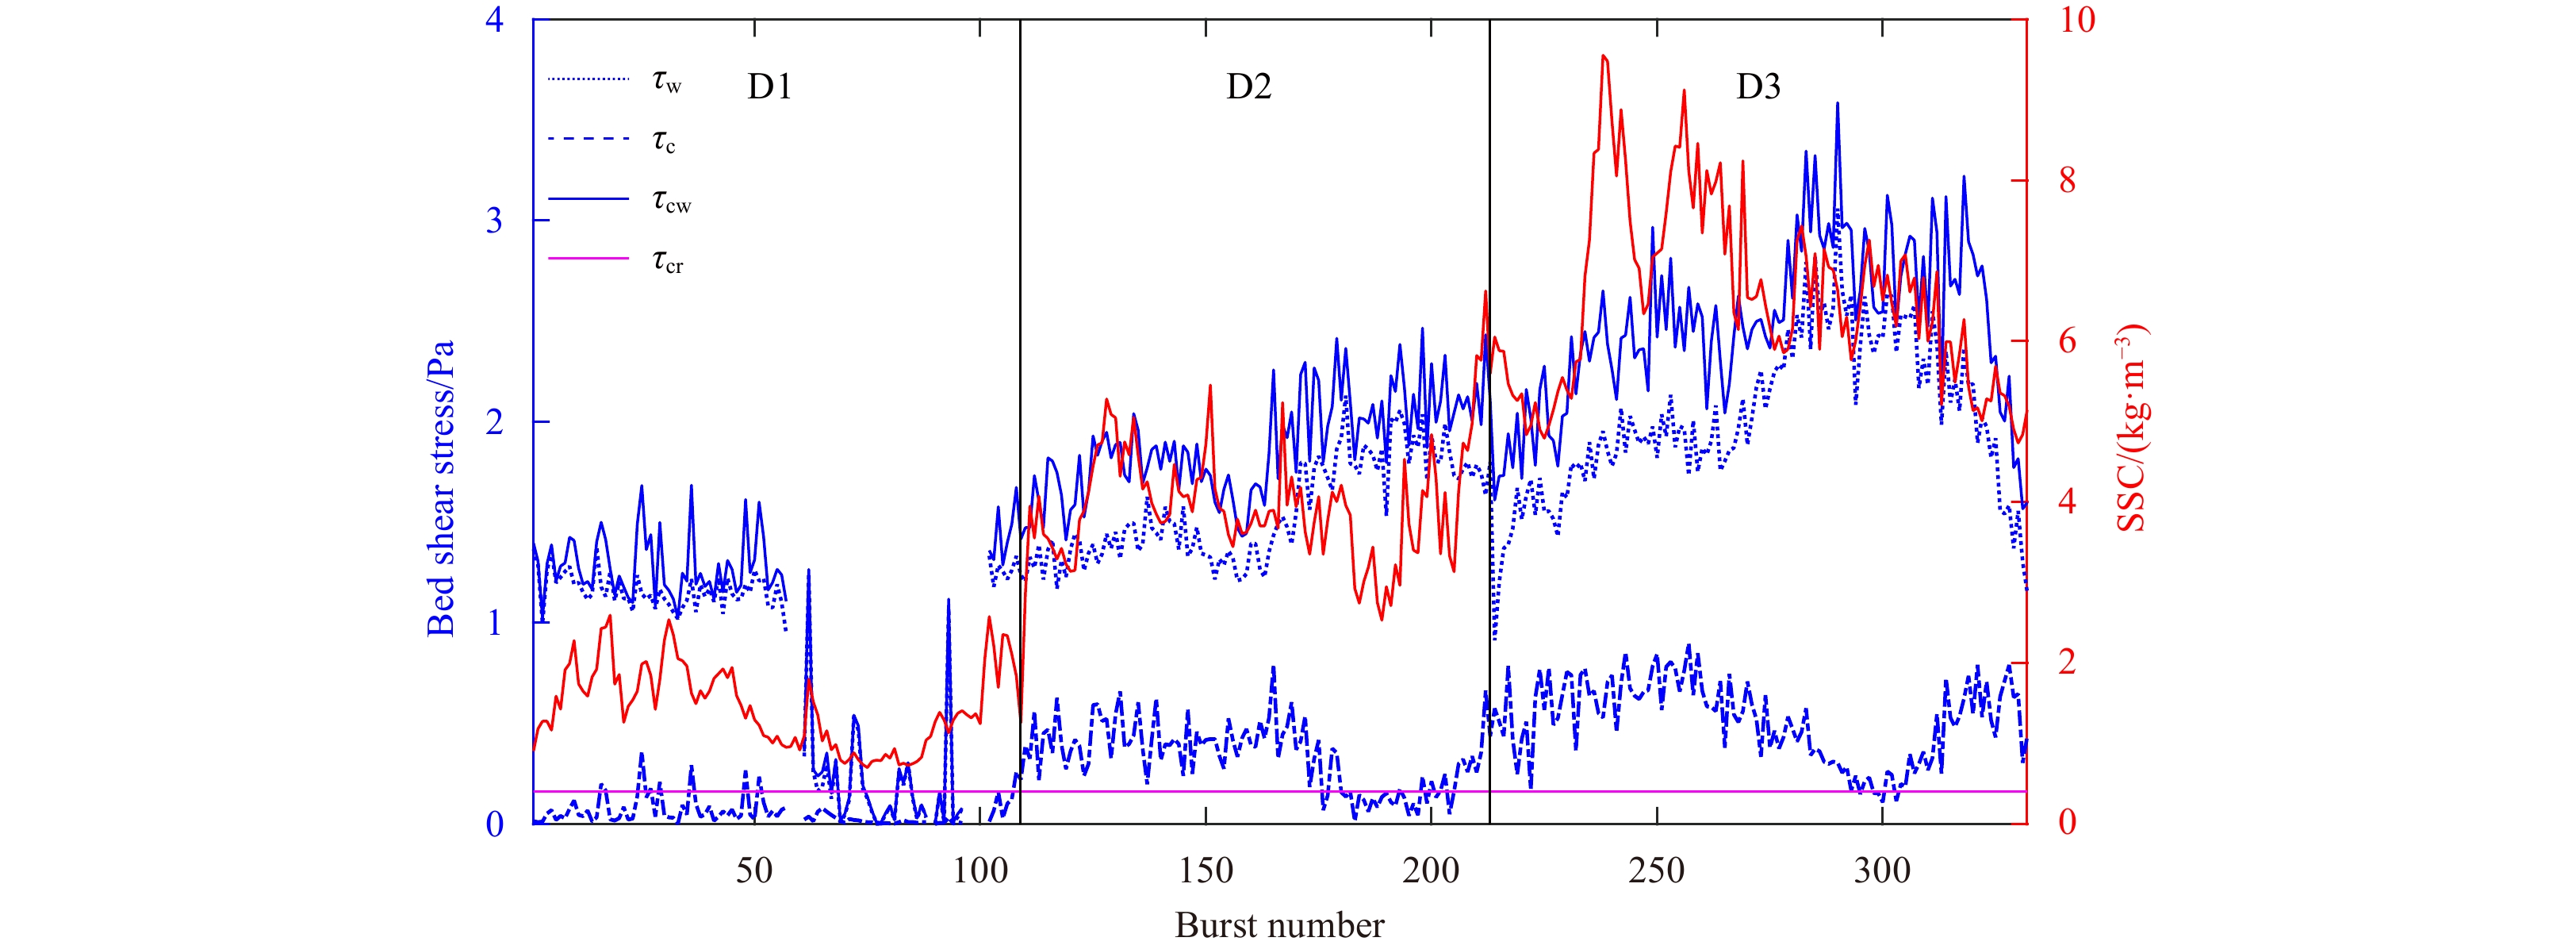
Figure 12. Wave-induced BSS (τw), current-induced BSS (τc), combined wave-current BSS (τcw), and mean SSC value of each burst. The horizontal magenta line indicates the critical BSS (τcr=0.16 Pa).
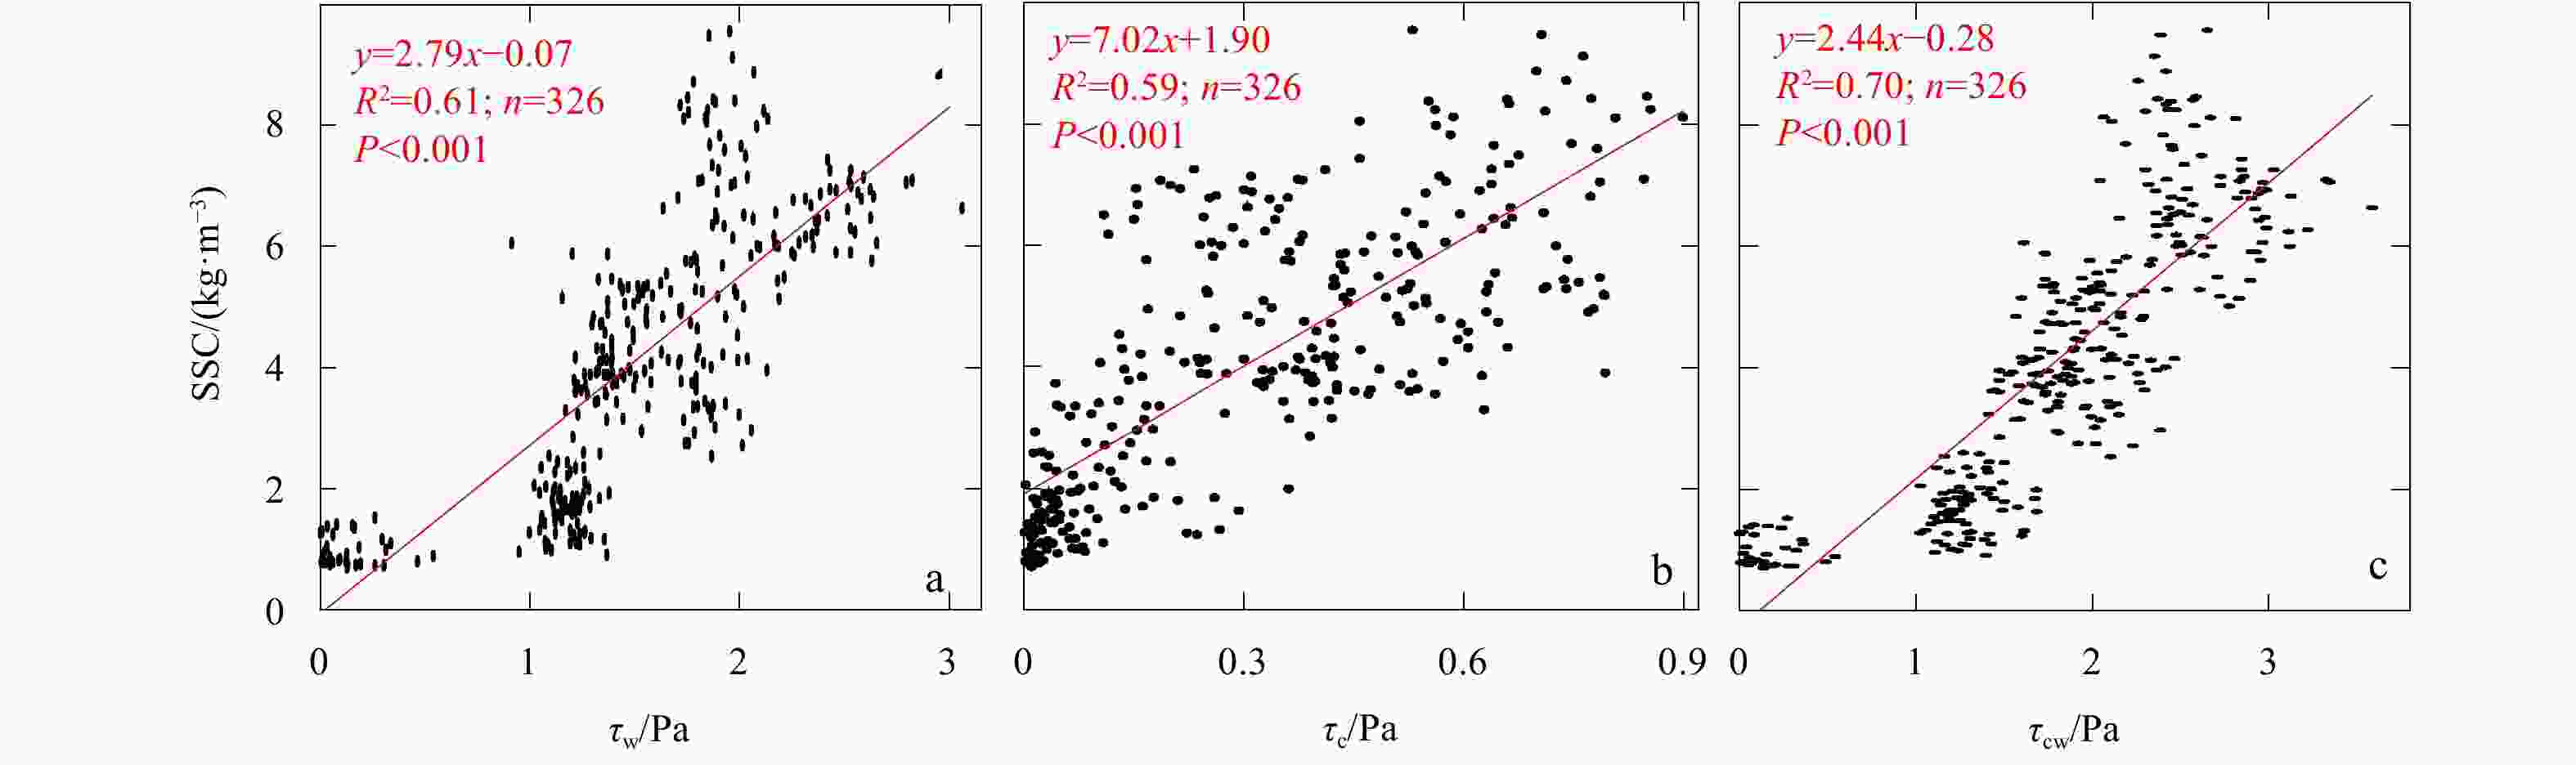
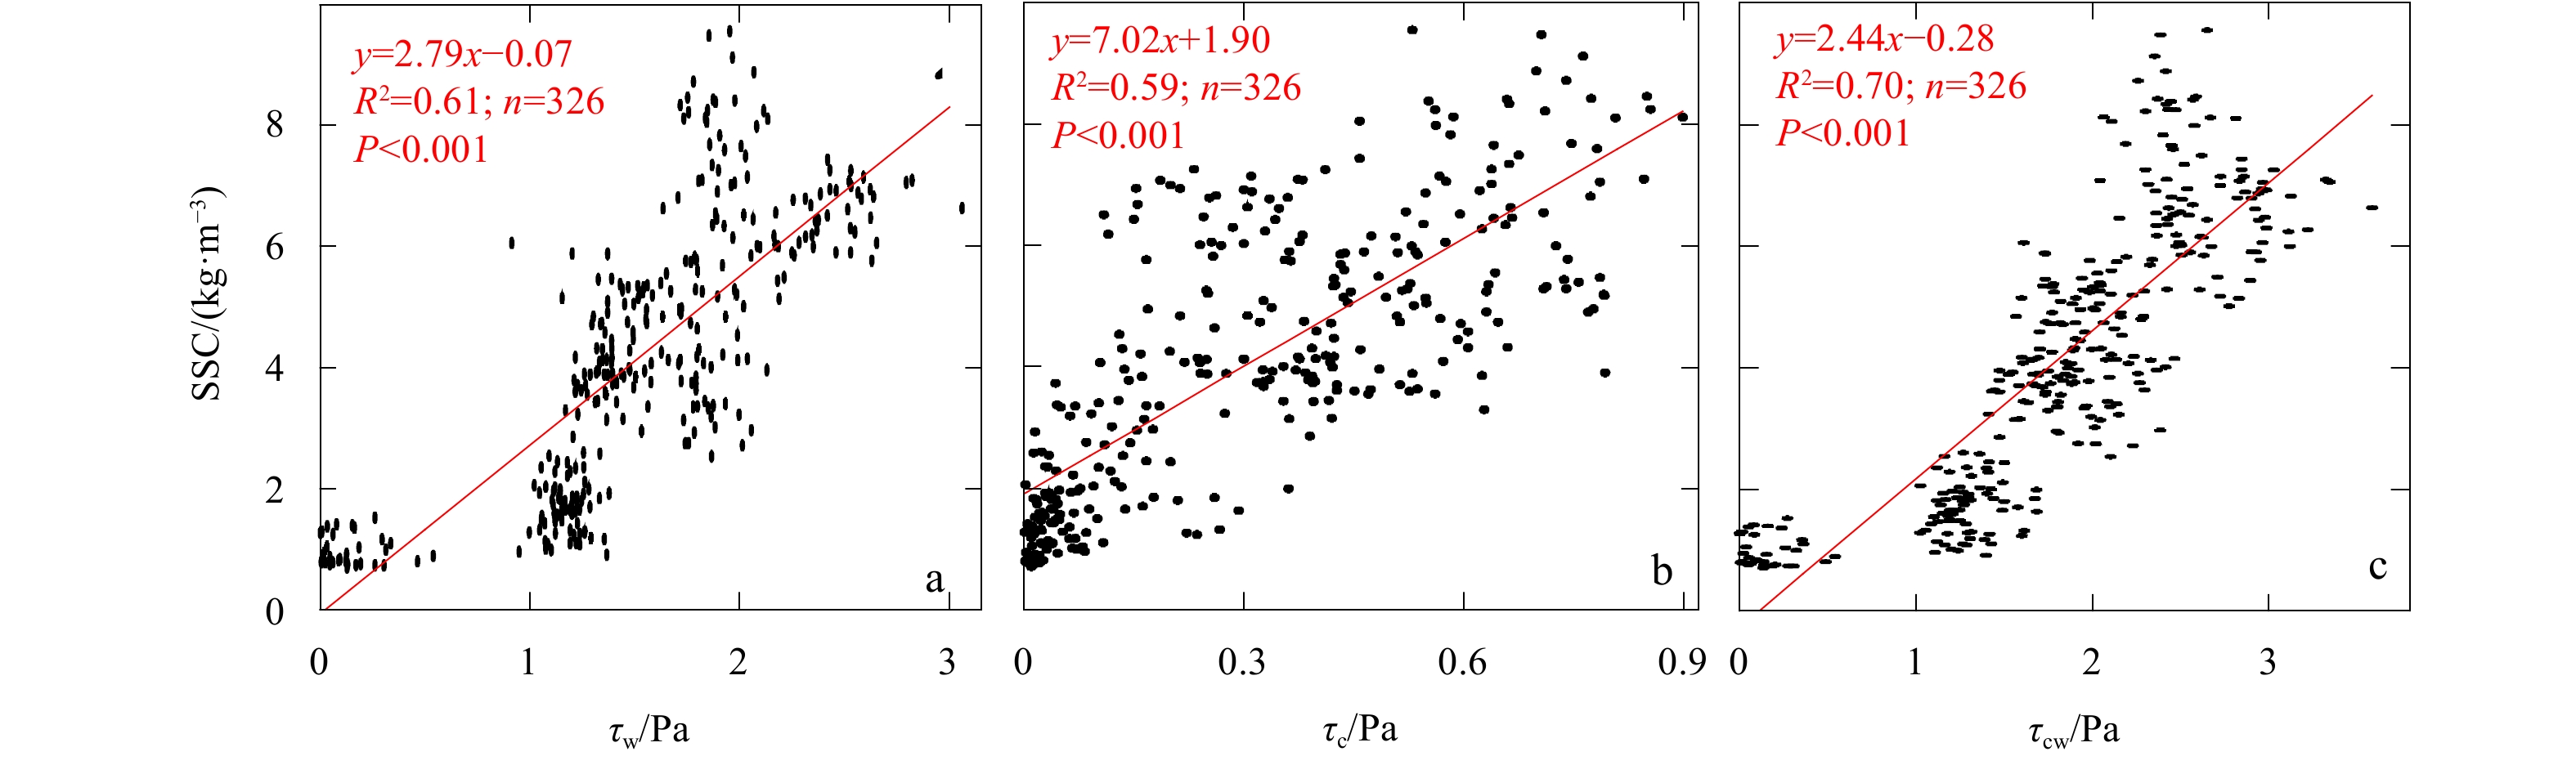
Figure 13. Linear regression results between SSC and wave-induced BSS (a), current-induced BSS (b), and combined wave-current BSS (c).
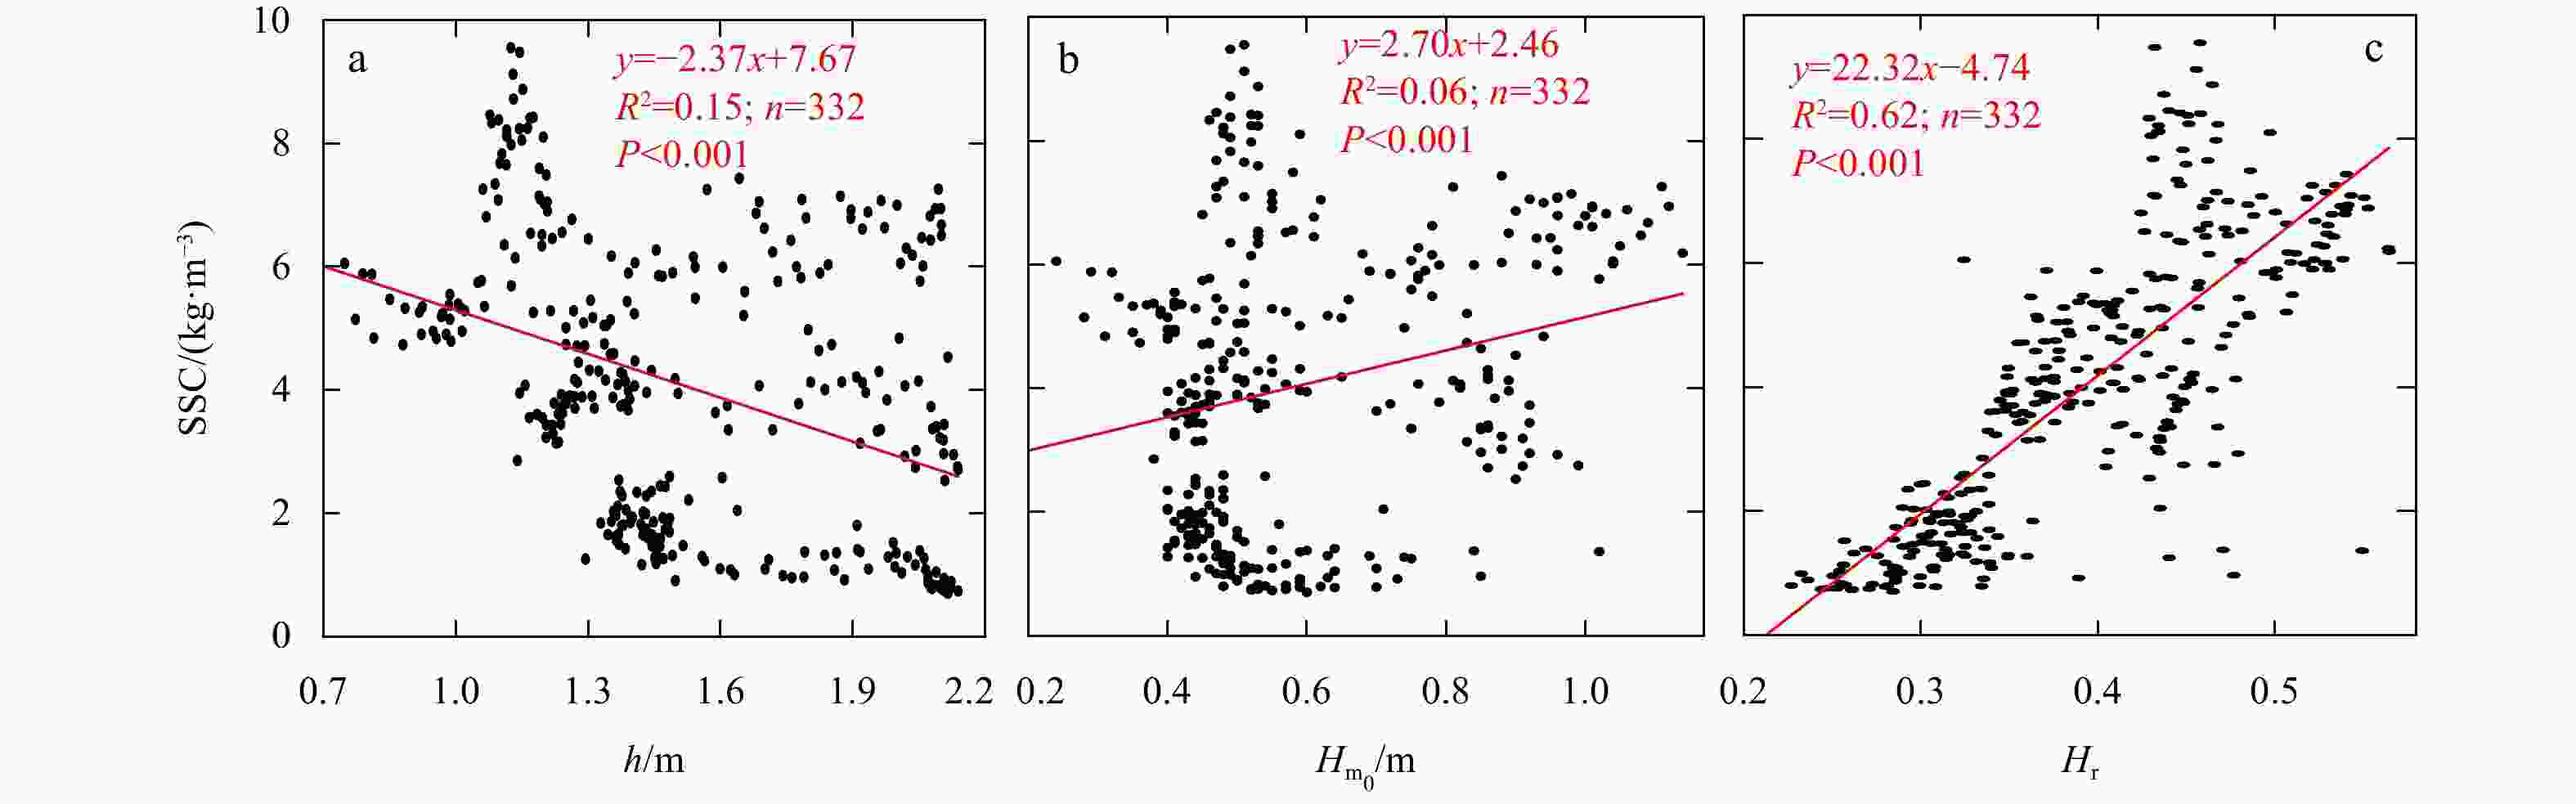
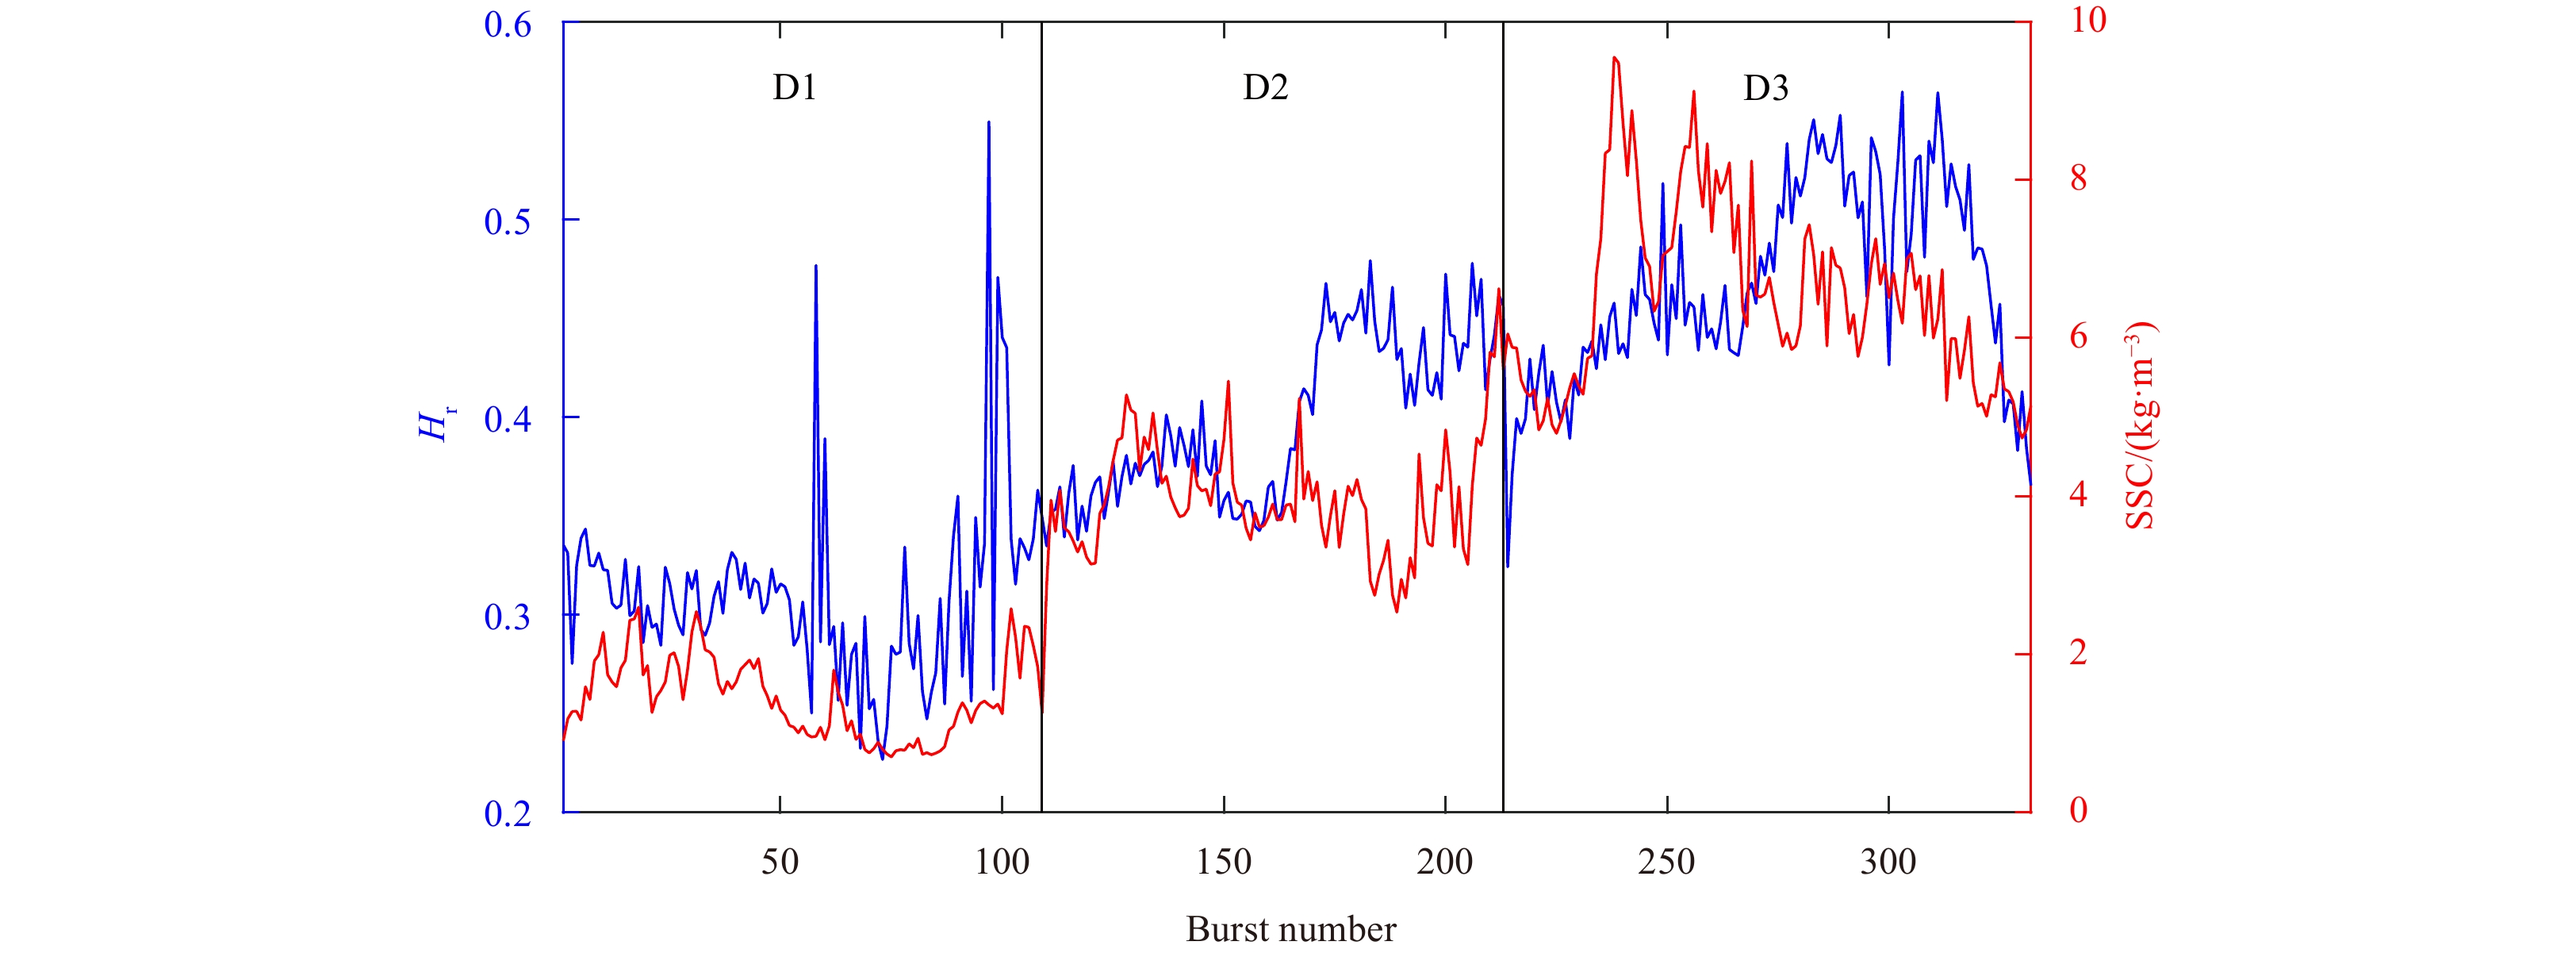
Figure 15. Linear regression results between SSC and water depth (h) (a), mean wave height (Hm0) (b), and relative wave height (Hr) (c).
Table 1. Sediment parameters of the samples
Sampling point Dme($ {\text{ϕ}}$) D50($ {\text{ϕ}}$) Sc Sk Ku HSW01 2.40 2.48 0.84 −0.22 1.19 HSW02 2.65 2.65 0.67 −0.11 1.11 HSW03 2.70 2.68 0.76 −0.17 1.32 HSW04 2.62 2.64 0.78 −0.22 1.24 HSW05 2.62 2.64 0.72 −0.17 1.17 HSW06 2.74 2.73 0.63 −0.11 1.06 HSW07 1.82 2.08 1.14 −0.21 0.81 HSW08 2.59 2.61 0.58 −0.06 0.99 HSW09 2.73 2.61 1.15 0.27 1.99 HSW10 2.95 2.82 1.03 0.36 2.47 HSW11 2.90 2.88 0.47 0.02 0.95 HSW12 2.86 2.83 0.49 −0.02 0.95  下载: 导出CSV
Table 2. Statistical average of extreme events of overall bursts (332)
Parameter (n1/n)/% (n0/n1)/% (n1m1/nm)/% (n0m0/nm)/% SSC 10.88 (23.64) 11.31 (20.06) 12.57 (24.62) 4.02 (10.73) TKE 14.79 (14.90) 10.93 (24.17) 41.80 (32.69) 8.81 (20.58) Note: Data are shown as the mean value (standard deviation).
下载: 导出CSV
Table 3. Statistical averages of extreme events from Bursts 235–318
Parameter (n1/n)/% (n0/n1 ) /% (n1m1/nm)/% (n0m0/nm)/% (n0/n)/% SSC 40.82
(31.57)30.72
(19.52)45.27
(30.44)15.36
(16.76)14.35
(16.78)TKE 29.37
(16.62)41.60
(32.18)79.77
(11.60)34.25
(28.39)14.35
(16.78)Note: Data are shown as the mean value (standard deviation).
下载: 导出CSV
Table 4. Extreme event analysis results utilizing the comparison parameters of wave-induced BBS (τw), current-induced BBS (τc), and combined wave-current BSS (τcw)
Parameter (n0/n)/% (n0m0/nm(SSC))/% ${\tau _{\rm{w} } }$ 18.71 31.35 ${\tau _{\rm{c} } }$ 13.80 25.04 ${\tau _{ {\rm{cw} } } }$ 20.86 35.61 Notes: n0 is the number of correlated extreme events where the extreme SSC events and comparison parameters occur synchronously, n is the number of total data points (332), m0 is the mean SSC value of the correlated extreme event data points, and m is the mean SSC value of the total data points.
下载: 导出CSV
Table 5. Evaluation of the relationship between SSC and wave-induced BSS (τw), current-induced BSS (τc), and combined wave-current BSS (τcw) via the Pearson (rp) and Spearman rank (rs) correlation coefficients
Parameter rp rs ${\tau _{\rm{w} } }$ 0.78 0.84 ${\tau _{\rm{c} } }$ 0.77 0.79 ${\tau _{ {\rm{cw} } } }$ 0.84 0.89
下载: 导出CSV
Table 6. Extreme event analysis results utilizing the comparison parameters of water depth (h), mean wave height (Hm0), and relative wave height (Hr)
Parameter (n0/n)/% (n0m0/nm(SSC))/% h 5.83 9.44 Hm0 11.66 18.63 Hr 18.10 30.30 Notes: n0 is the number of correlated extreme events where the extreme SSC events and comparison parameters occur synchronously, n is the number of total data points (332), m0 is the mean SSC of the correlated extreme event data points, and m is the mean SSC of the total data points.
下载: 导出CSV
Table 7. Evaluation of the relationship between SSC and water depth (h), mean wave height (Hm0), relative wave height (Hr) via the Pearson correlation coefficient (rp) and Spearman rank correlation coefficients (rs)
Parameter rp rs h −0.37 −0.44 Hm0 0.27 0.25 Hr 0.82 0.84
下载: 导出CSV
-
[1] Aagaard T, Greenwood B. 1995. Suspended sediment transport and morphological response on a dissipative beach. Continental Shelf Research, 15(9): 1061–1086. doi: 10.1016/0278-4343(94)00068-X [2] Aagaard T, Greenwood B, Hughes M. 2013. Sediment transport on dissipative, intermediate and reflective beaches. Earth-Science Reviews, 124: 32–50. doi: 10.1016/j.earscirev.2013.05.002 [3] Aagaard T, Hughes M G. 2006. Sediment suspension and turbulence in the swash zone of dissipative beaches. Marine Geology, 228(1−2): 117–135 [4] Aagaard T, Hughes M G. 2010. Breaker turbulence and sediment suspension in the surf zone. Marine Geology, 271(3−4): 250–259. doi: 10.1016/j.margeo.2010.02.019 [5] Beach R A, Sternberg R W. 1996. Suspended-sediment transport in the surf zone: response to breaking waves. Continental Shelf Research, 16(15): 1989–2003. doi: 10.1016/0278-4343(96)00029-5 [6] Bolaños R, Thorne P D, Wolf J. 2012. Comparison of measurements and models of bed stress, bedforms and suspended sediments under combined currents and waves. Coastal Engineering, 62: 19–30. doi: 10.1016/j.coastaleng.2011.12.005 [7] Brenninkmeyer S J B. 1976. In situ measurements of rapidly fluctuating, high sediment concentrations. Marine Geology, 20(2): 117–128. doi: 10.1016/0025-3227(76)90082-7 [8] Conley D C, Beach R A. 2003. Cross-shore sediment transport partitioning in the nearshore during a storm event. Journal of Geophysical Research: Oceans, 108(C3): 3065. doi: 10.1029/2001JC001230 [9] Cox D T, Anderson S L. 2001. Statistics of intermittent surf zone turbulence and observations of large eddies using PIV. Coastal Engineering Journal, 43(2): 121–131. doi: 10.1142/S057856340100030X [10] Cox D T, Kobayashi N. 2000. Identification of intense, intermittent coherent motions under shoaling and breaking waves. Journal of Geophysical Research: Oceans, 105(C6): 14223–14236. doi: 10.1029/2000JC900048 [11] Fan Renfu, Wei Hao, Zhao Liang, et al. 2019. Identify the impacts of waves and tides to coastal suspended sediment concentration based on high-frequency acoustic observations. Marine Geology, 408: 154–164. doi: 10.1016/j.margeo.2018.12.005 [12] Folk R L, Ward W C. 1957. Brazos River bar [Texas]; a study in the significance of grain size parameters. Journal of Sedimentary Research, 27(1): 3–26. doi: 10.1306/74D70646-2B21-11D7-8648000102C1865D [13] Foster D L, Beach R A, Holman R A. 2000. Field observations of the wave bottom boundary layer. Journal of Geophysical Research: Oceans, 105(C8): 19631–19647. doi: 10.1029/1999JC900018 [14] Foster D L, Beach R A, Holman R A. 2006. Turbulence observations of the nearshore wave bottom boundary layer. Journal of Geophysical Research: Oceans, 111(C4): C04011 [15] Grant W D, Madsen O S. 1979. Combined wave and current interaction with a rough bottom. Journal of Geophysical Research: Oceans, 84(C4): 1797–1808. doi: 10.1029/JC084iC04p01797 [16] Hansen J B, Svendsen I A. 1984. A theoretical and experimental study of undertow. In: Conference of 19th International Conference on Coastal Engineering. Houston: ASCE, 2246–2262 [17] Jaffe B, Sallenger A Jr. 1992. The contribution of suspension events to sediment transport in the surf zone. In: Conference of 23rd International Conference on Coastal Engineering. Venice: ASCE, 2680–2693 [18] Jia Liangwen, Ren Jie, Nie Dan, et al. 2014. Wave-current bottom shear stresses and sediment re-suspension in the mouth bar of the Modaomen Estuary during the dry season. Acta Oceanologica Sinica, 33(7): 107–115. doi: 10.1007/s13131-014-0510-x [19] Jing L, Ridd P V. 1996. Wave-current bottom shear stresses and sediment resuspension in Cleveland Bay, Australia. Coastal Engineering, 29(1−2): 169–186. doi: 10.1016/S0378-3839(96)00023-3 [20] Jonsson I G. 1966. Wave boundary layers and friction factors. In: Conference of 10th International Conference on Coastal Engineering. Tokyo: ASCE, 127–148 [21] Kos’yan R D, Kunz H, Kuznetsov S Y, et al. 1996. Sand suspension events and intermittence of turbulence in the surf zone. In: Conference of 25th International Conference on Coastal Engineering. Orlando: ASCE, 4111–4119 [22] LeClaire P D, Ting F C K. 2017. Measurements of suspended sediment transport and turbulent coherent structures induced by breaking waves using two-phase volumetric three-component velocimetry. Coastal Engineering, 121: 56–76. doi: 10.1016/j.coastaleng.2016.11.008 [23] Liang Bingchen, Li Huajun, Lee D. 2007. Numerical study of three-dimensional suspended sediment transport in waves and currents. Ocean Engineering, 34(11−12): 1569–1583. doi: 10.1016/j.oceaneng.2006.12.002 [24] Maity S K, Maiti R. 2016. Analysis of sedimentation in connection to grain size and shear stress at lower reach of the Rupnarayan River, West Bengal, India. Indian Journal of Geo-Marine Sciences, 45(9): 1128–1137 [25] Nahler G. 2009. Pearson correlation coefficient. In: Nahler G, ed. Dictionary of Pharmaceutical Medicine. Vienna: Springer Vienna, 132 [26] Nielsen P. 1992. Coastal Bottom Boundary Layers and Sediment Transport. Singapore: World Scientific [27] Ogston A S, Sternberg R W. 1995. On the importance of nearbed sediment flux measurements for estimating sediment transport in the surf zone. Continental Shelf Research, 15(13): 1515–1524. doi: 10.1016/0278-4343(95)00036-Z [28] Pang Wenhong, Dai Zhijun, Ge Zhenpeng, et al. 2019. Near-bed cross-shore suspended sediment transport over a meso-macro tidal beach under varied wave conditions. Estuarine, Coastal and Shelf Science, 217: 69–80 [29] Pang Wenhong, Dai Zhijun, Ma Binbin, et al. 2020. Linkage between turbulent kinetic energy, waves and suspended sediment concentrations in the nearshore zone. Marine Geology, 425: 106190. doi: 10.1016/j.margeo.2020.106190 [30] Ruessink B G. 2010. Observations of turbulence within a natural surf zone. Journal of Physical Oceanography, 40(12): 2696–2712. doi: 10.1175/2010JPO4466.1 [31] Signell R P, Beardsley R C, Graber H C, et al. 1990. Effect of wave-current interaction on wind-driven circulation in narrow, shallow embayments. Journal of Geophysical Research: Oceans, 95(C6): 9671–9678. doi: 10.1029/JC095iC06p09671 [32] Smyth C, Hay A E. 2003. Near-bed turbulence and bottom friction during SandyDuck97. Journal of Geophysical Research: Oceans, 108(C6): 3197. doi: 10.1029/2001JC000952 [33] Soulsby R L. 1997. The Dynamics of Marine Sands: A Manual for Practical Applications. London: Thomas Thelford [34] Soulsby R L, Hamm L, Klopman G, et al. 1993. Wave-current interaction within and outside the bottom boundary layer. Coastal Engineering, 21(1−3): 41–69. doi: 10.1016/0378-3839(93)90045-A [35] Spearman C. 1904. The proof and measurement of association between two things. The American Journal of Psychology, 15(1): 72–101. doi: 10.2307/1412159 [36] Swart D H. 1974. Offshore sediment transport and equilibrium beach profiles [dissertation]. Delft, Netherlands: Delft Hydraulics Laboratory [37] Van Rijn L C. 2007. Unified view of sediment transport by currents and waves. II: suspended transport. Journal of Hydraulic Engineering, 133(6): 668–689. doi: 10.1061/(ASCE)0733-9429(2007)133:6(668) [38] Xing Fei, Wang Yaping, Wang H V. 2012. Tidal hydrodynamics and fine-grained sediment transport on the radial sand ridge system in the southern Yellow Sea. Marine Geology, 291–294: 192–210 [39] Xiong Jilian, Wang Xiaohua, Wang Yaping, et al. 2017. Mechanisms of maintaining high suspended sediment concentration over tide-dominated offshore shoals in the southern Yellow Sea. Estuarine, Coastal and Shelf Science, 191: 221–233 [40] Yang Yang, Wang Yaping, Gao Shu, et al. 2016. Sediment resuspension in tidally dominated coastal environments: new insights into the threshold for initial movement. Ocean Dynamics, 66(3): 401–417. doi: 10.1007/s10236-016-0930-6 [41] Yoon H D, Cox D T. 2012. Cross-shore variation of intermittent sediment suspension and turbulence induced by depth-limited wave breaking. Continental Shelf Research, 47: 93–106. doi: 10.1016/j.csr.2012.07.001 [42] Yu Qian, Wang Yaping, Flemming B, et al. 2012. Tide-induced suspended sediment transport: depth-averaged concentrations and horizontal residual fluxes. Continental Shelf Research, 34: 53–63. doi: 10.1016/j.csr.2011.11.015 [43] Zar J H. 1972. Significance testing of the Spearman rank correlation coefficient. Journal of the American Statistical Association, 67(339): 578–580. doi: 10.1080/01621459.1972.10481251 -


 点击查看大图
计量
- 文章访问数: 524
- HTML全文浏览量: 162
- PDF下载量: 21
- 被引次数: 0

