

Simulating the influence of various nutrient sources on hypoxia off the Changjiang River Estuary
-
Abstract: Hypoxia is increasingly reported off the Changjiang River Estuary with the confluence of multiple high volume nutrient sources. The Regional Ocean Modeling System coupled with a biological model was used to analyze the effect of different nutrient sources on the development of hypoxia off the Changjiang River Estuary. By comparing to observed data, our model suitably captured the regional dynamics of chlorophyll a, dissolved oxygen, and nutrient concentration. A series of sensitivity experiments were conducted to investigate the hypoxia response to the various nutrient sources, such as loading from the Changjiang River, Kuroshio and Taiwan Warm Current. Our model results indicated that nutrients from different sources significantly influenced the hypoxia off the Changjiang River Estuary, and it was mostly affected by nutrients sourced from the Kuroshio. The nutrients input from the Changjiang River had larger impacts on the hypoxia in the north of 30°N than that in the south of 30°N. The nutrients sourced from the Taiwan Strait had a least influence on the hypoxia off the Changjiang River Estuary.
-
Key words:
- hypoxia /
- nutrient /
- different source /
- Changjiang River Estuary
-
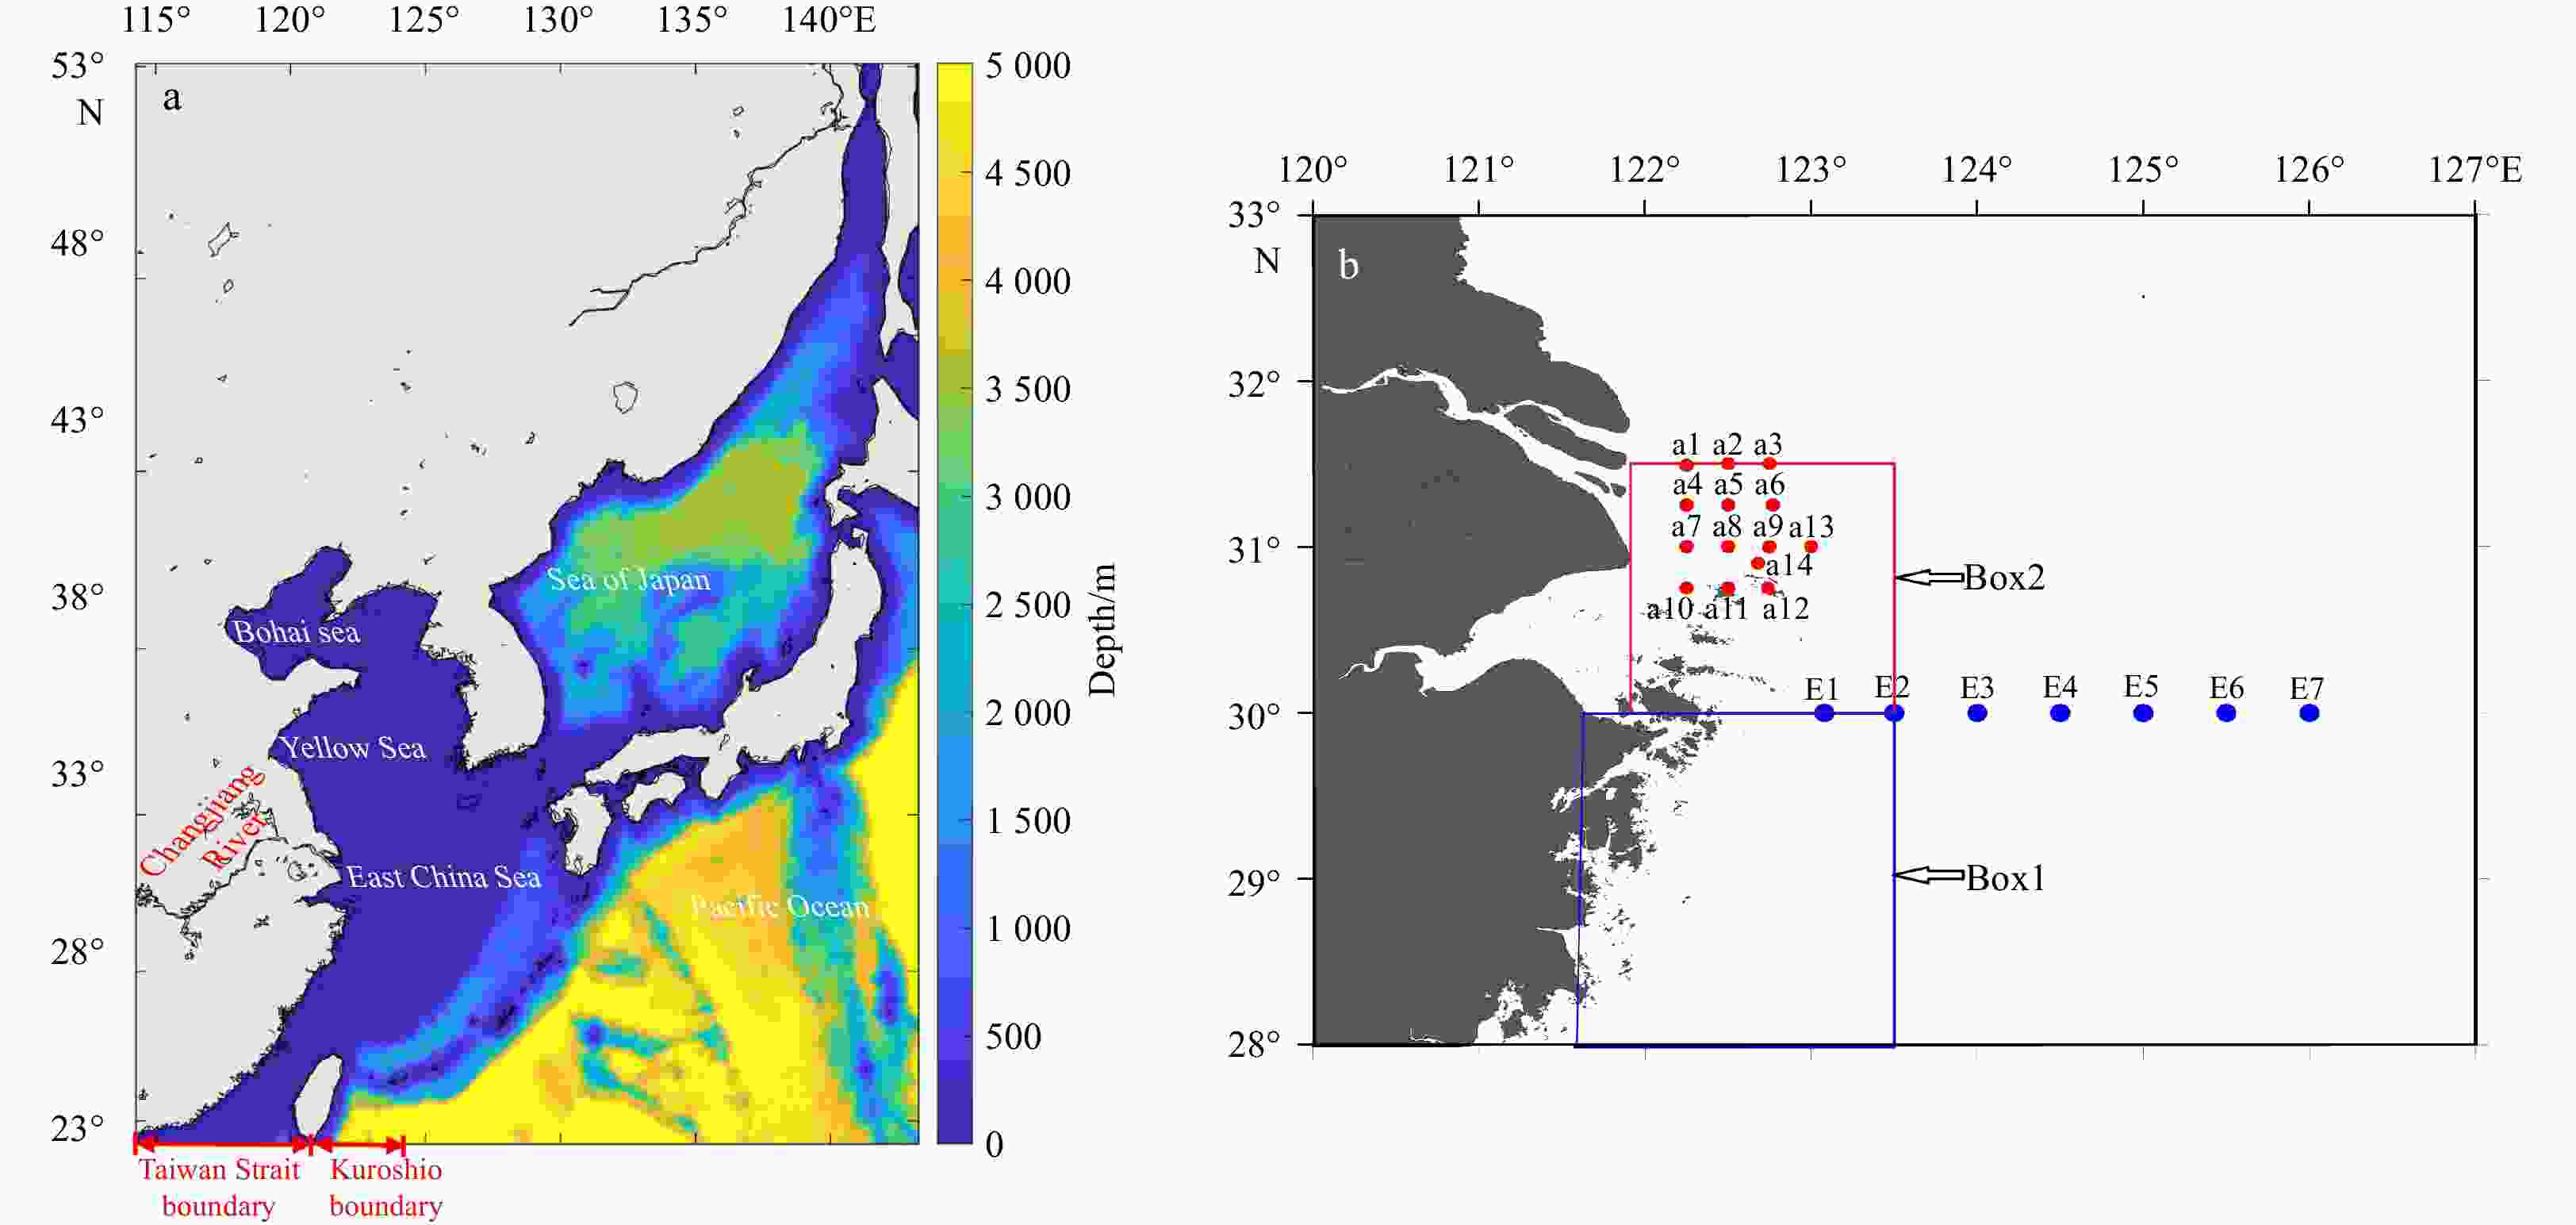
Figure 1. Model domain and water depth (a), the red two-way arrows indicate the Taiwan Strait boundary and Kuroshio boundary, respectively. In b, Red dots represent station observation in August 2011; blue dots represent observations in August 2011, 2012. The blue and red rectangles indicate Box1 and Box2, respectively.
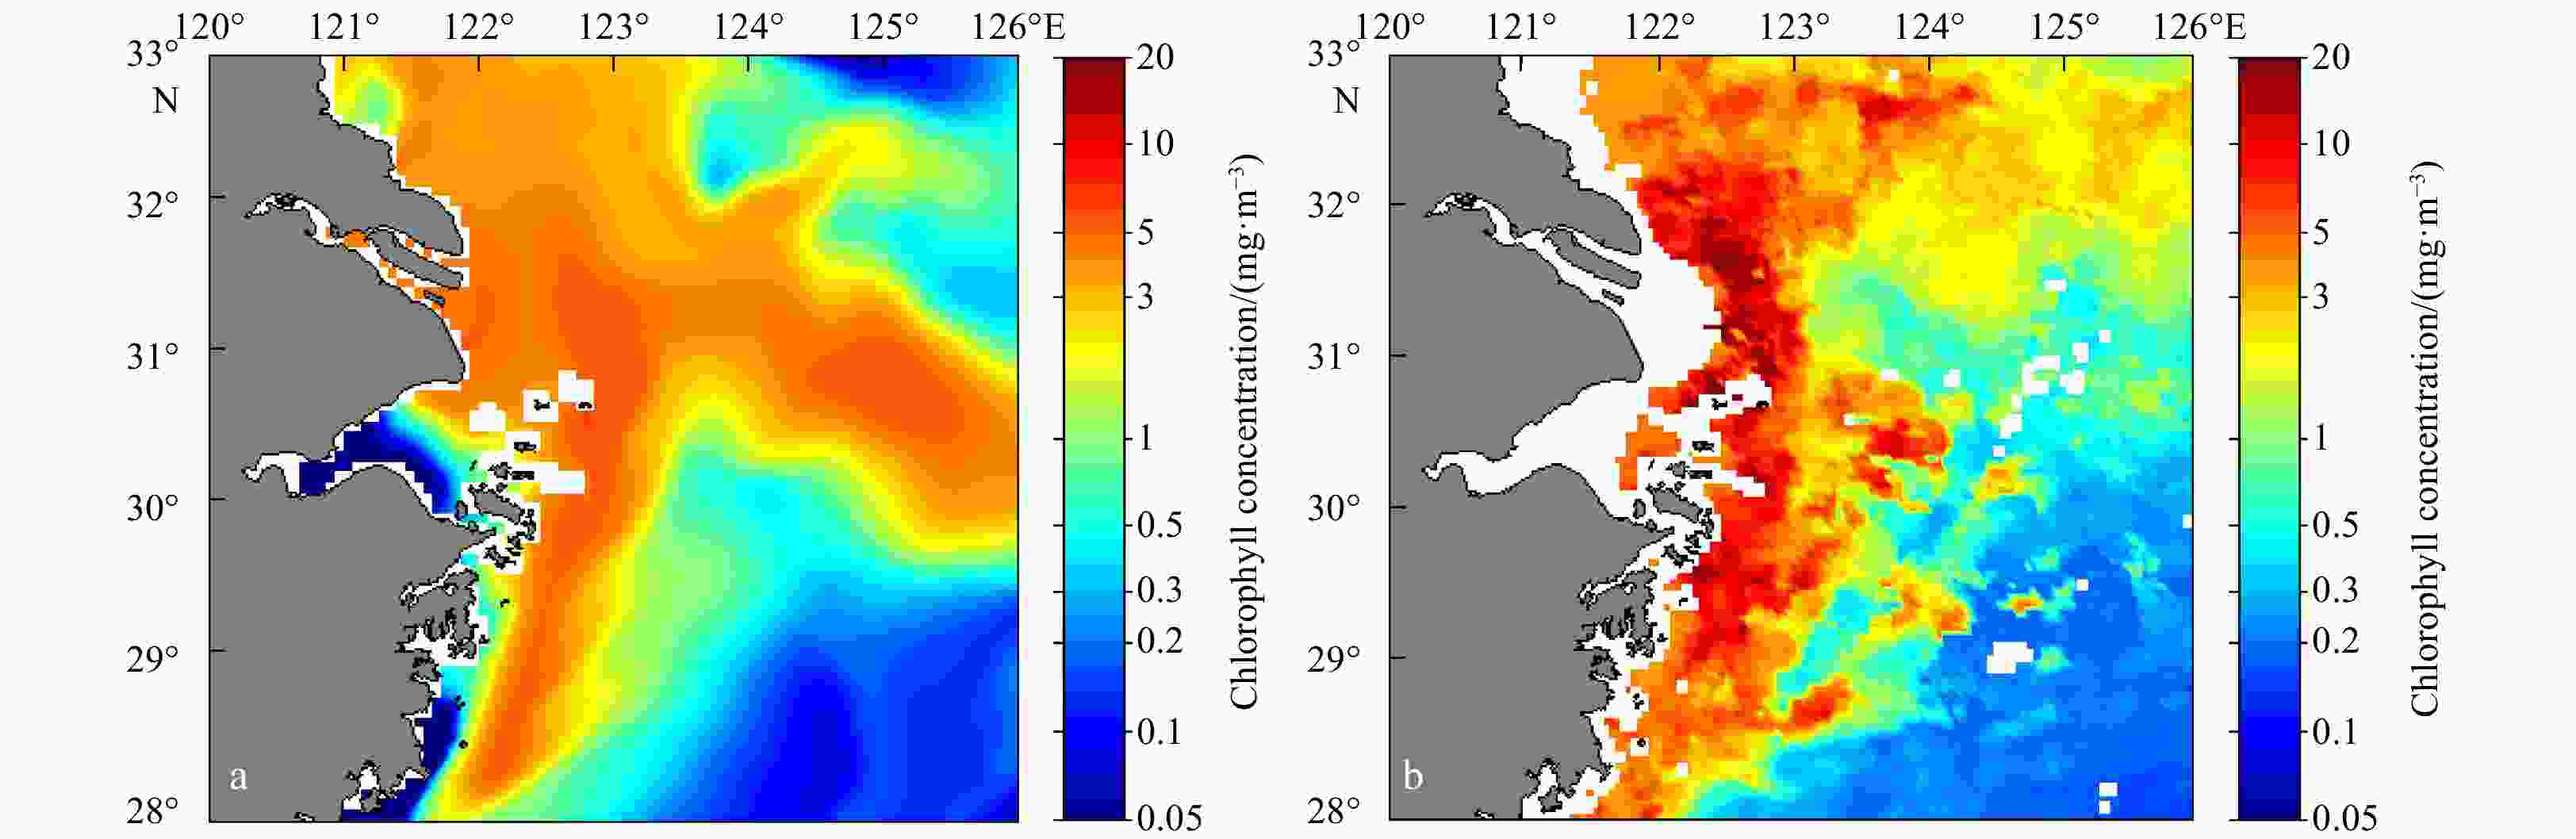
Figure 2. Monthly averaged sea surface chlorophyll concentration from the model (a) and MODIS data (b) in September 2010.

Figure 3. The
${\rm{PO}}_4^{3-} $ concentration distribution along the section at 30°N in August 2011 from the model (a) and observation (b).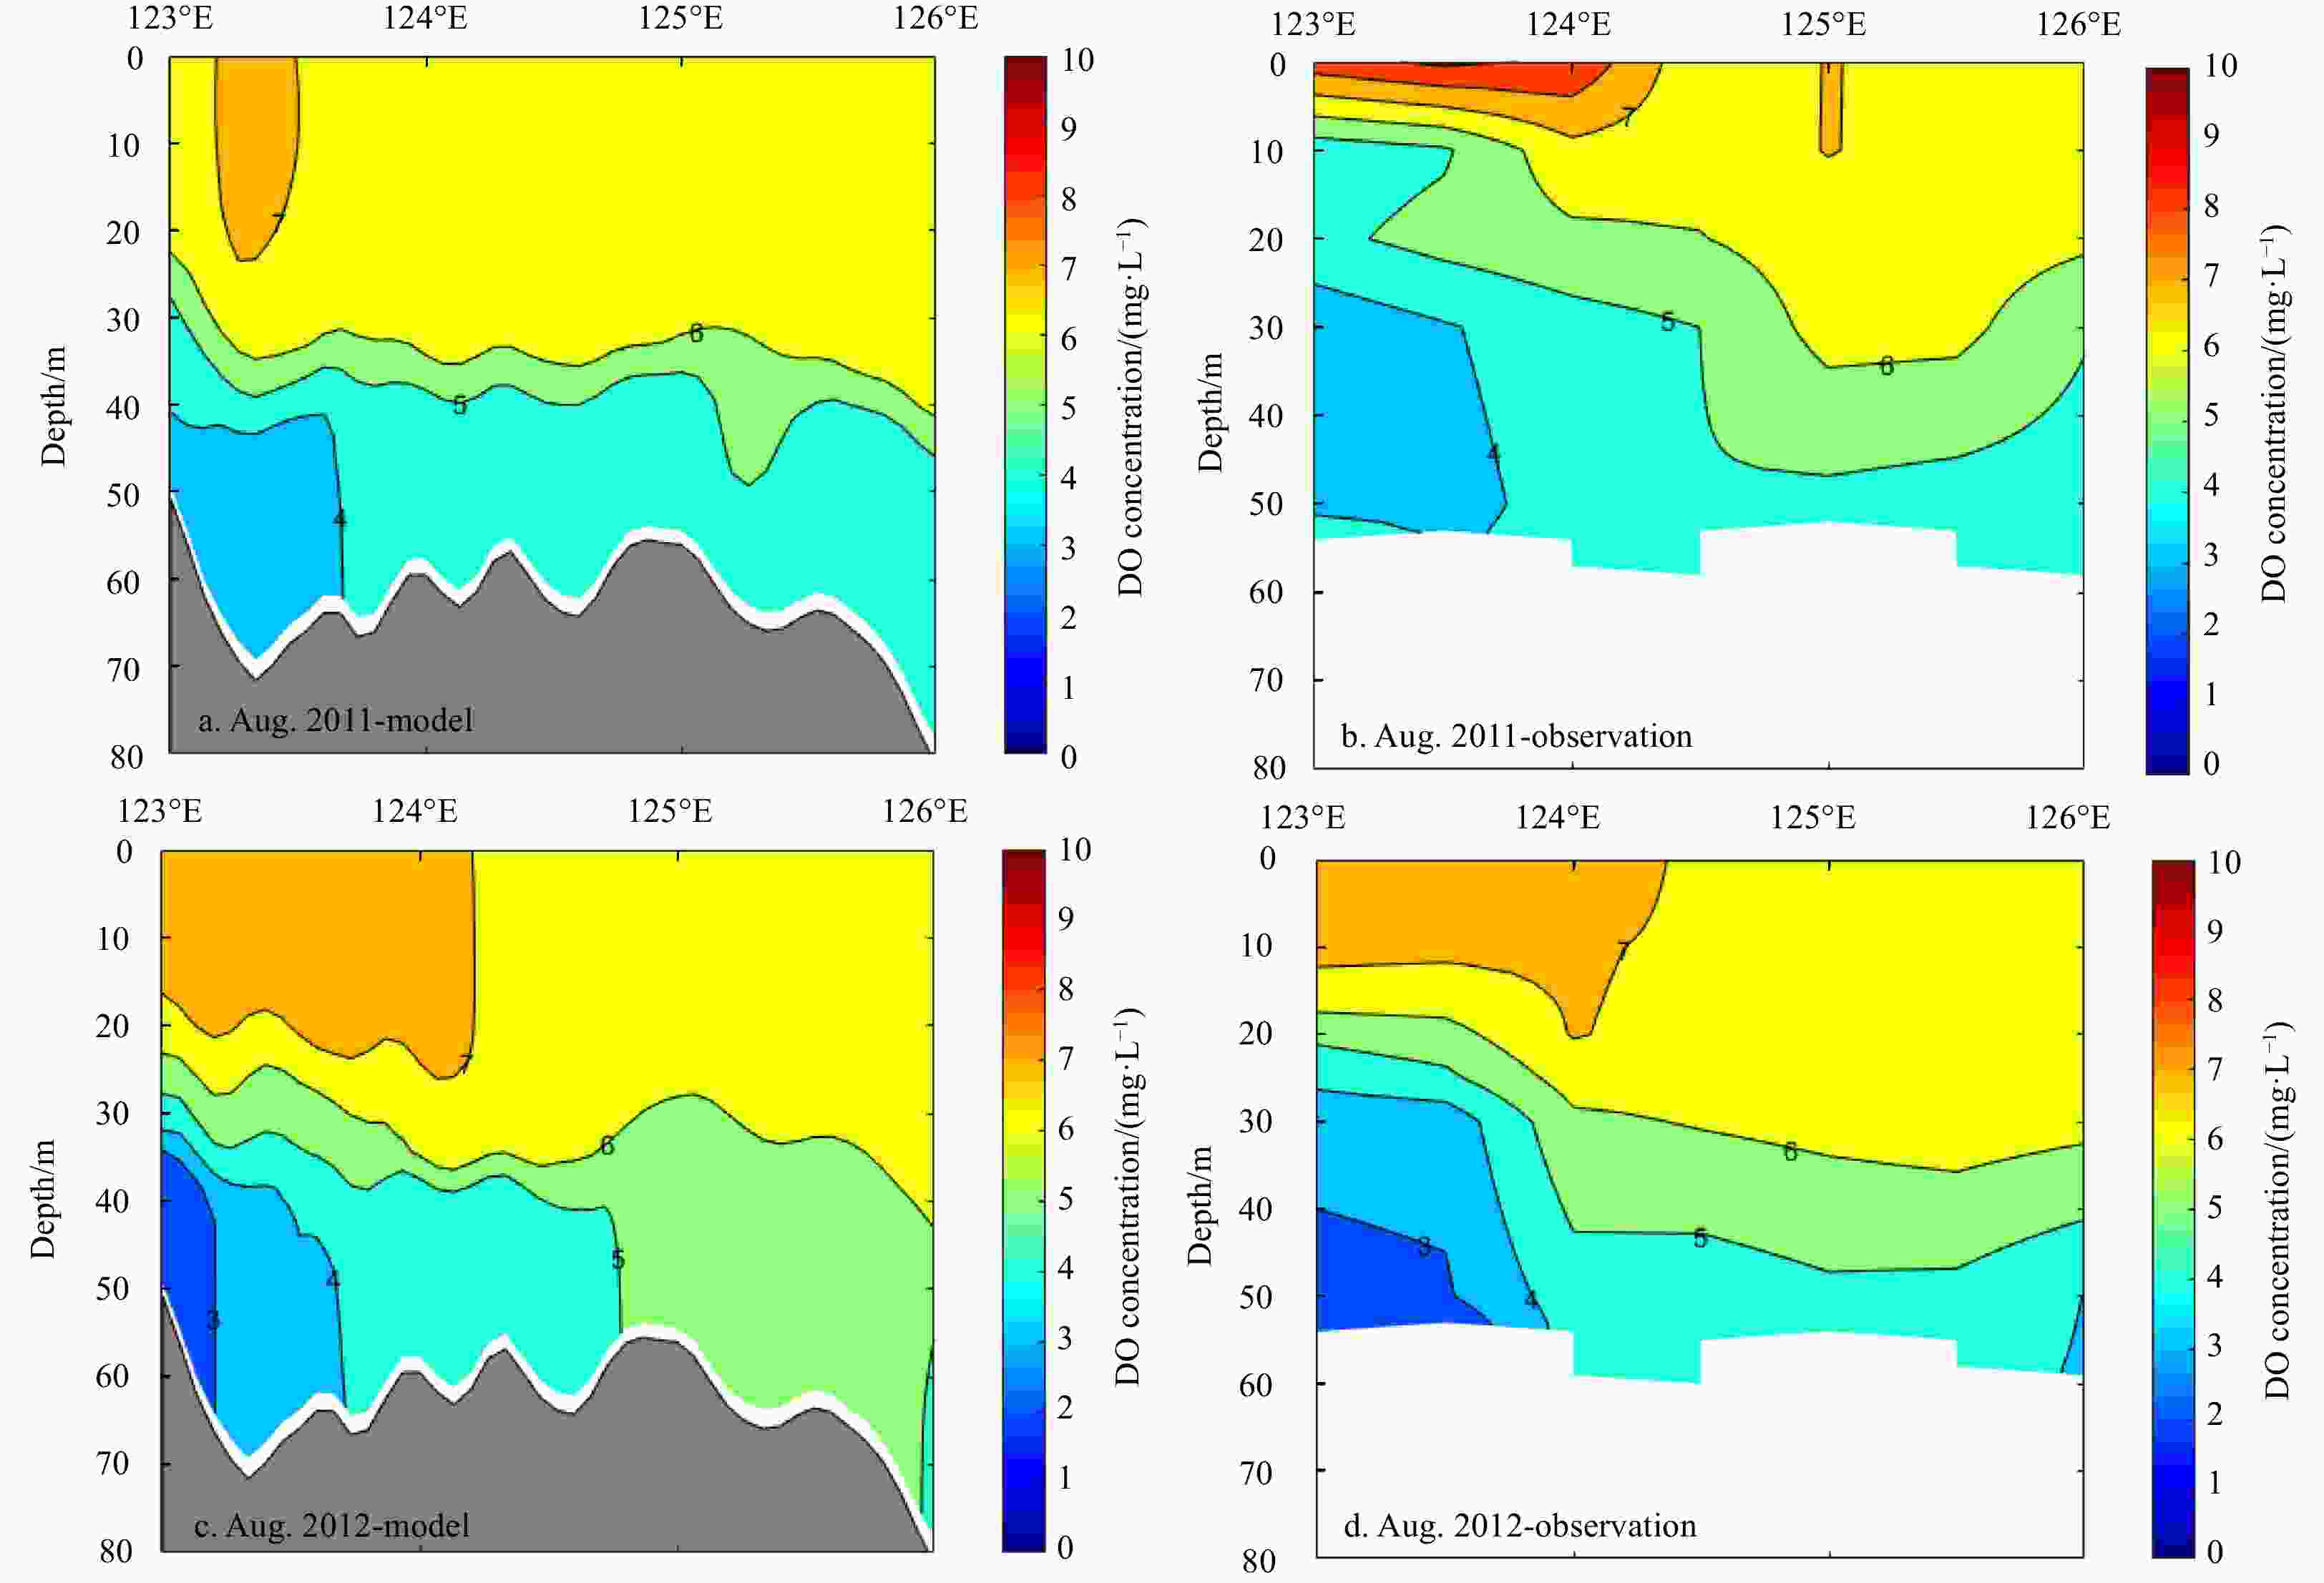
Figure 4. The distribution of DO concentration along the section at 30°N in August 2011 (a, b) and 2012 (c, d) from the model (a, c) and observation (b, d).

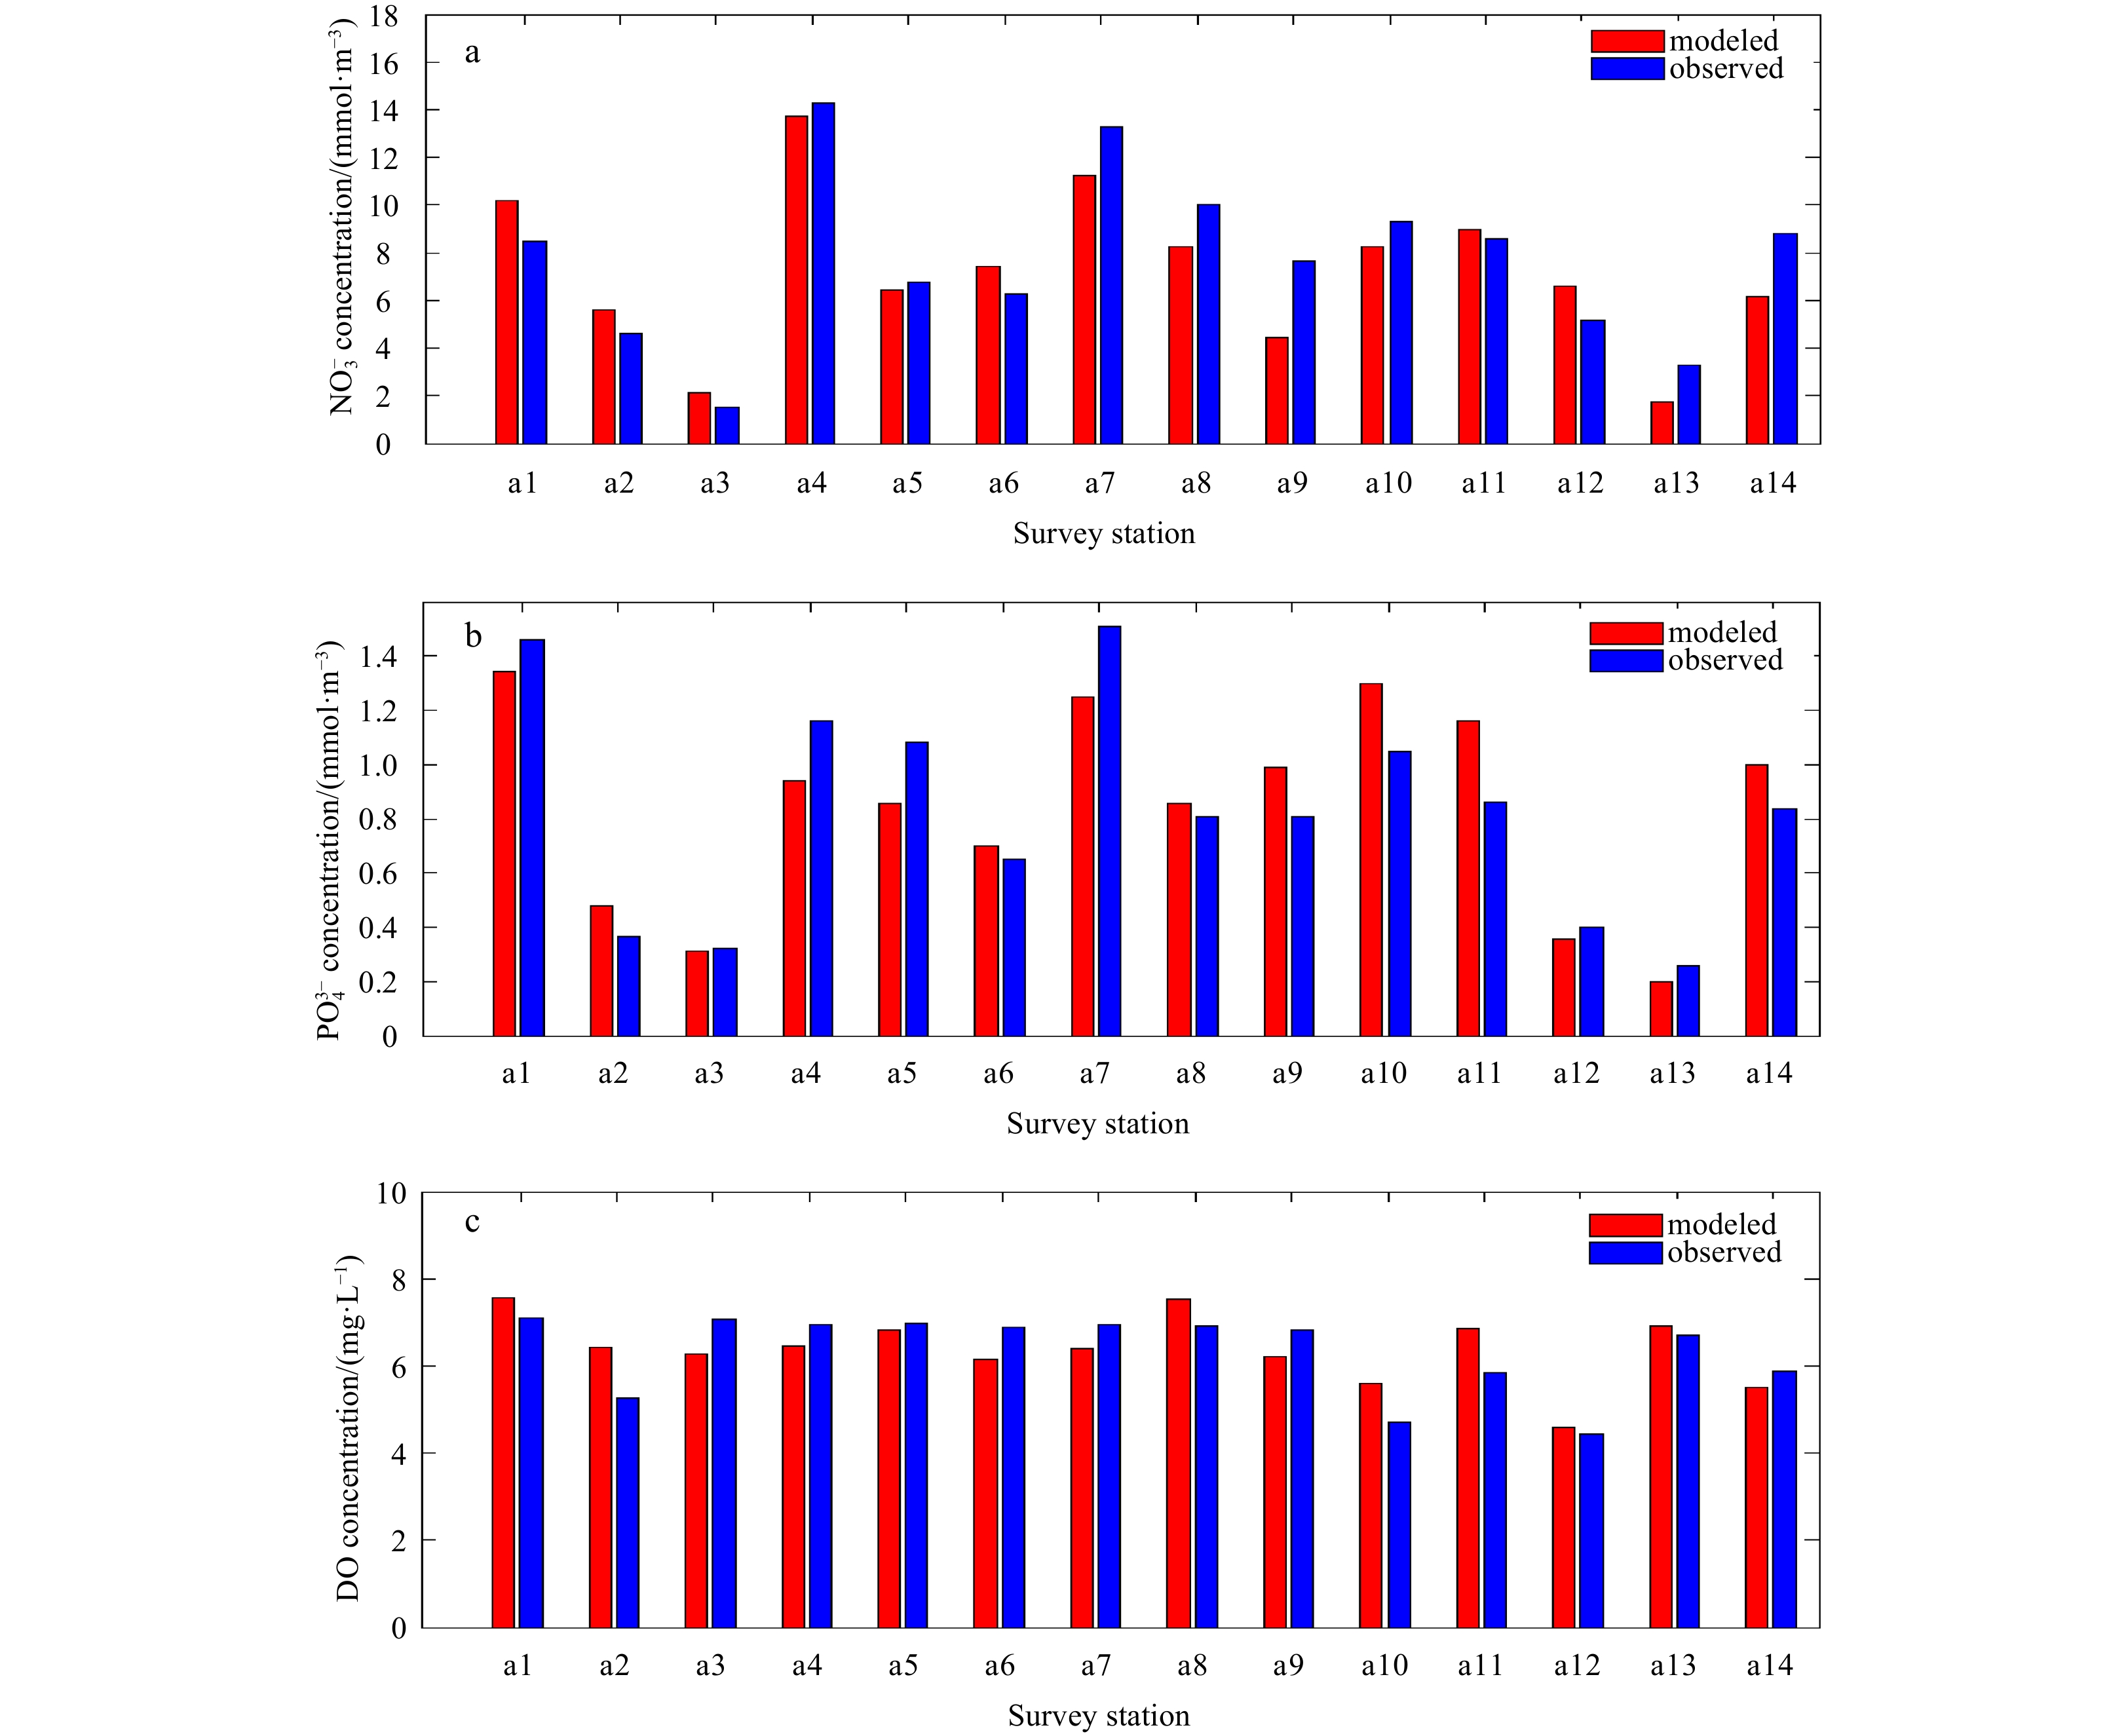
Figure 5. The comparison between modeled results (red bars) and observed data (blue bars) of sea surface
${\rm{NO}}_3^- $ (a),${\rm{PO}}_4^{3-} $ (b), and DO (c) at the stations in Fig. 1b in August 2011.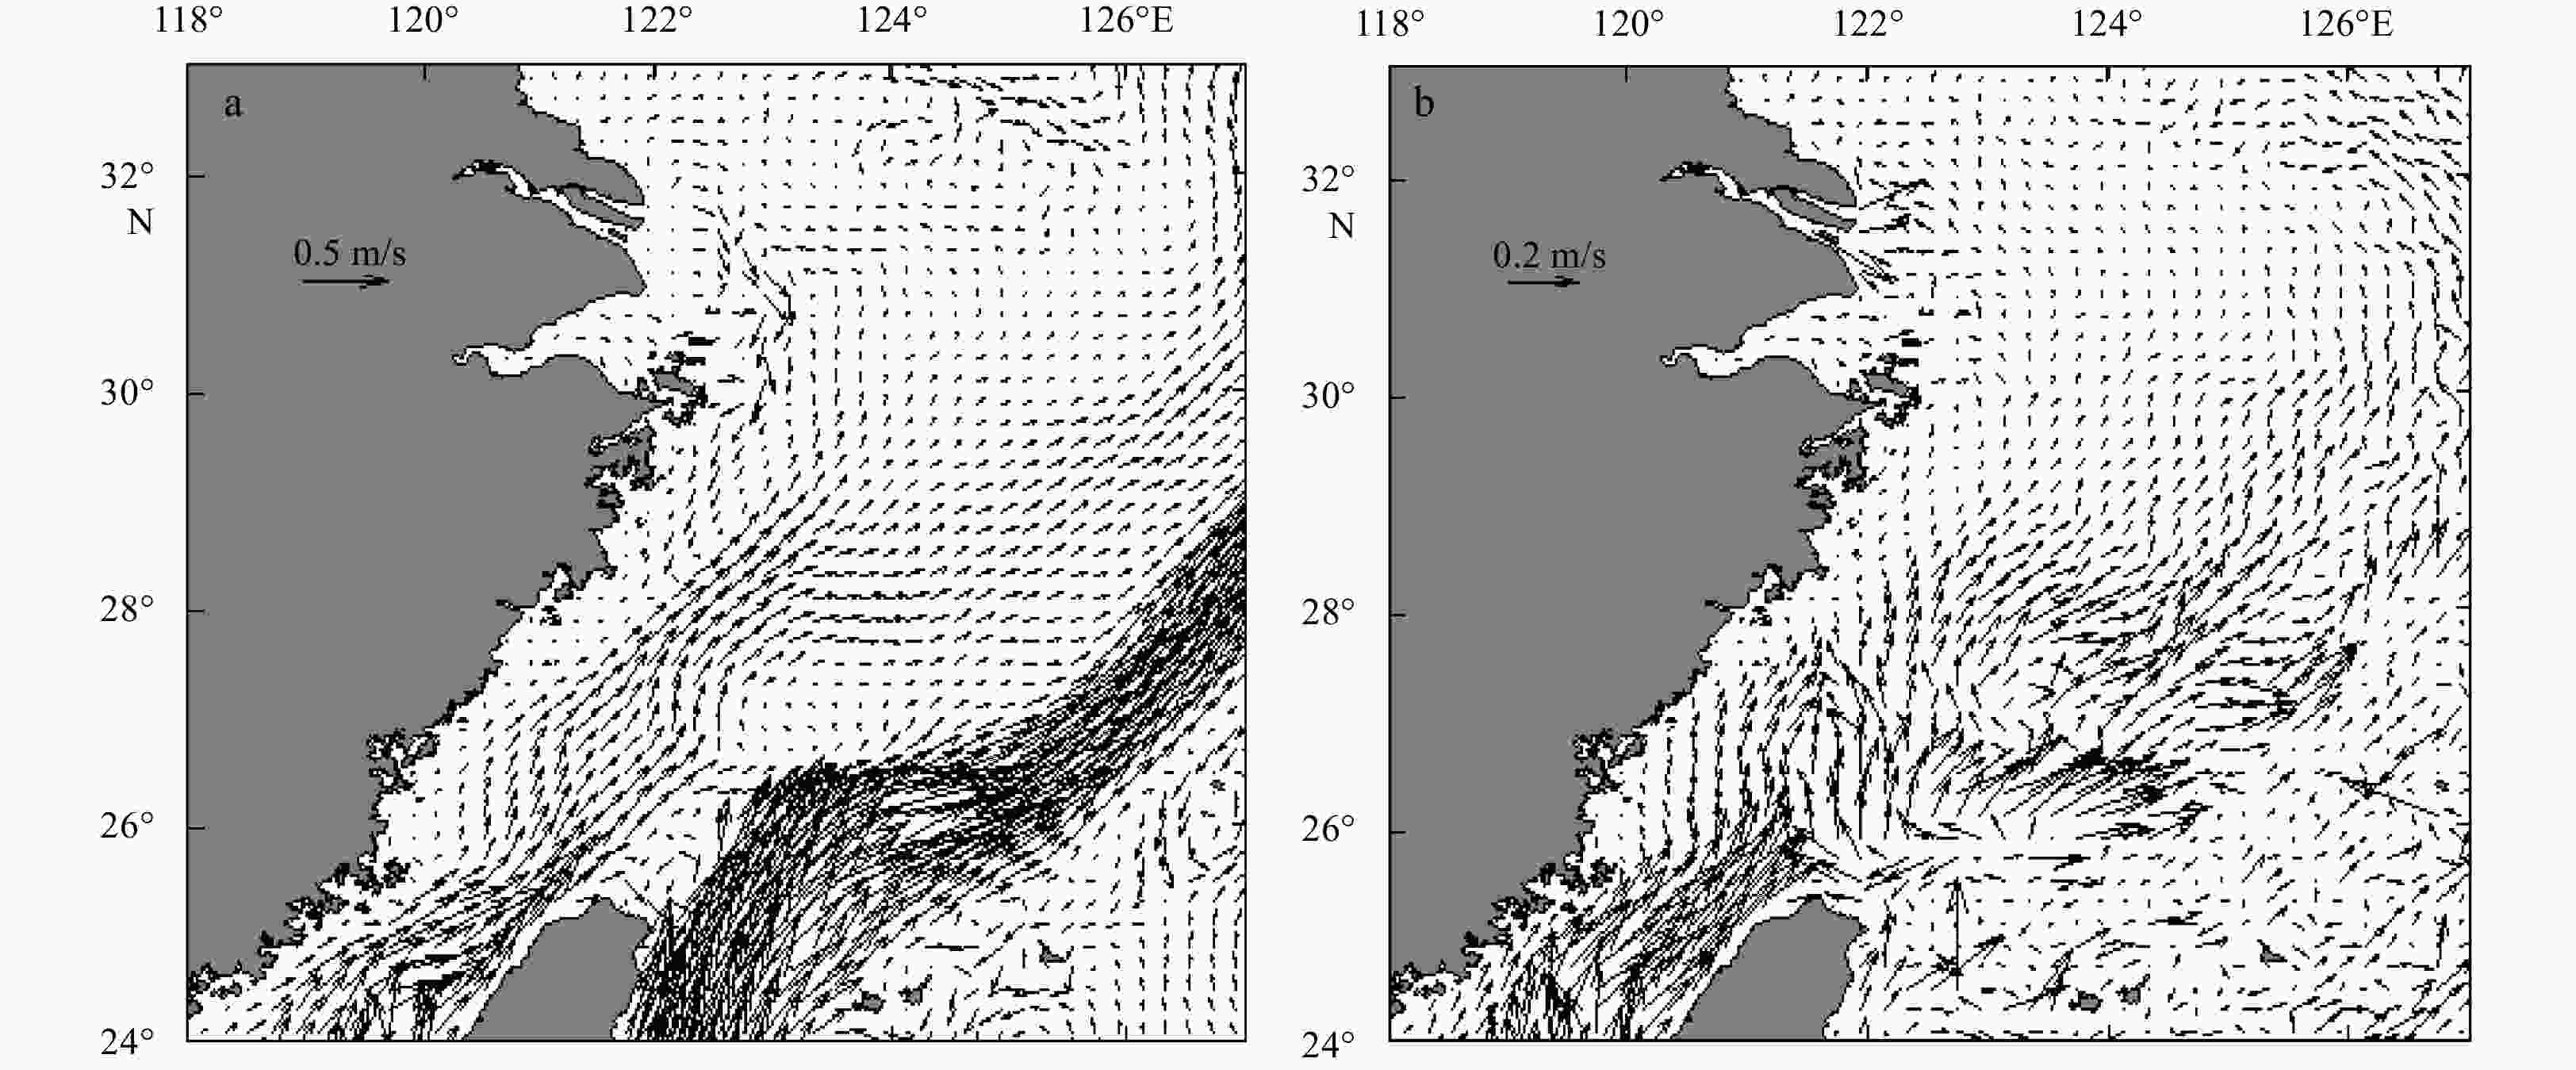
Figure 6. Model monthly mean circulation at 10 m depth in September 2010 (a), model monthly mean circulation at sea bottom in September 2010 (b).
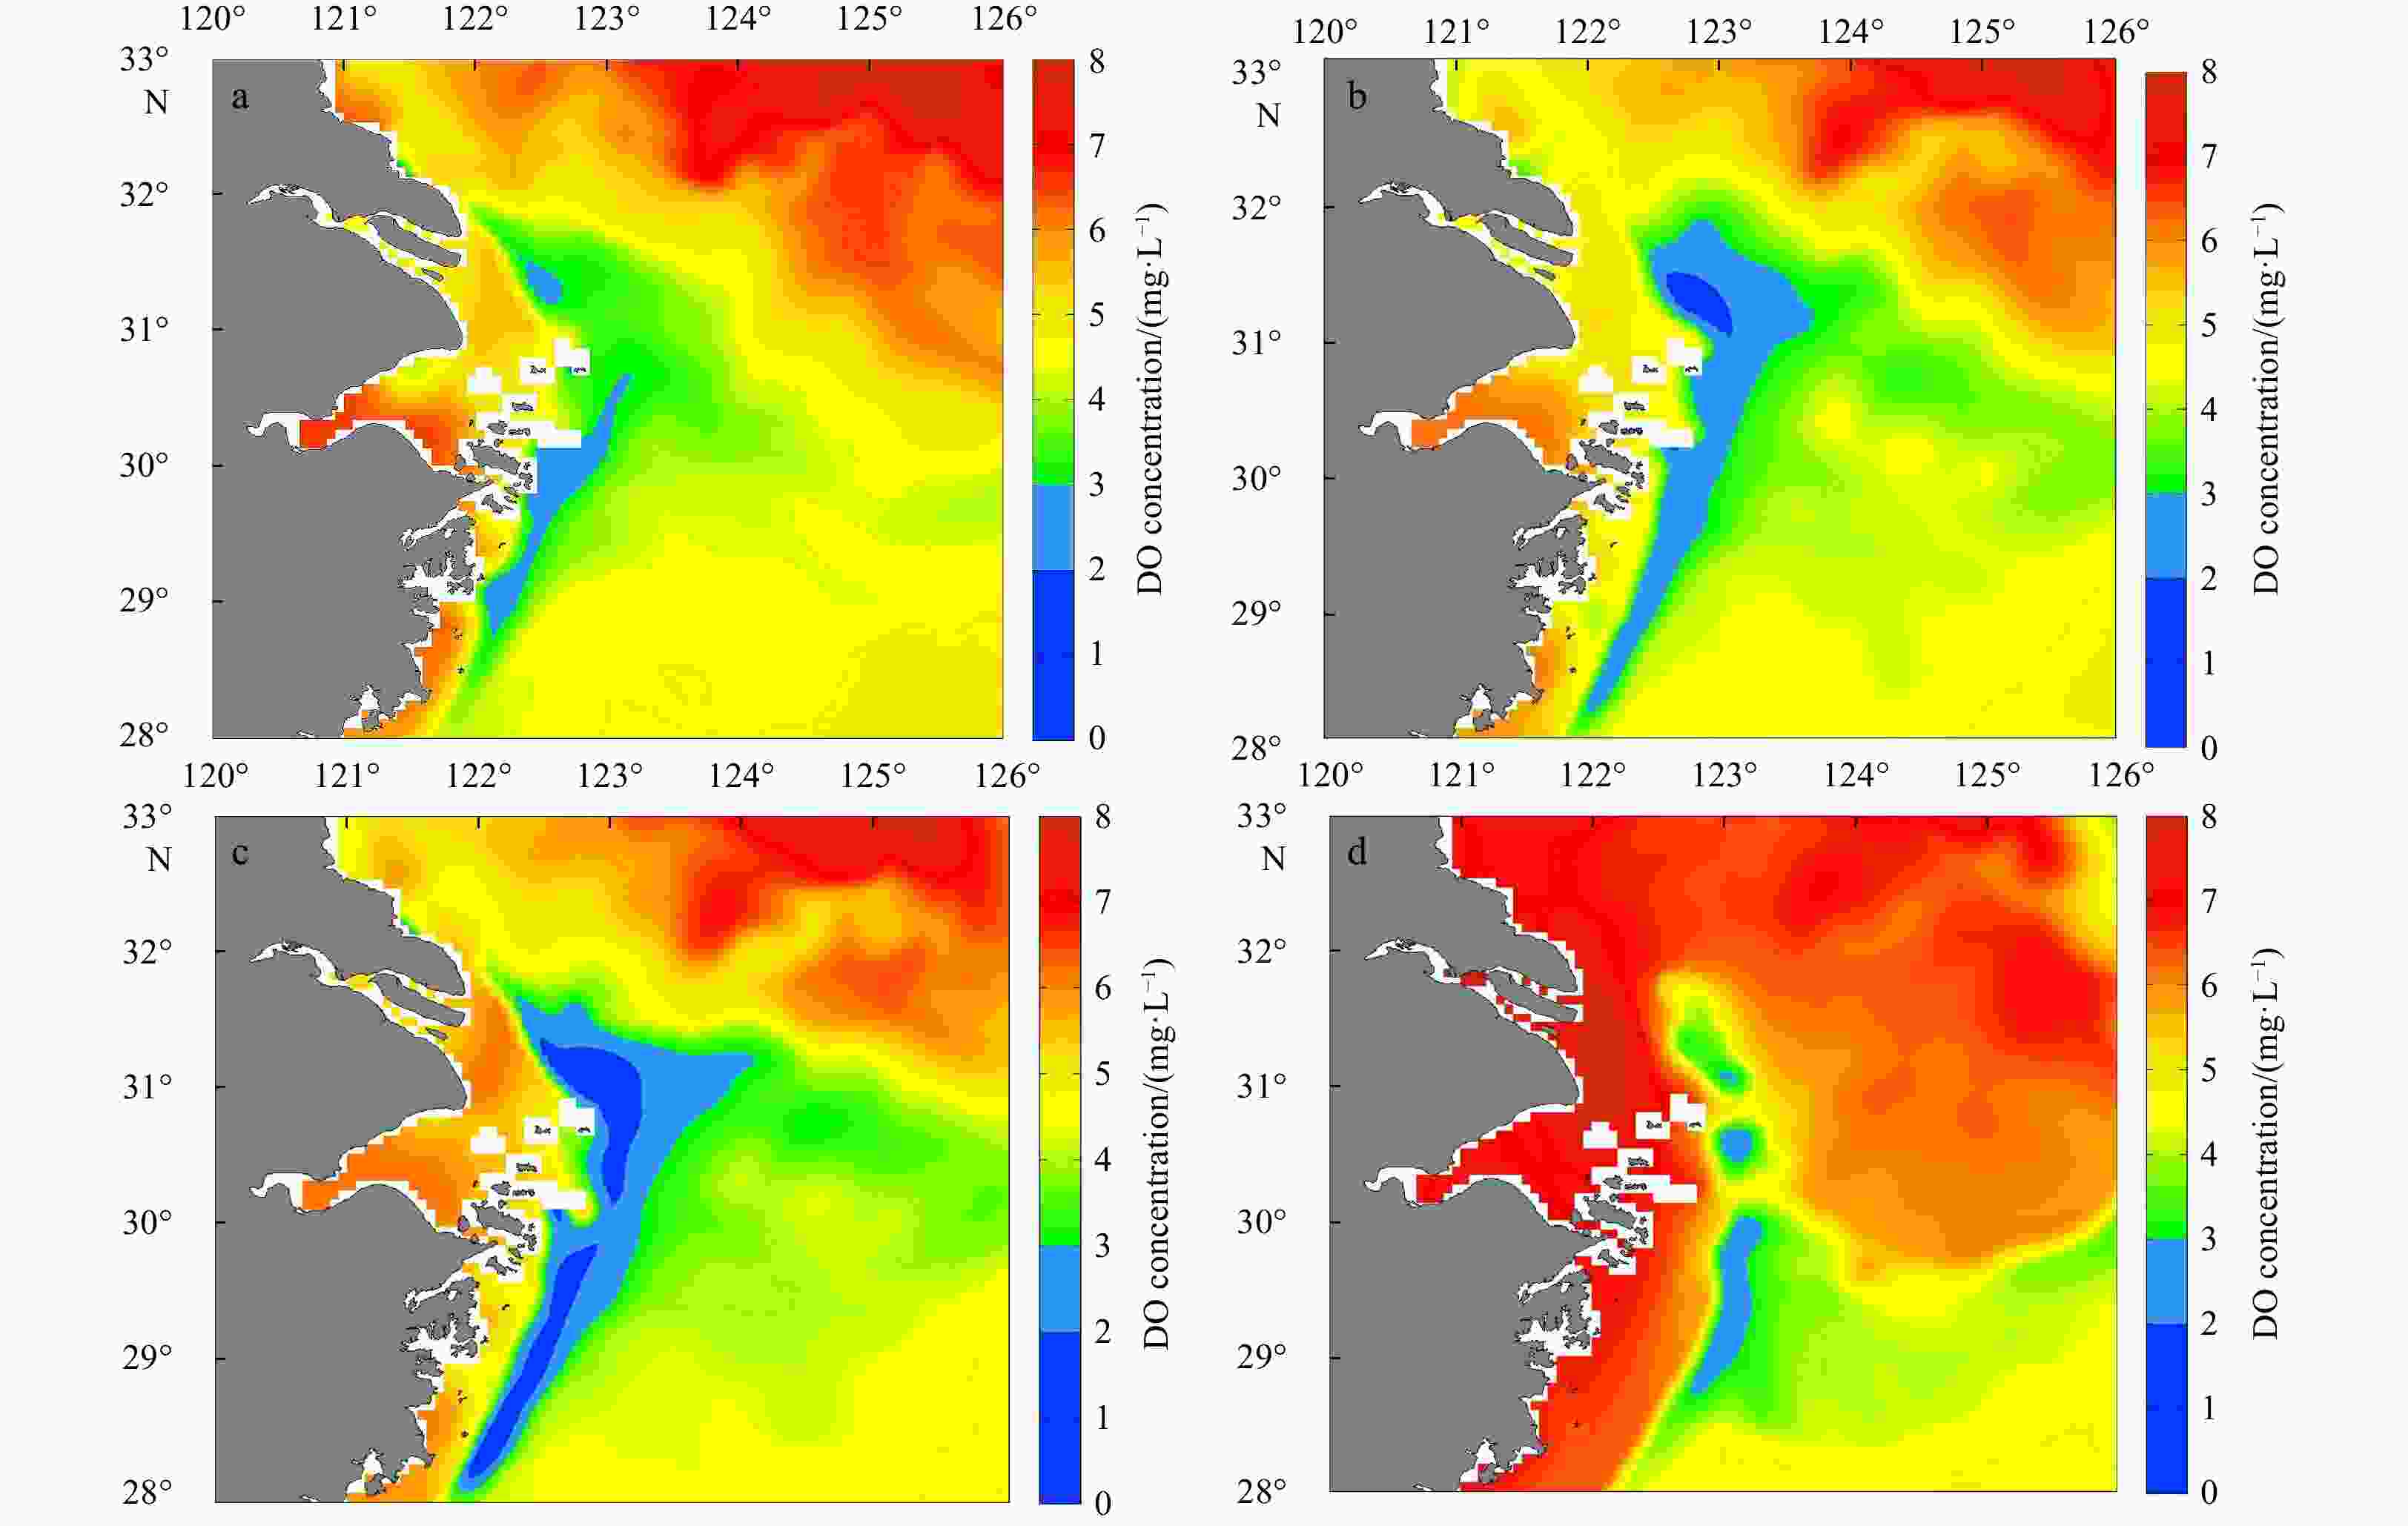
Figure 7. The simulated results of the distribution of hypoxic zone off the Changjiang River Estuary in 2010 (a. July, b. August, c. September, d. October).
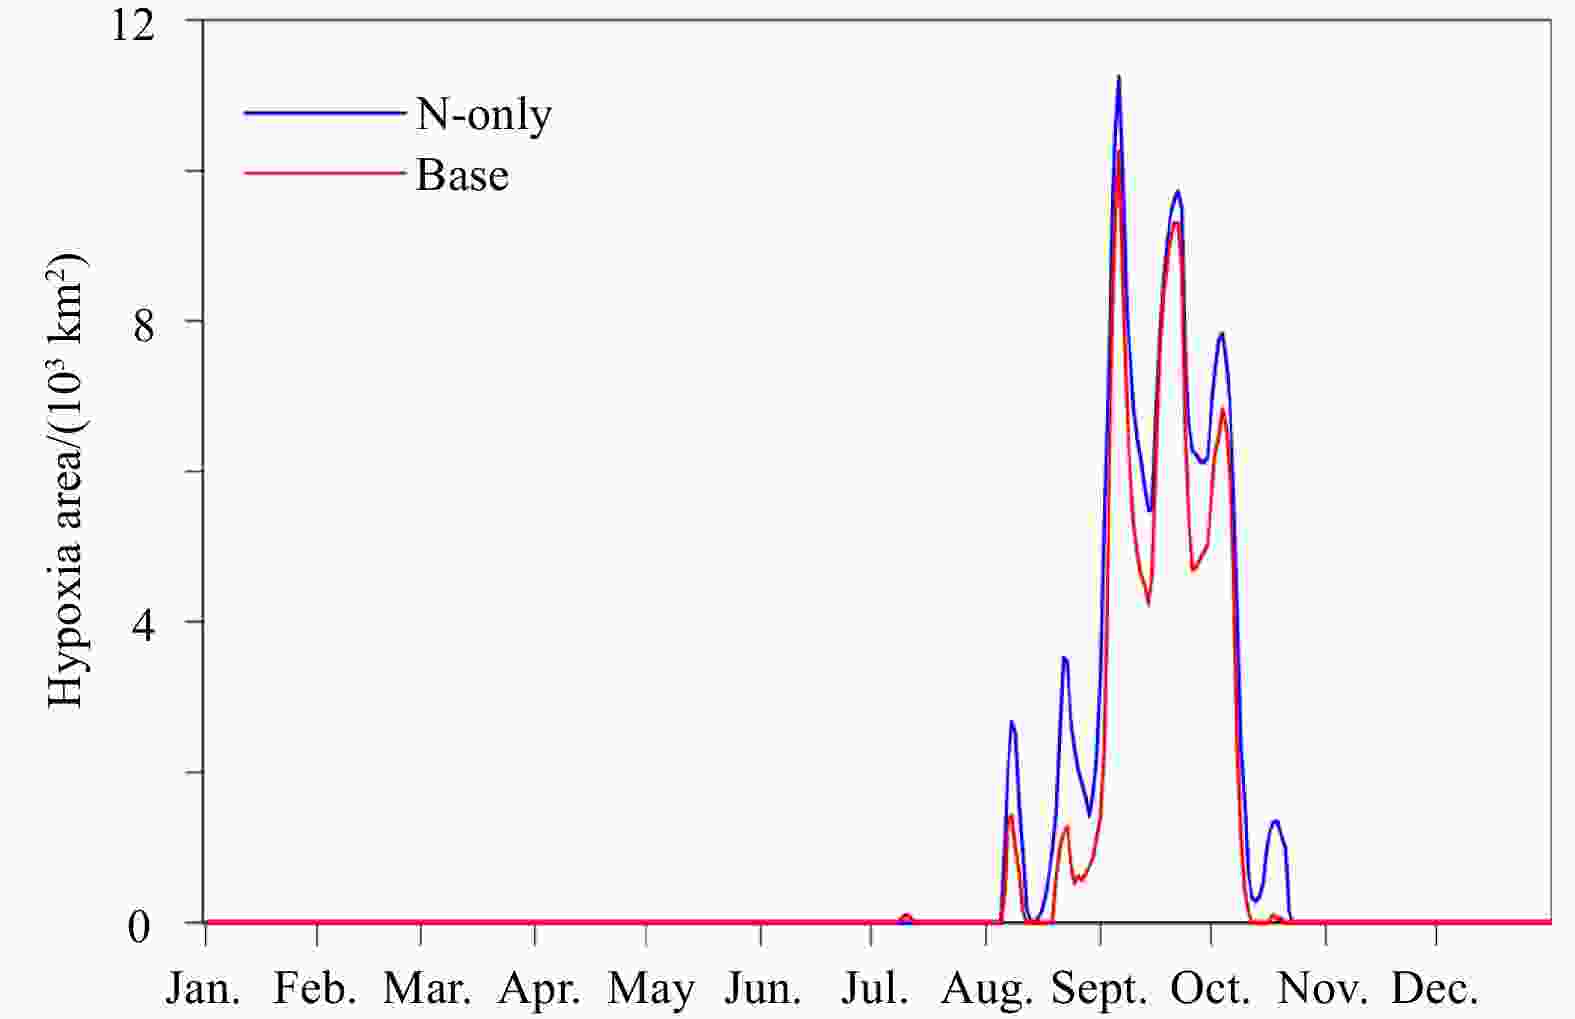
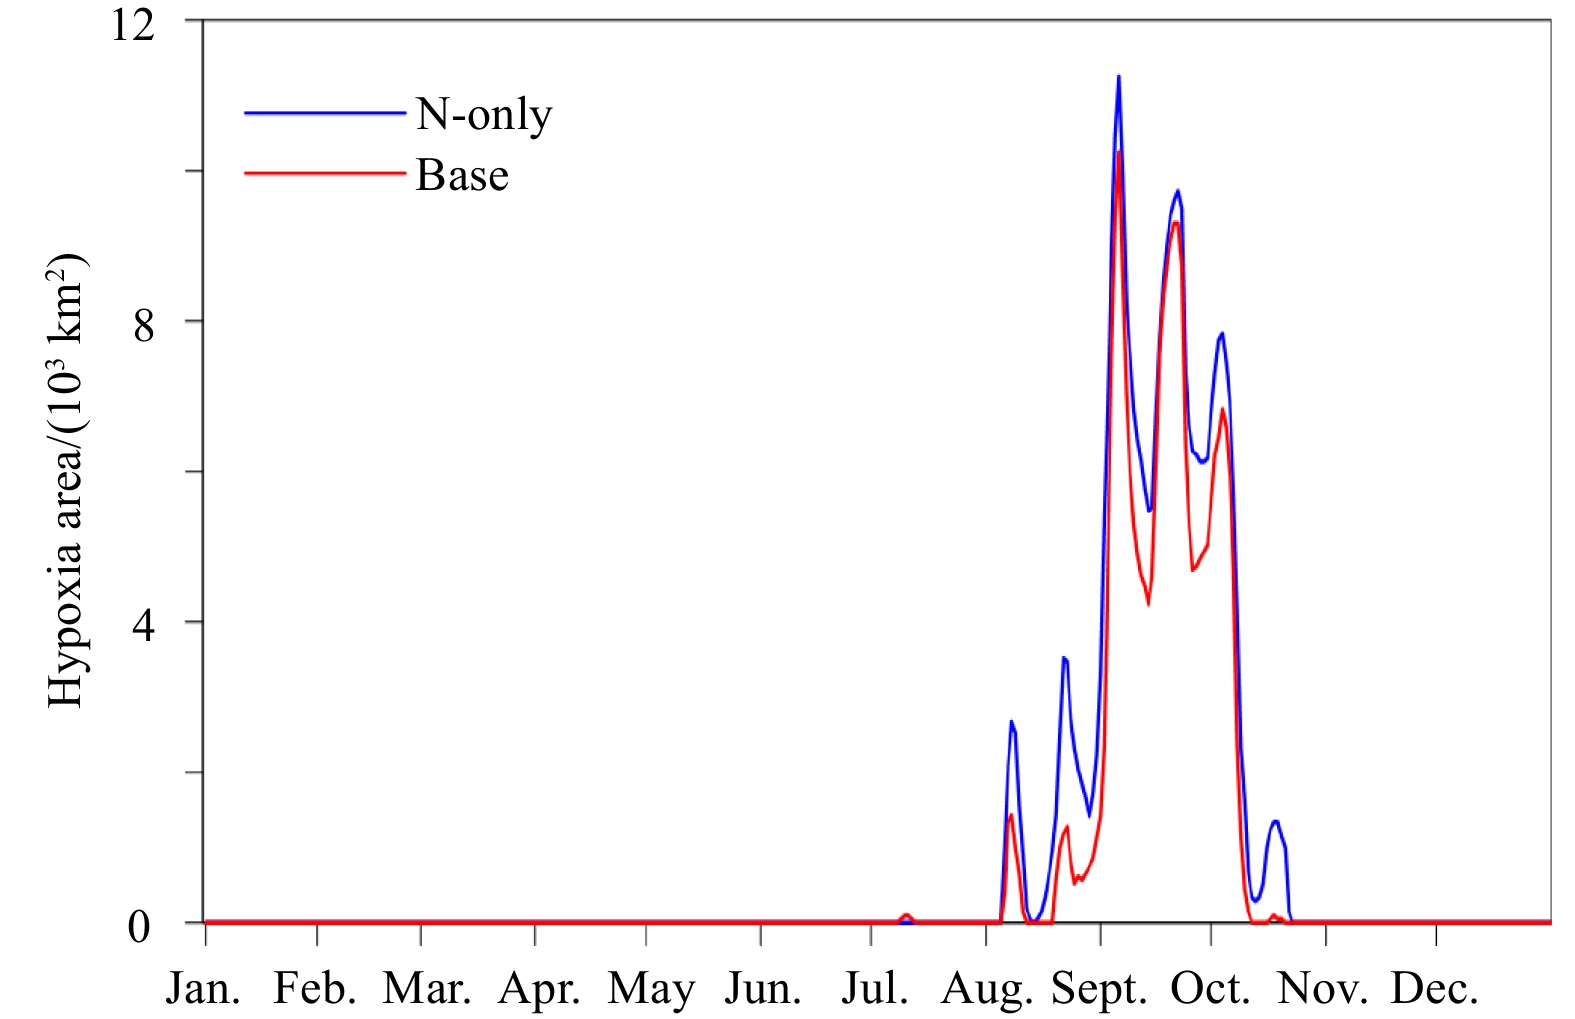
Figure 8. The simulated hypoxic area (DO concentration<2 mg/L) between the Base and N-only simulations.
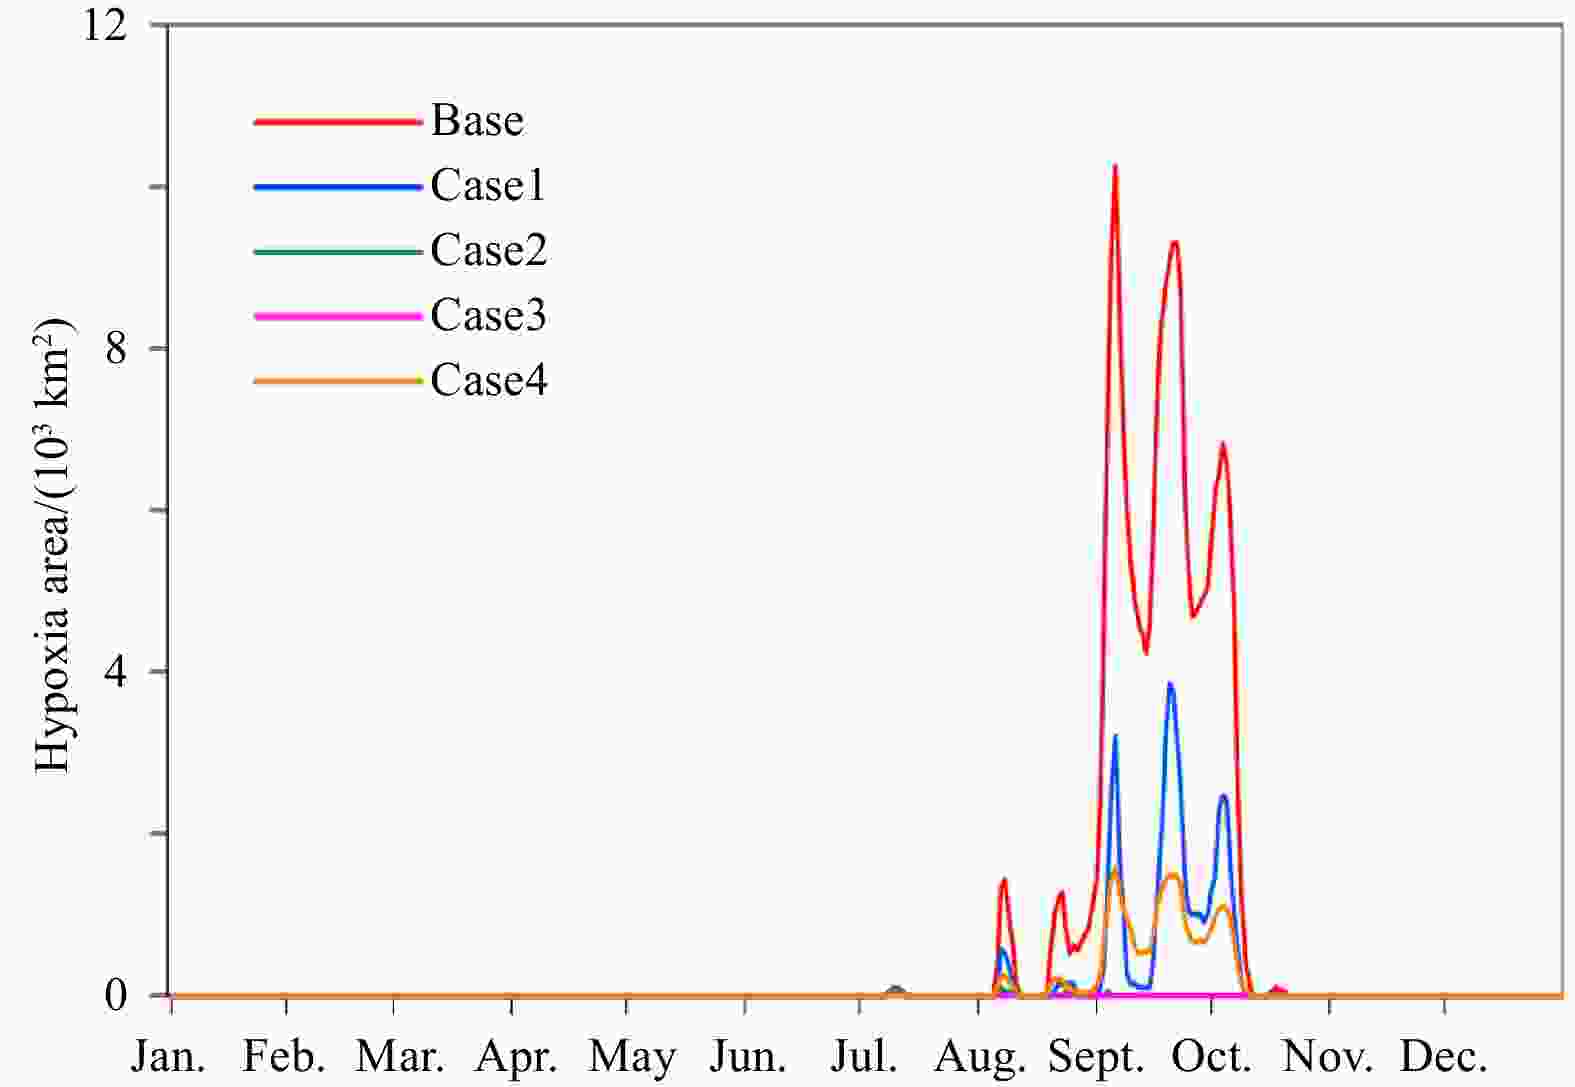
Figure 9. The comparison of the simulated hypoxic area (DO concentration<2 mg/L) among the sensitivity experiments.
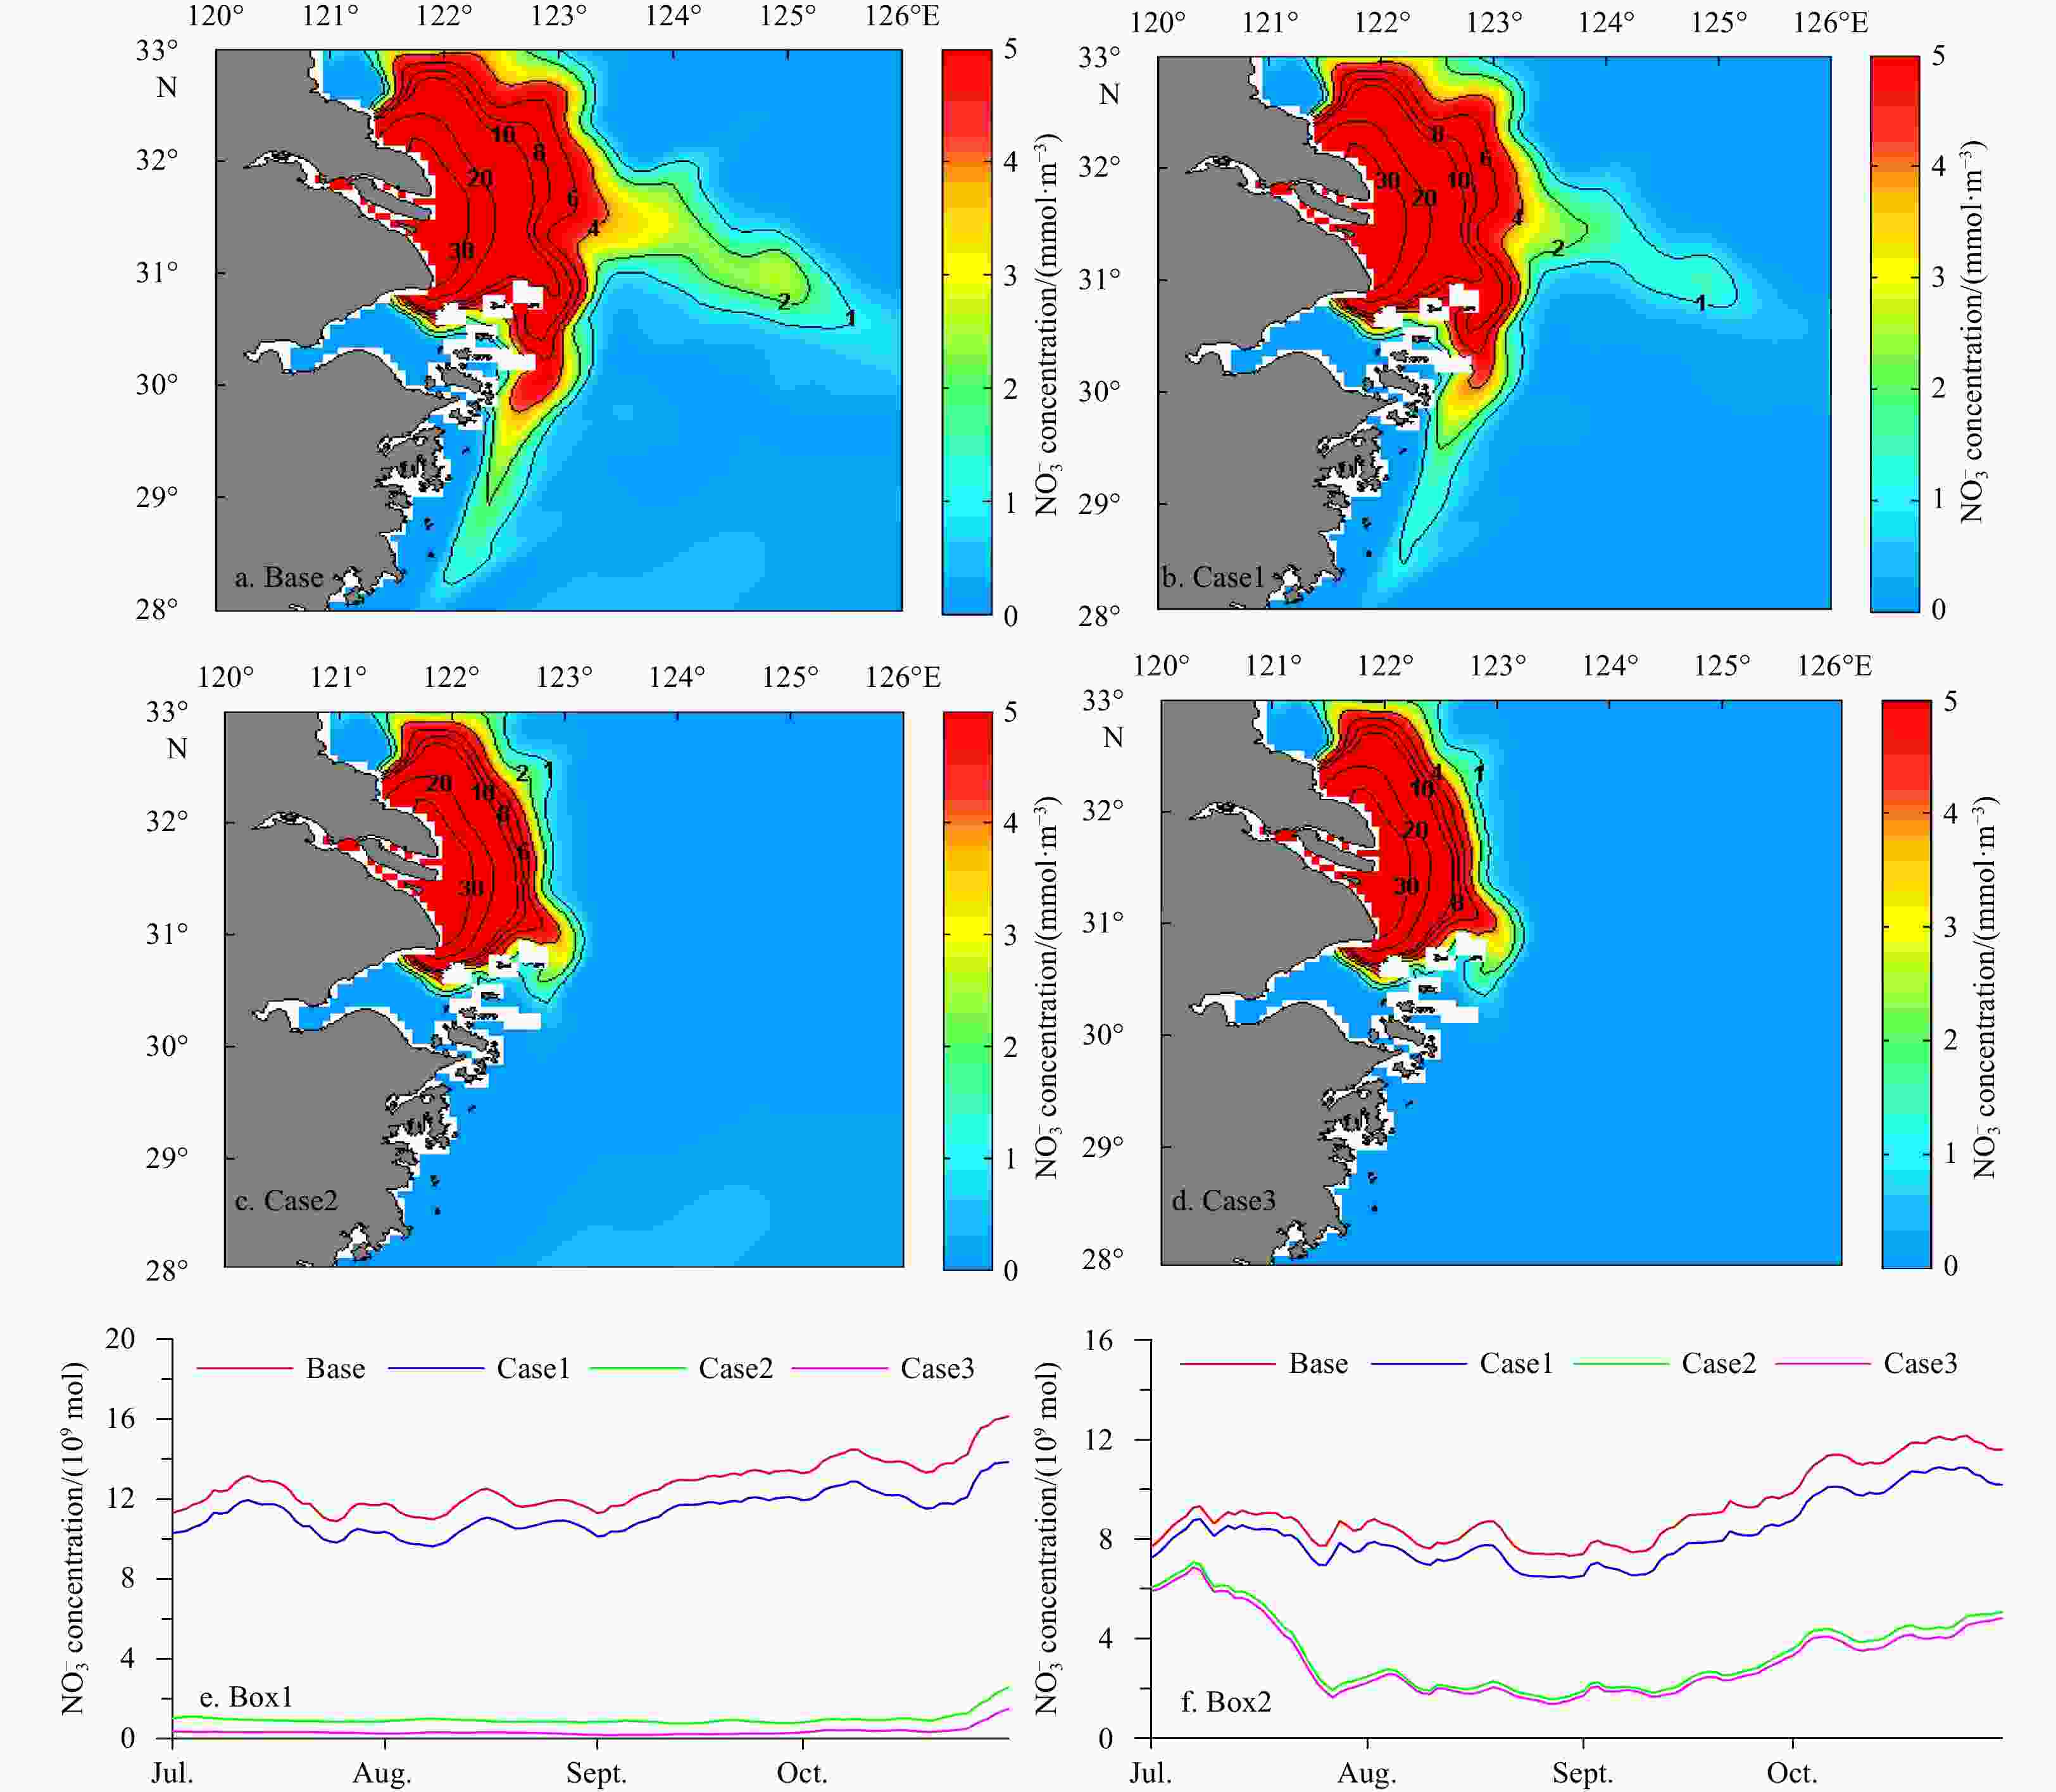
Figure 10. The monthly mean
${\rm{NO}}_3^- $ concentration distribution at the sea surface in September 2010 among the different sensitivity experiments (a−d). The total${\rm{NO}}_3^- $ amount in Box1 (e) and Box2 (f) (refer to Fig. 1b) from July to October, respectively.
Figure 11. The monthly mean
${\rm{PO}}_4^{3-} $ concentration distribution at the sea surface in September 2010 among the different sensitivity experiments (a−d); the total${\rm{PO}}_4^{3-} $ amount in Box1 (e) and Box2 (f) from July to October, respectively.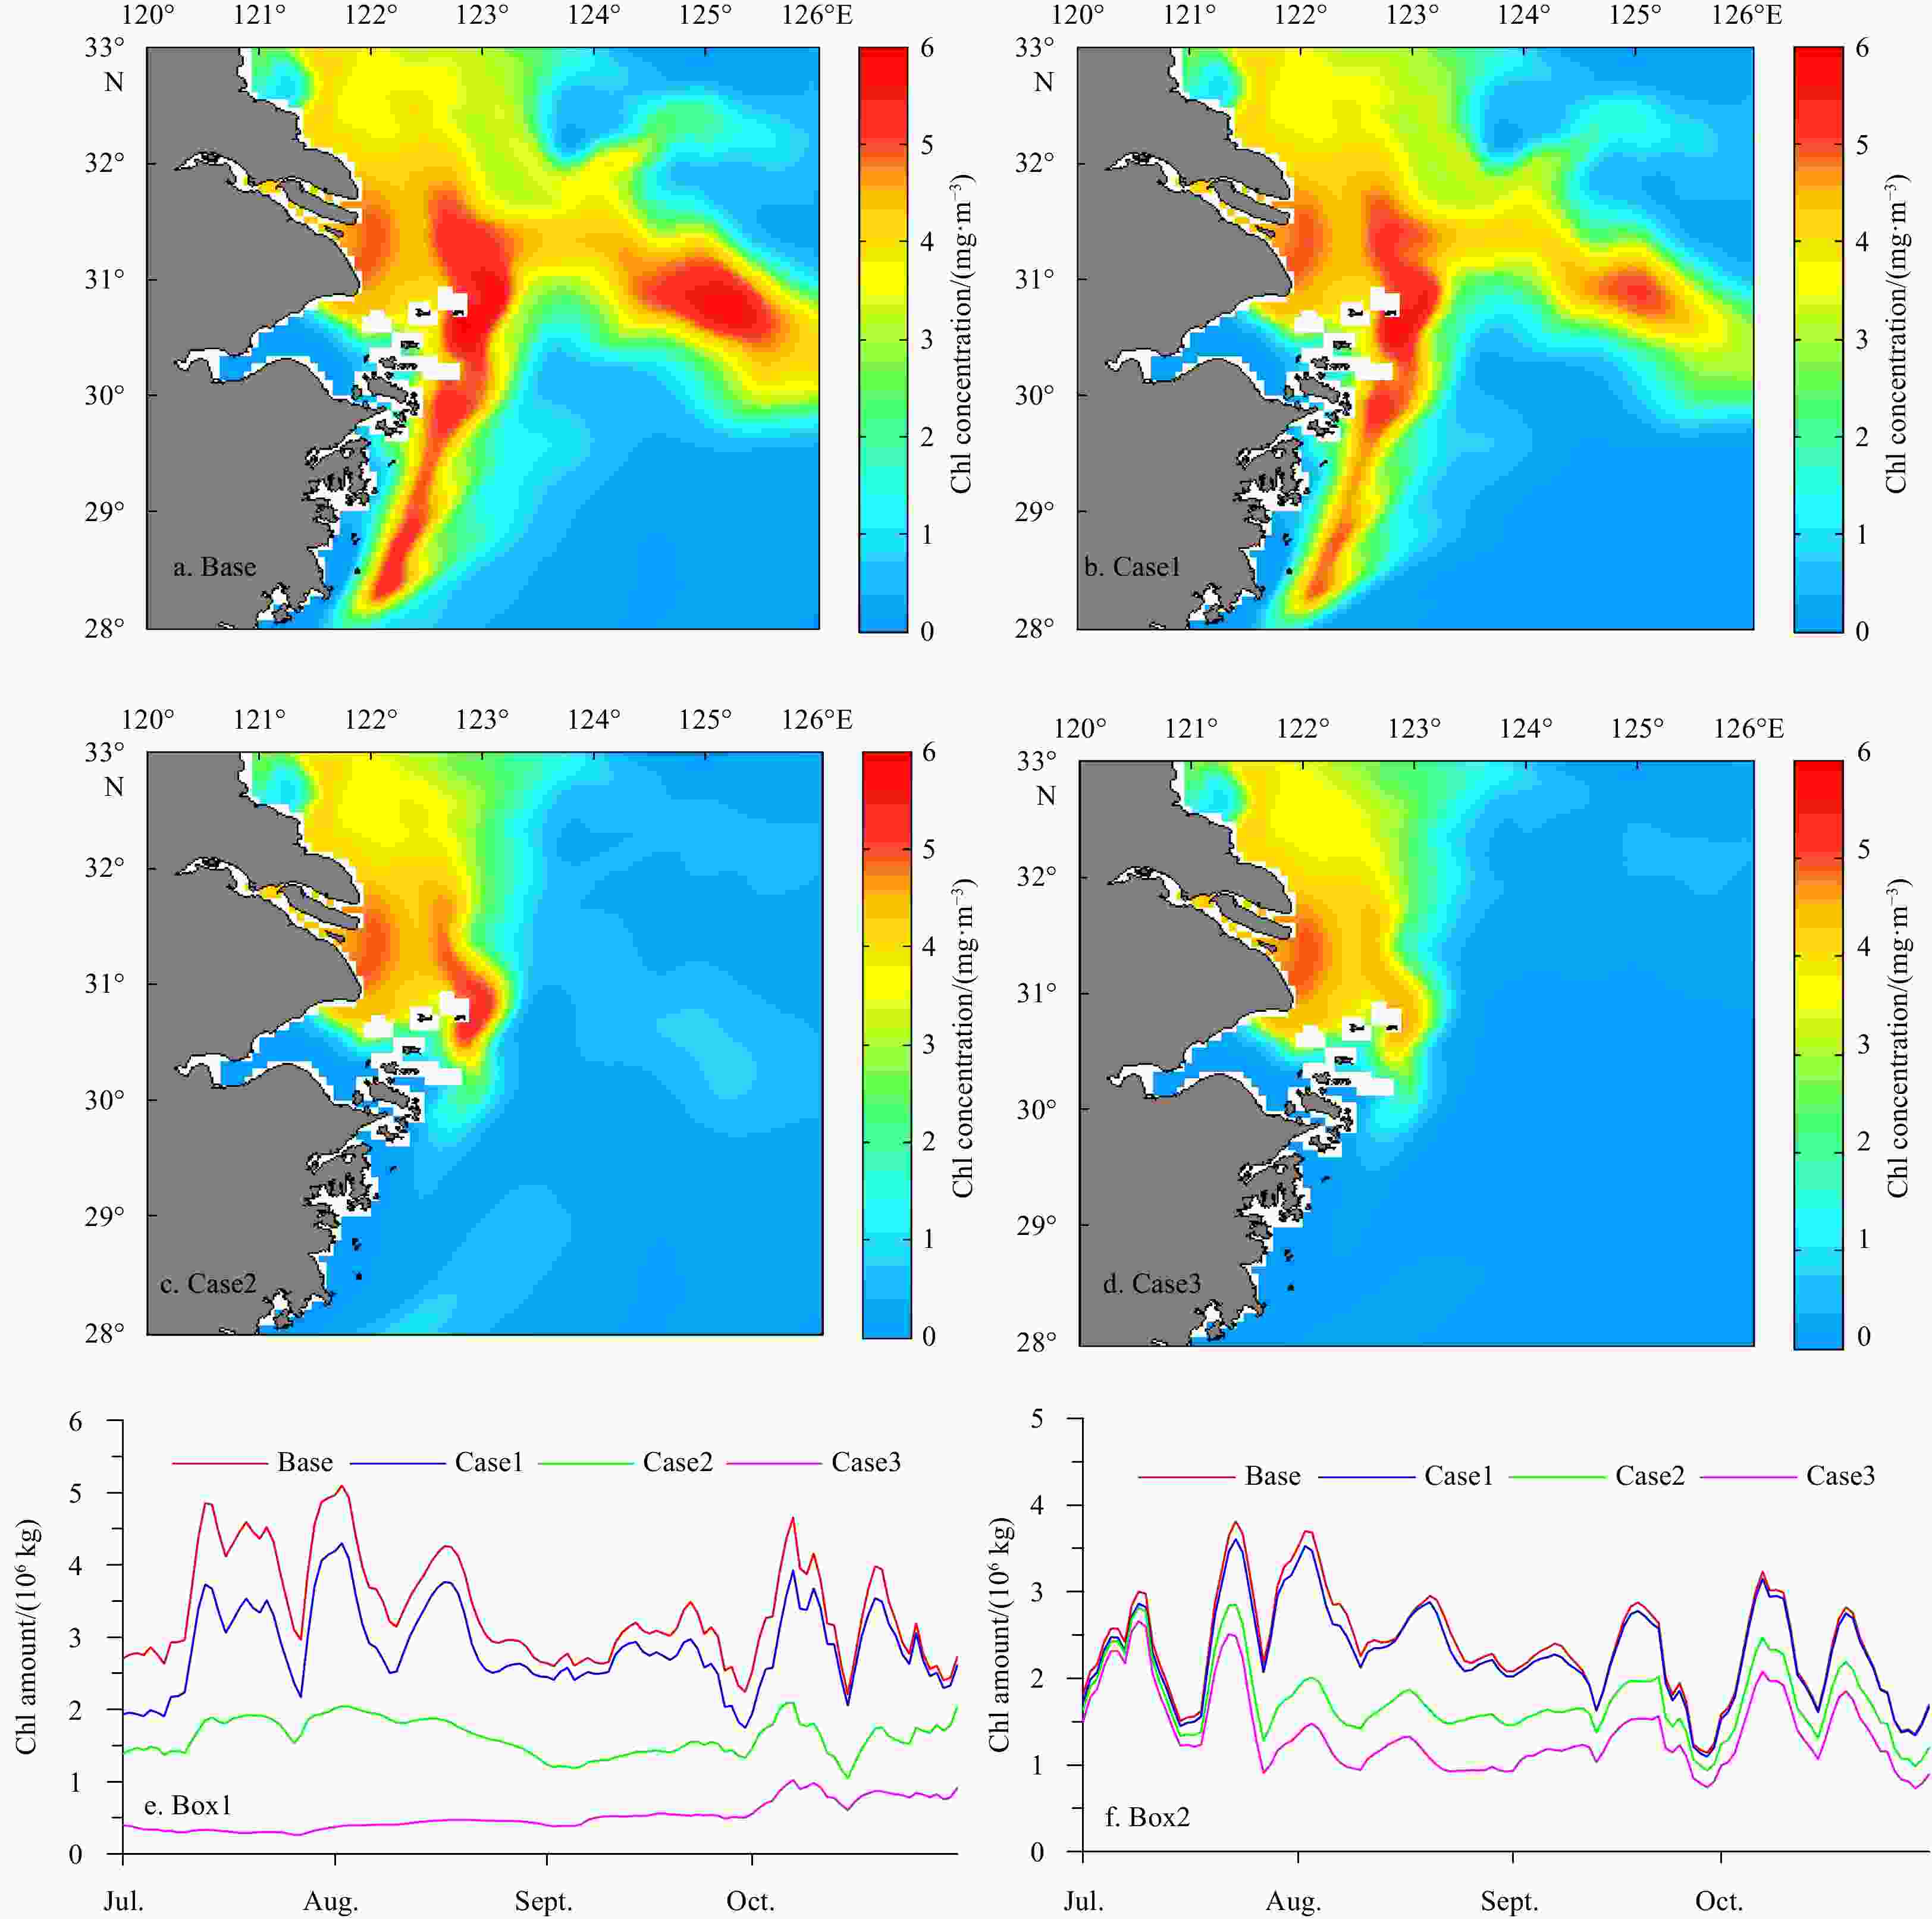
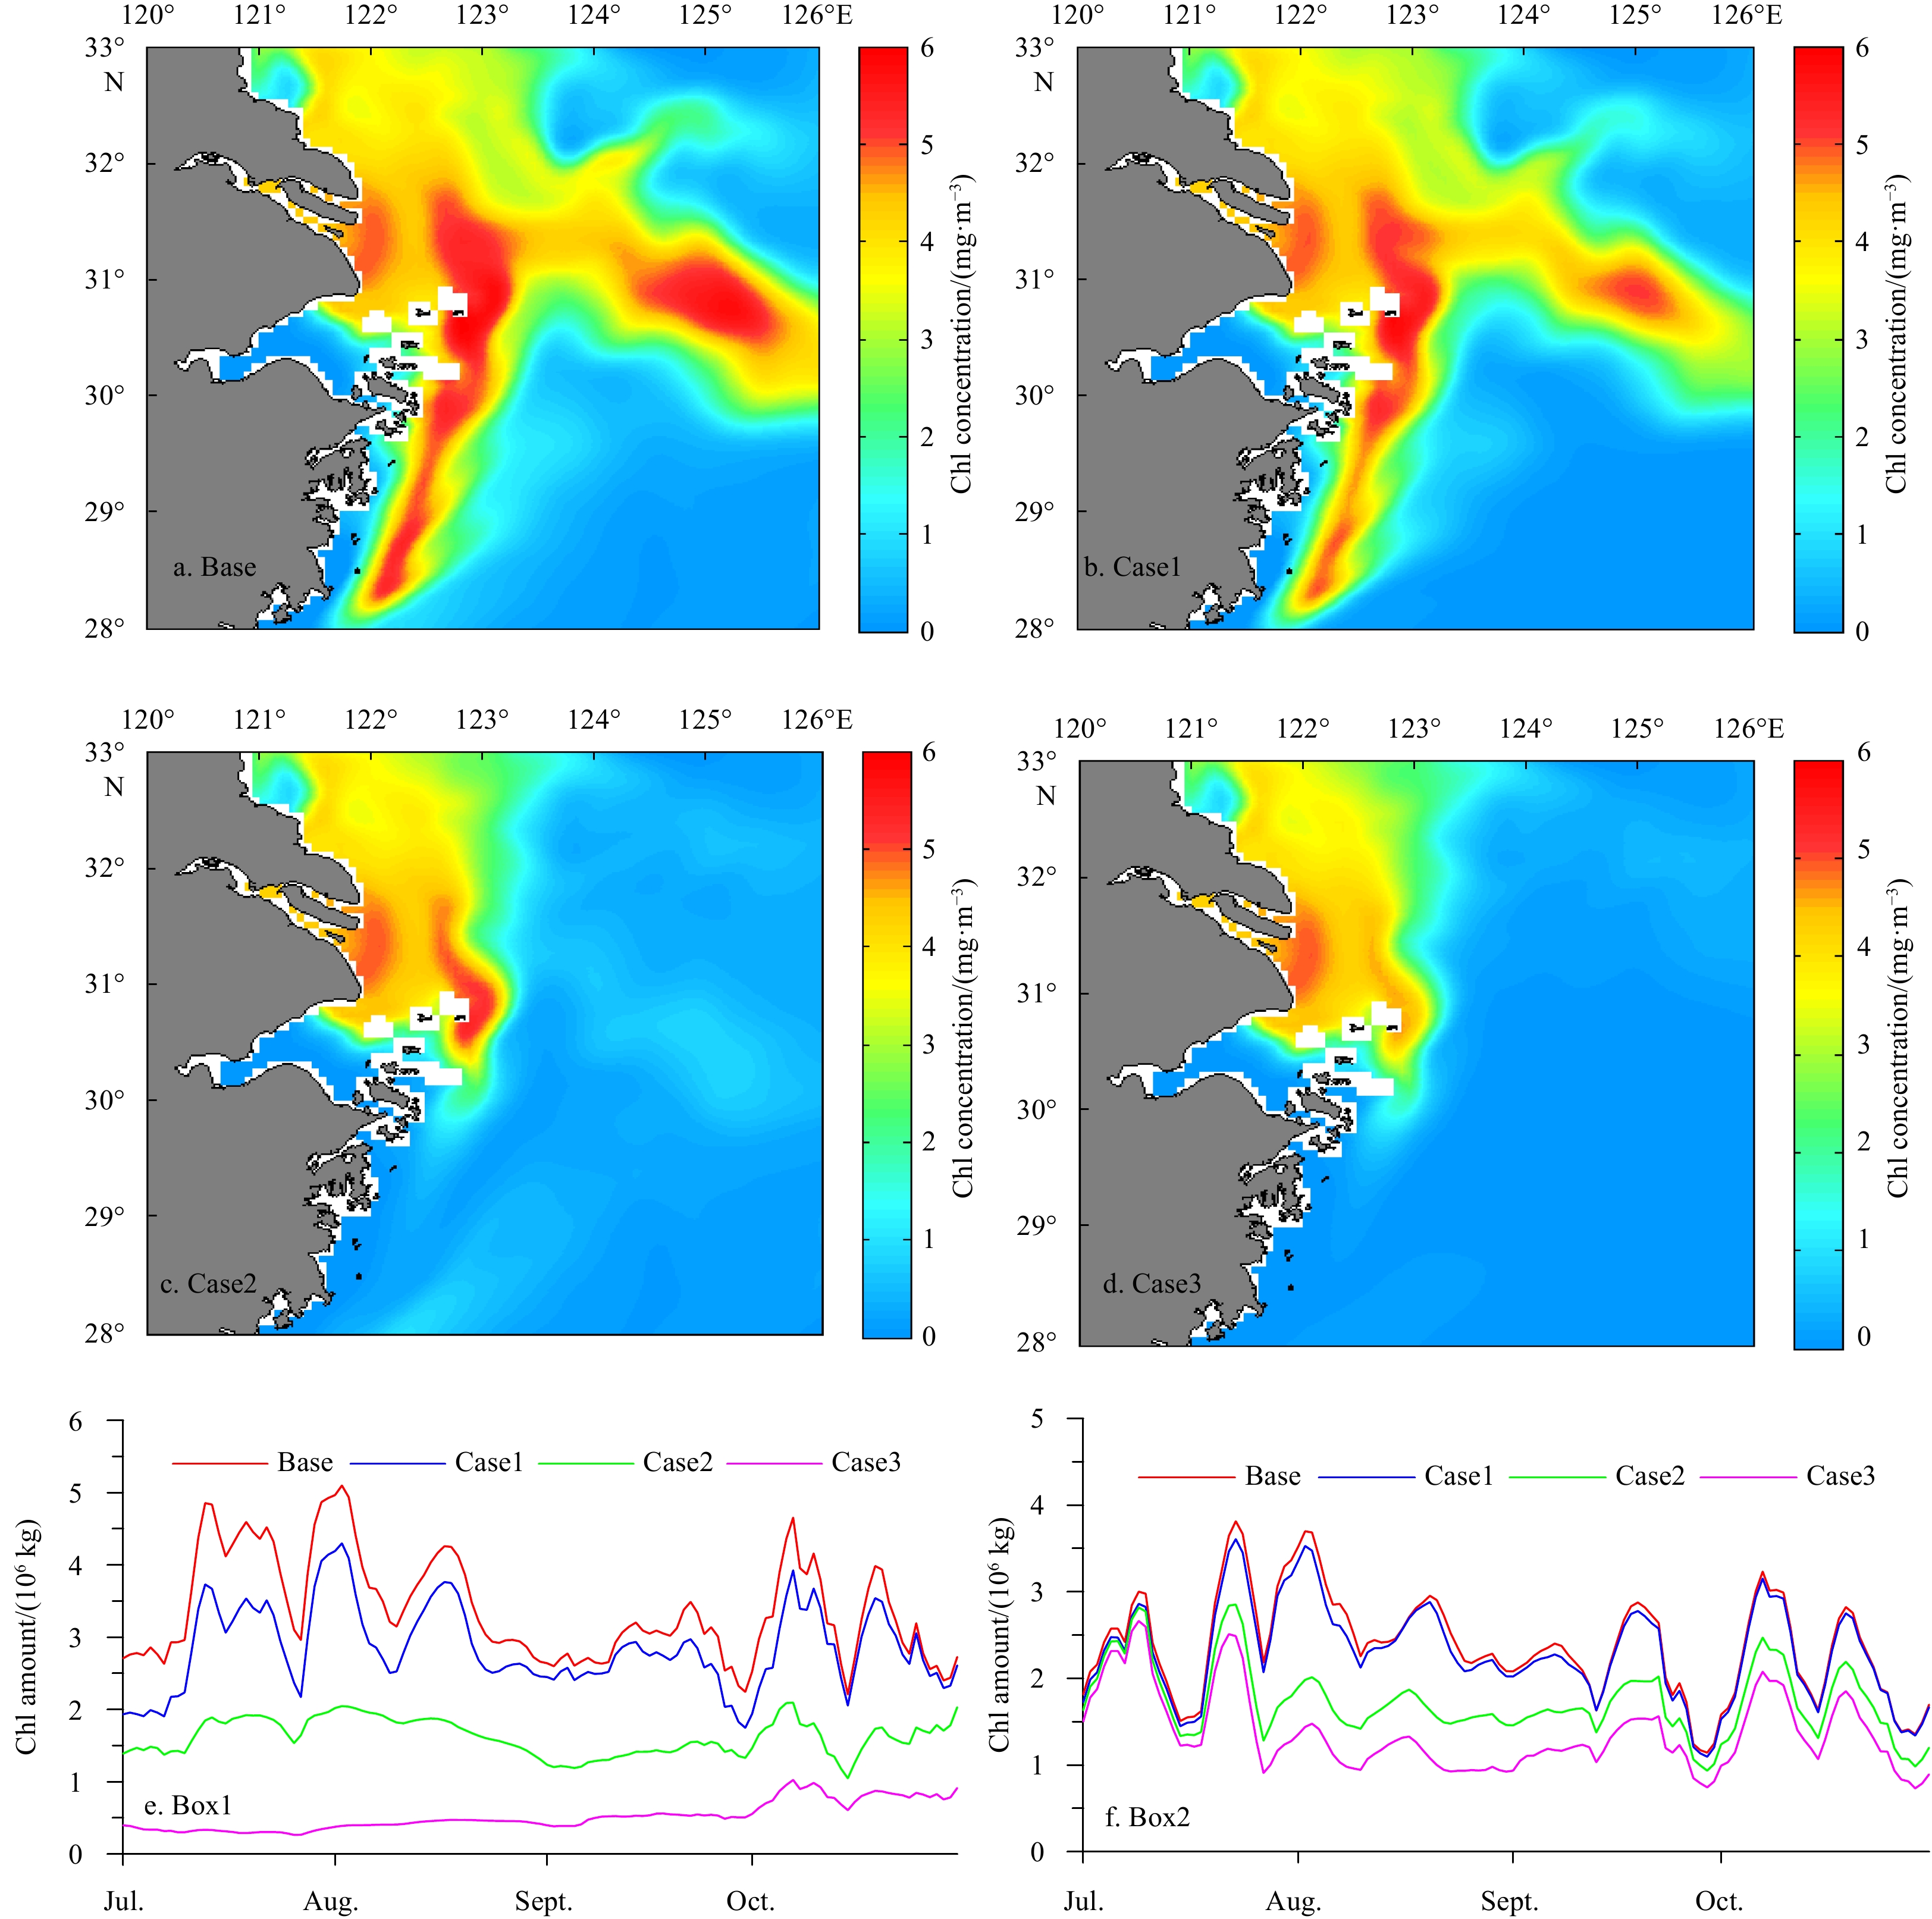
Figure 12. The monthly mean chlorophyll (Chl) distribution at the sea surface in September 2010 among the sensitivity experiments (a−d). The total Chl amount in Box1 (e) and Box2 (f) from July to October, respectively.
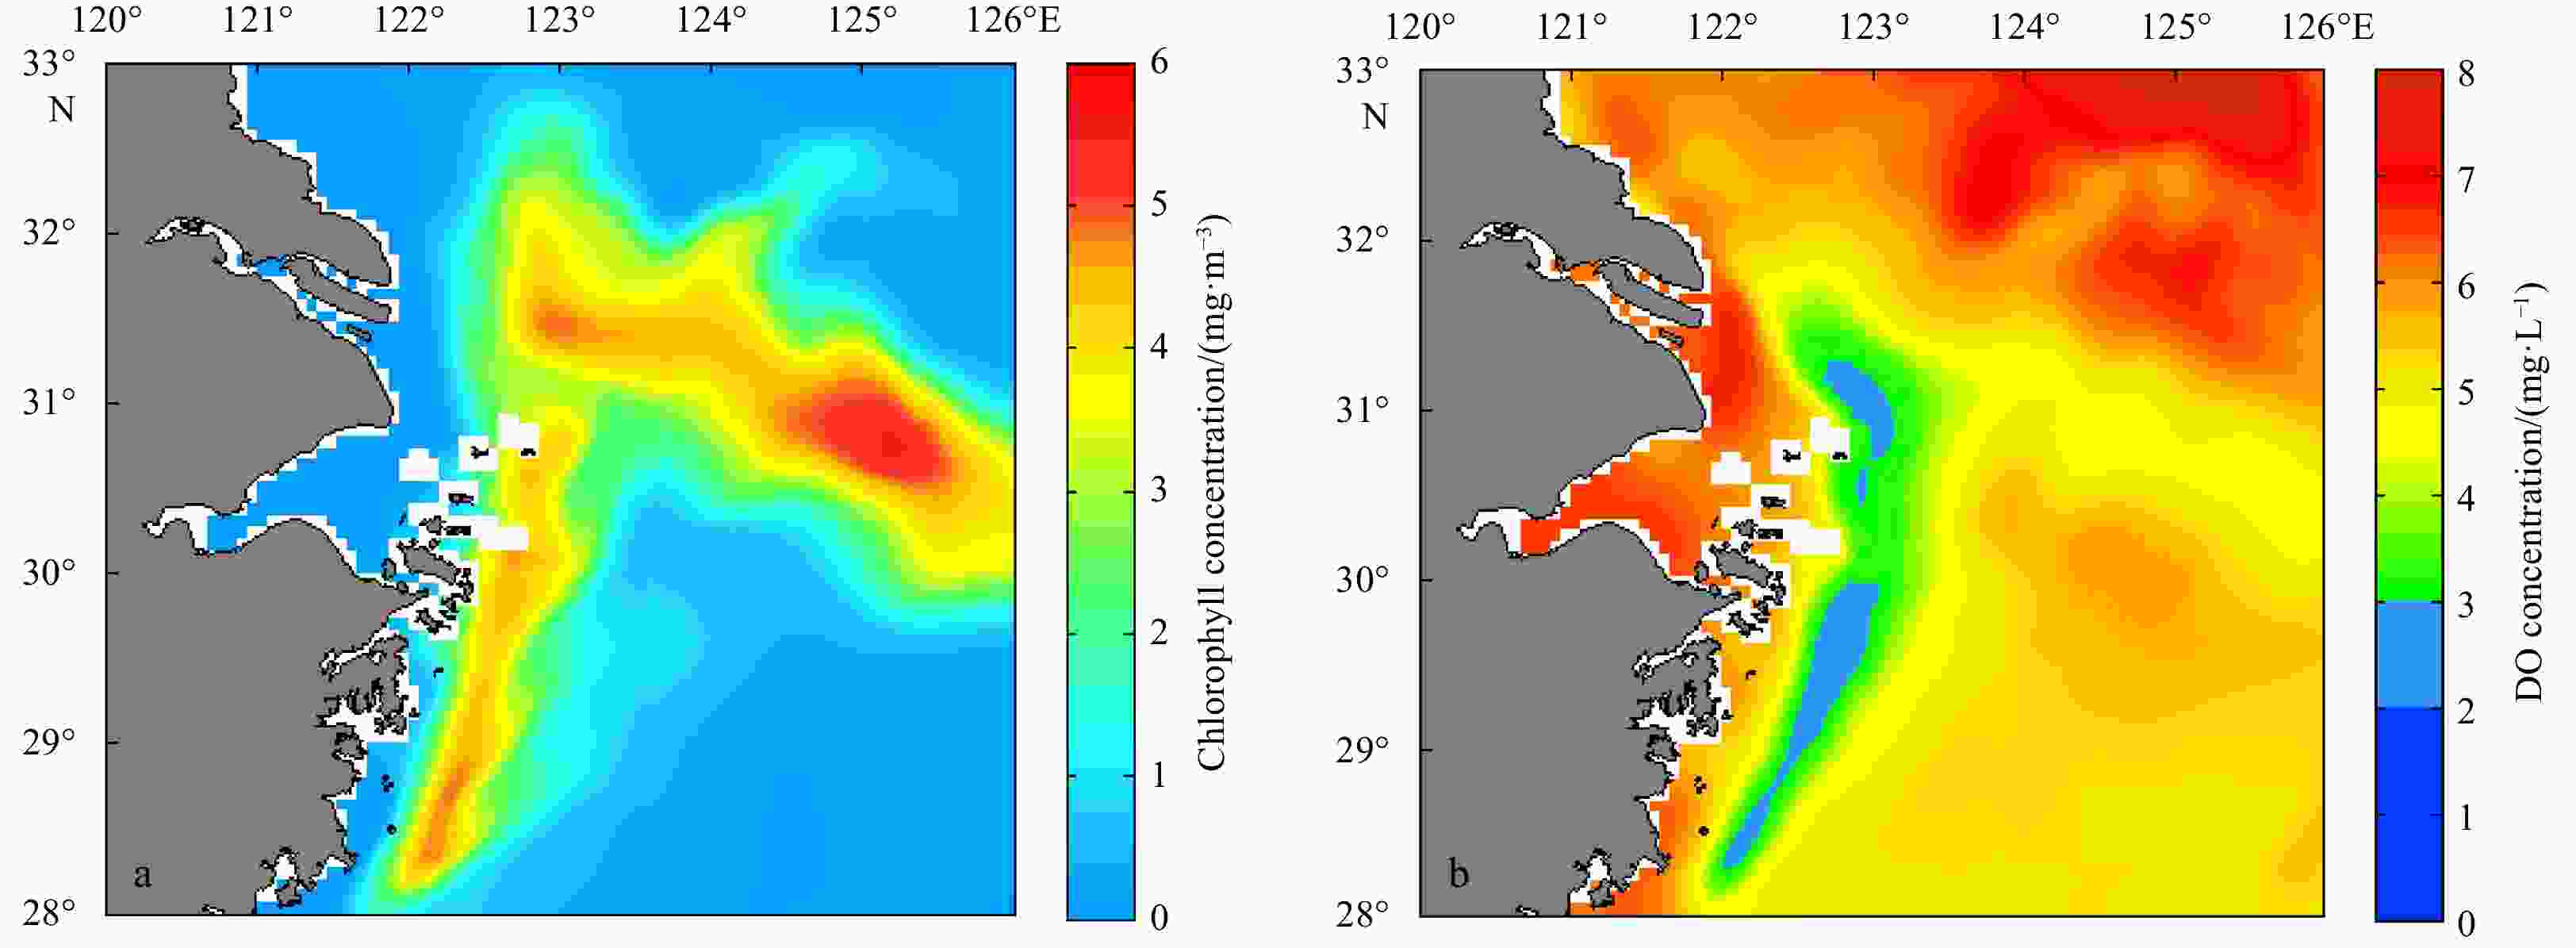
Figure 13. The monthly mean chlorophyll concentration distribution at the sea surface in September 2010 in Case4 (a); the monthly mean DO concentration distribution at the sea bottom in September 2010 in Case4 (b).
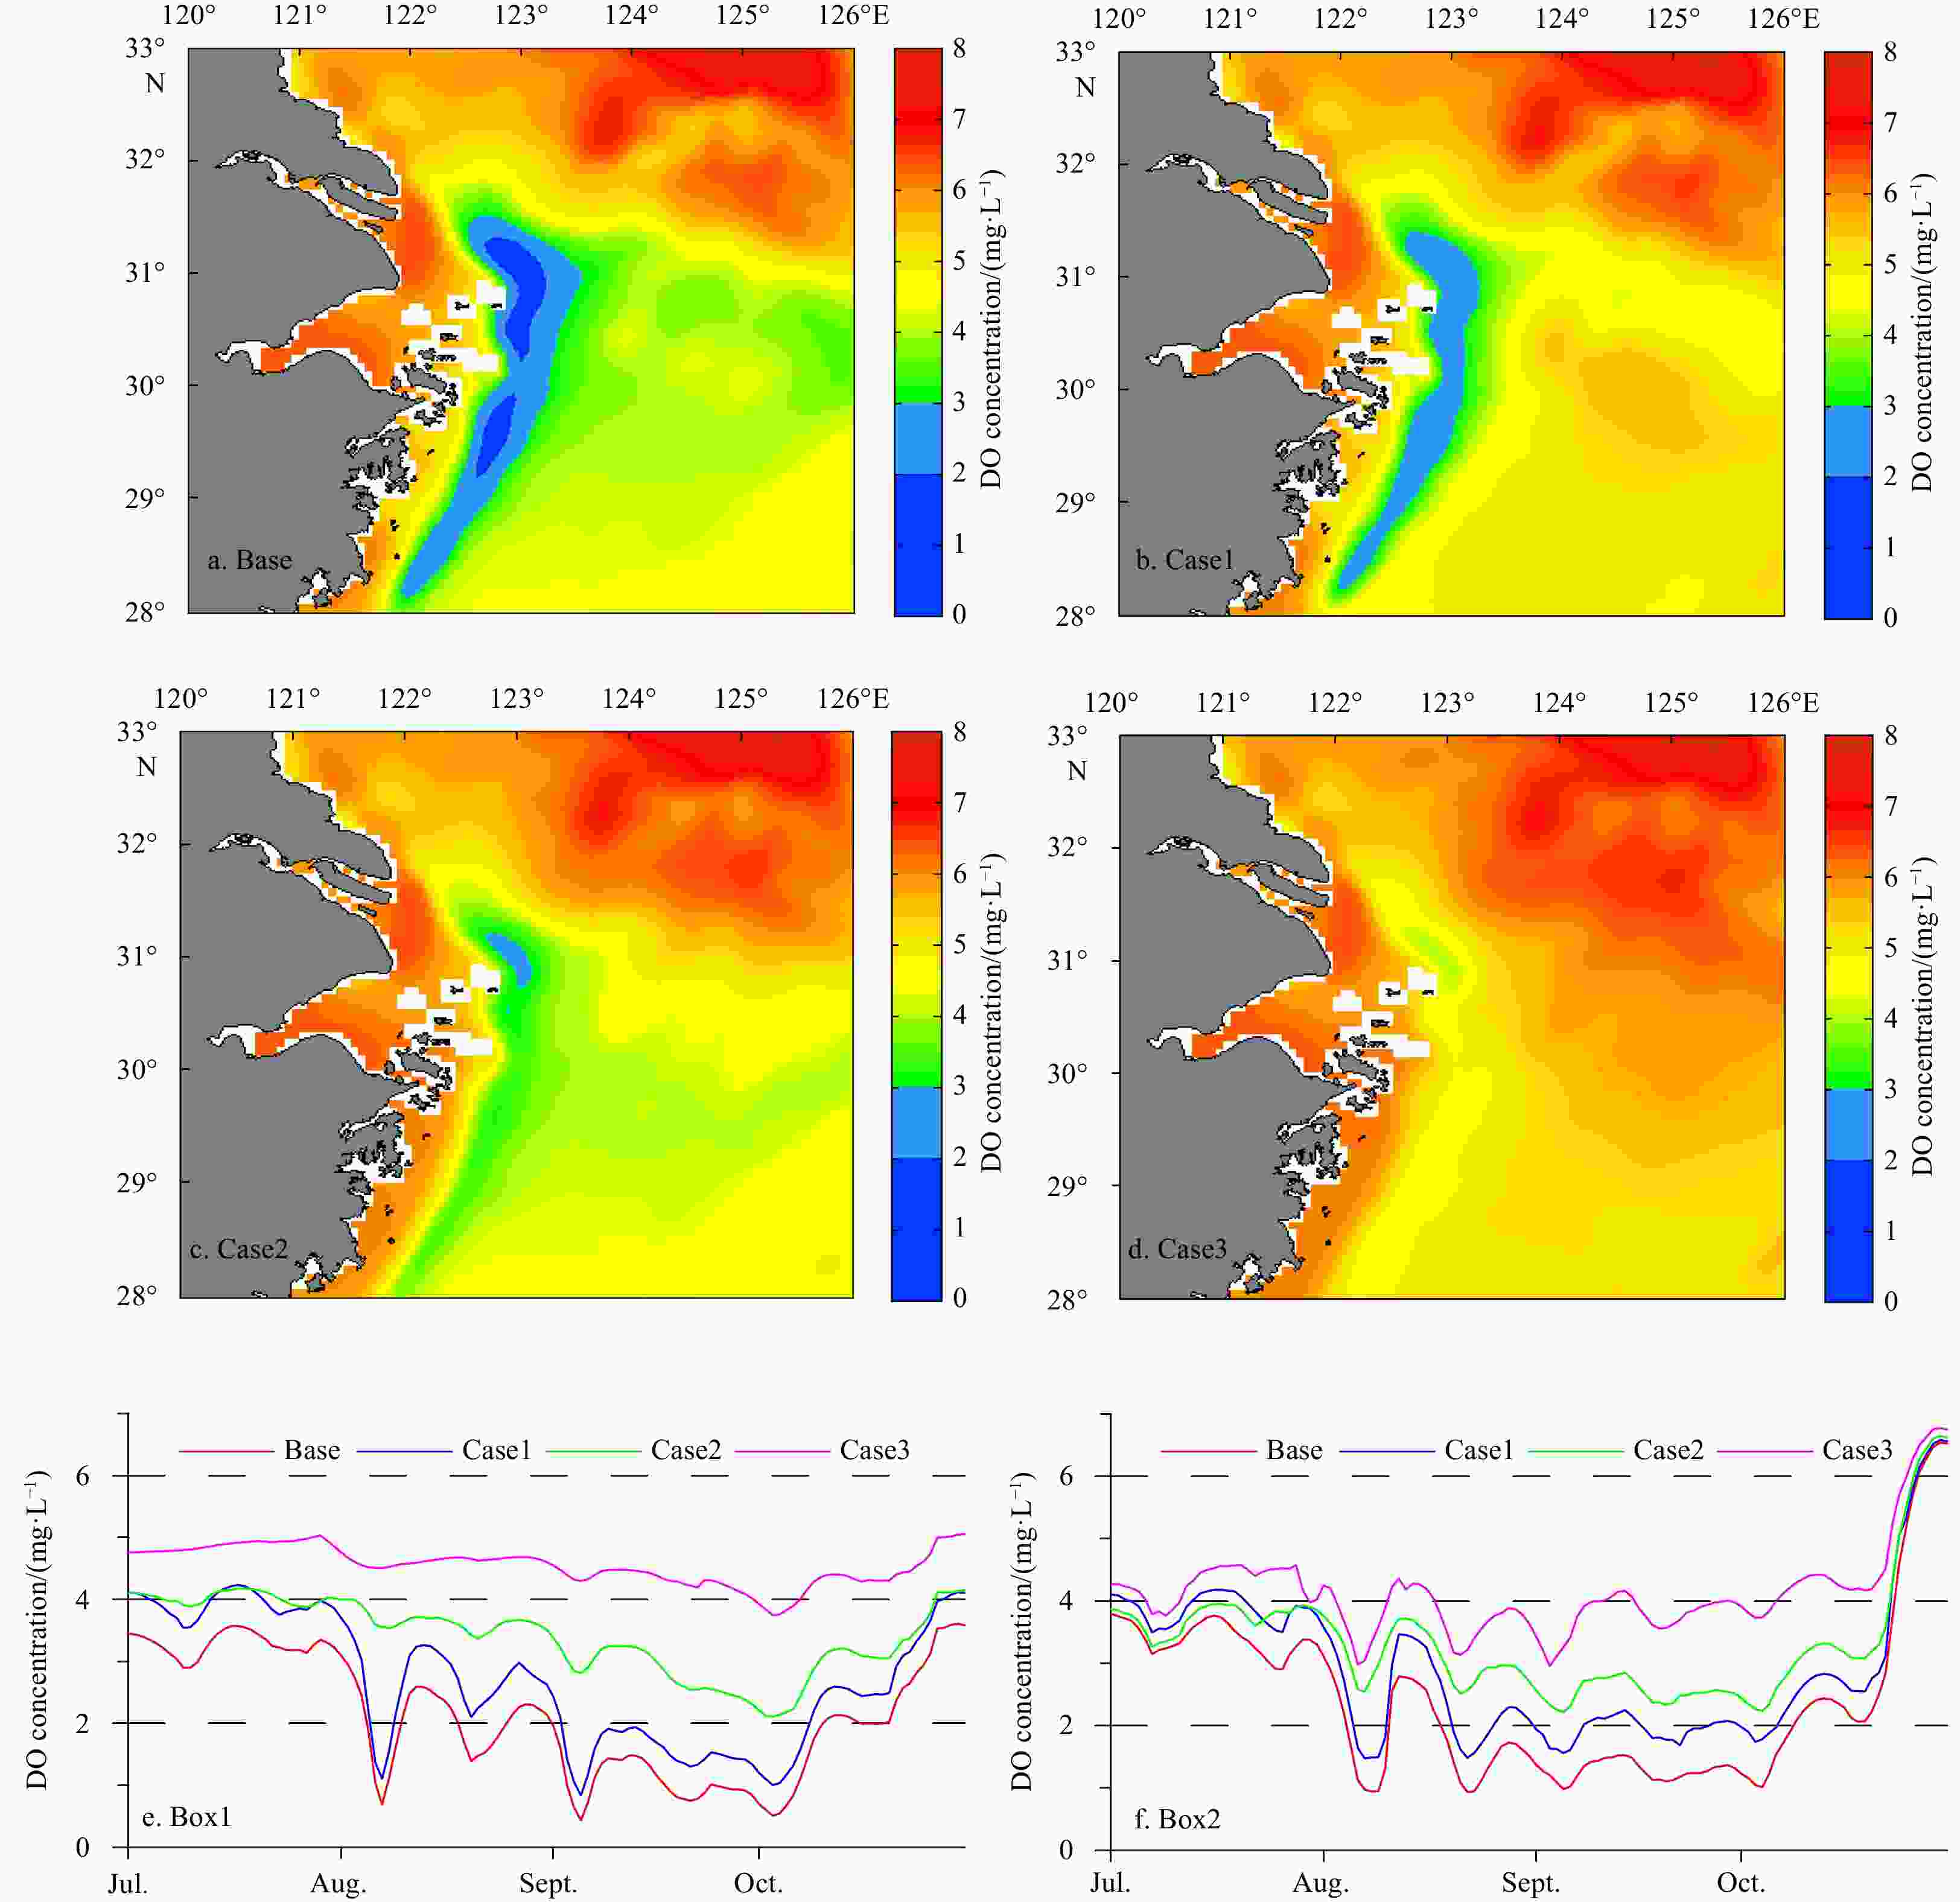
Figure 14. The monthly mean DO concentration distribution at the bottom in September 2010 among the sensitivity experiments (a−d). The minimum value of DO concentration at the sea bottom water in Box1 (e) and Box2 (f) from July to October, respectively.

Figure 15. The main ocean current pattern in the East China Sea in summer 2010 where the isobaths of 20 m, 50 m, 100 m, 200 m are overlapped. The blue arrows represent the Taiwan Warm Current (TWC); the yellow arrows represent the nearshore Kuroshio branch current (NKBC); and the black arrows represent the Changjiang diluted water (CDW). The upwelling is indicated by the pink cycle.
Table 1. The parameters used in ecosystem model
Parameter Value Unit Light attenuation by chlorophyll 0.024 86 m−1 Light attenuation due to seawater 0.04 (mg·m2)−1 (in terms of chlorophyll) half-saturation for phytoplankton ${\rm{NO}}_3^- $ uptake 0.5 mmol/m3 (in terms of N) half-saturation for phytoplankton ${\rm{NH}}_4^+ $ uptake 0.5 mmol/m3 (in terms of N) half-saturation for phytoplankton ${\rm{PO}}_4^{3-} $ uptake 0.03 mmol/m3 (in terms of P) Phytoplankton, initial slope of P-I curve 0.025 mol/(g·W·m2·d) (in terms of C) Phytoplankton growth rate 0.69 d−1 Zooplankton maximum growth rate 0.6 m3/(mmol·d) (in terms of N) Zooplankton half-saturation constant for ingestion 2 (mmol/m3)2 (in terms of N) Phytoplankton mortality rate 0.15 d−1 Maximum chlorophyll to carbon ratio 0.053 5 mg chlorophyll per mg C Nitrification rate: oxidation of ${\rm{NH}}_4^+ $ to ${\rm{NO}}_3^- $ 0.05 d−1 Half-saturation radiation for nitrification inhibition 0.1 W/m2 Radiation threshold for nitrification inhibition 0.009 5 W/m2 Zooplankton nitrogen assimilation efficiency 0.75 − Zooplankton mortality rate 0.025 d−1 Zooplankton basal metabolism 0.1 d−1 Zooplankton specific excretion rate 0.1 d−1 Large detritus remineralization rate N-fraction 0.1 d−1 Small detritus remineralization rate N-fraction 0.2 d−1 Large detritus remineralization rate C-fraction 0.1 d−1 Small detritus remineralization rate C-fraction 0.2 d−1 Coagulation rate 0.05 d−1 Vertical sinking velocity for phytoplankton 0.5 m/d Vertical sinking velocity for large detritus 5.0 m/d Vertical sinking velocity for small detritus 2.0 m/d Note: − represents no dimension.  下载: 导出CSV
Table 2. Model sensitivity experiment
Nutrients input source Base Changjiang River +Taiwan Strait + Kuroshio Case1 Changjiang River + Kuroshio Case2 Changjiang River + Taiwan Strait Case3 Changjiang River Case4 Kuroshio + Taiwan Strait
下载: 导出CSV
Table 3. The total area of hypoxic area under different thresholds of DO concentration
Experiment Integrated hypoxic area/(103 km2) <2 mg/L (hypoxia) <3 mg/L (Low DO) Base 250.1 1 021.6 Case1 55.4 (−77.8%) 499.2 (−51.1%) Case2 0.7 (−99.7%) 142.1 (−86.1%) Case3 0 (−100.0%) 3.3 (−99.7%) Case4 37.0 (−85.2%) 274.5 (−73.1%) Note: Low DO indicates dissolved oxygen concentration between 2 mg/L and 3 mg/L.
下载: 导出CSV
Table 4. The volume-averaged chlorophyll concentration (mg/L) in sensitivity experiments in September 2010
Region Base Case1 Case2 Case3 Case4 Box1
(southern region)1.54(100%) 1.37(89%) 0.48(31%) 0.18(12%) 1.36(88%) Box2
(northern region)3.24(100%) 3.12(96%) 2.48(77%) 2.20(68%) 1.89(58%)
下载: 导出CSV
Table 5. Integrated Low DO area (103 km2) in Box1 and Box2 in each experiment in 2010
Base Case1 Case2 Case3 Case4 Box1
(southern region)415(100%) 227(55%) 41(10%) 0(0%) 178(43%) Box2
(northern region)555(100%) 264(48%) 90(16%) 2(0%) 90(16%) Note: Low DO indicates dissolved oxygen concentration between 2 mg/L and 3 mg/L.
下载: 导出CSV
-
Boesch D F, Rabalais N N. 1991. Effects of hypoxia on continental shelf benthos: comparisons between the New York Bight and the Northern Gulf of Mexico. Geological Society, London, Special Publications, 58(1): 27–34, Carnes M R. 2009. Description and Evaluation of GDEM-V 3.0. Washington: Naval Research Laboratory, Stennis Space Center Chang P H, Isobe A. 2003. A numerical study on the Changjiang diluted water in the Yellow and East China Seas. Journal of Geophysical Research: Oceans, 108(C9): 3299. doi: 10.1029/2002JC001749 Chen Chen-Tung Arthur. 1996. The Kuroshio intermediate water is the major source of nutrients on the East China Sea continental shelf. Oceanologica Acta, 19(5): 523–527 Chen Yuh-Ling Lee, Chen Houng-Yung, Gong Gwo-Ching, et al. 2004. Phytoplankton production during a summer coastal upwelling in the East China Sea. Continental Shelf Research, 24(12): 1321–1338. doi: 10.1016/j.csr.2004.04.002 Chen Chung-Chi, Chiang Kuo-Ping, Gong Gwo-Ching, et al. 2006. Importance of planktonic community respiration on the carbon balance of the East China Sea in summer. Global Biogeochemical Cycles, 20: GB4001. doi: 10.1029/2005GB002647 Chen ChungChi, Gong GwoChing, Shiah F K. 2007. Hypoxia in the East China Sea: one of the largest coastal low-oxygen areas in the world. Marine Environmental Research, 64(4): 399–408. doi: 10.1016/j.marenvres.2007.01.007 Chen Yaxin, Liu Ruimin, Sun Chengchun, et al. 2012. Spatial and temporal variations in nitrogen and phosphorous nutrients in the Yangtze River Estuary. Marine Pollution Bulletin, 64(10): 2083–2089. doi: 10.1016/j.marpolbul.2012.07.020 Chen Jianyu, Pan Delu, Liu Mingliang, et al. 2017. Relationships between long-term trend of satellite-derived chlorophyll-a and hypoxia off the Changjiang Estuary. Estuaries and Coasts, 40(4): 1055–1065. doi: 10.1007/s12237-016-0203-0 Chen Chen-Tung Arthur, Wang Shulun, 1999. Carbon, alkalinity and nutrient budgets on the East China Sea continental shelf. Journal of Geophysical Research: Oceans, 104(C9): 20675–20686, Diaz R J, Rosenberg R. 1995. Marine benthic hypoxia: a review of its ecological effects and the behavioural responses of benthic macrofauna. Oceanography and Marine Biology, 33: 245–303 Diaz R J, Rosenberg R. 2008. Spreading dead zones and consequences for marine ecosystems. Science, 321(5891): 926–929. doi: 10.1126/science.1156401 Egbert G D, Erofeeva S Y. 2002. Efficient inverse modeling of barotropic ocean tides. Journal of Atmospheric and Oceanic Technology, 19(2): 183–204. doi: 10.1175/1520-0426(2002)019<0183:EIMOBO>2.0.CO;2 Fang Tien-Hsi. 2004. Phosphorus speciation and budget of the East China Sea. Continental Shelf Research, 24(12): 1285–1299. doi: 10.1016/j.csr.2004.04.003 Fennel K, Hu Jiatang, Laurent A, et al. 2013. Sensitivity of hypoxia predictions for the northern Gulf of Mexico to sediment oxygen consumption and model nesting. Journal of Geophysical Research: Oceans, 118(2): 990–1002. doi: 10.1002/jgrc.20077 Fennel K, Wilkin J, Levin J, et al. 2006. Nitrogen cycling in the Middle Atlantic Bight: results from a three-dimensional model and implications for the North Atlantic nitrogen budget. Global Biogeochemical Cycles, 20(3): GB3007. doi: 10.1029/2005GB002456 Gao Lei, Li Daoji, Zhang Yanwei. 2012. Nutrients and particulate organic matter discharged by the Changjiang (Yangtze River): seasonal variations and temporal trends. Journal of Geophysical Research: Biogeosciences, 117(G4): G04001. doi: 10.1029/2012JG001952 Gong Gwo-Ching, Chen Yuh-Ling Lee, Liu Kon-Kee. 1996. Chemical hydrography and chlorophyll a distribution in the East China Sea in summer: implications in nutrient dynamics. Continental Shelf Research, 16(12): 1561–1590. doi: 10.1016/0278-4343(96)00005-2 Große F, Fennel K, Zhang Haiyan, et al. 2020. Quantifying the contributions of riverine vs. oceanic nitrogen to hypoxia in the East China Sea. Biogeosciences, 17(10): 2701–2714. doi: 10.5194/bg-17-2701-2020 Hu Jianyu, Kawamura H, Li Chunyan, et al. 2010. Review on current and seawater volume transport through the Taiwan Strait. Journal of Oceanography, 66(5): 591–610. doi: 10.1007/s10872-010-0049-1 Isobe A. 2008. Recent advances in ocean-circulation research on the Yellow Sea and East China Sea shelves. Journal of Oceanography, 64(4): 569–584. doi: 10.1007/s10872-008-0048-7 Karlson K, Rosenberg R, Bonsdorff E. 2002. Temporal and spatial large-scale effects of eutrophication and oxygen deficiency on benthic fauna in Scandinavian and Baltic waters—a review. Oceanography and Marine Biology: An Annual Review, 40: 427–489 Li Hongliang, Chen Jianfang, Lu Yunke, et al. 2011. Seasonal variation of DO and formation mechanism of bottom water hypoxia of Changjiang River Estuary. Journal of Marine Sciences, 29(3): 78–87 Li Hongmei, Shi Xiaoyong, Wang Hao, et al. 2014. An estimation of nutrient fluxes to the East China Sea continental shelf from the Taiwan Strait and Kuroshio subsurface waters in summer. Acta Oceanologica Sinica, 33(11): 1–10. doi: 10.1007/s13131-014-0550-2 Liu Xincheng, Shen Huanting, Huang Qinghui. 2002. Concentration variation and flux estimation of dissolved inorganic nutrient from the Changjiang River into its estuary. Oceanologia et Limnologia Sinica, 33(3): 332–340 Liu Kon-Kee, Tang TswenYung, Gong Gwo-Ching, et al. 2000. Cross-shelf and along-shelf nutrient fluxes derived from flow fields and chemical hydrography observed in the southern East China Sea off Northern Taiwan. Continental Shelf Research, 20(4−5): 493–523. doi: 10.1016/S0278-4343(99)00083-7 Liu Kon-Kee, Yan Weijin, Lee Hung-Jen, et al. 2015. Impacts of increasing dissolved inorganic nitrogen discharged from Changjiang on primary production and seafloor oxygen demand in the East China Sea from 1970 to 2002. Journal of Marine Systems, 141: 200–217. doi: 10.1016/j.jmarsys.2014.07.022 Lu Wenhai, Xiang Xianquan, Yang Lu, et al. 2017. The temporal-spatial distribution and changes of dissolved oxygen in the Changjiang Estuary and its adjacent waters for the last 50 a. Acta Oceanologica Sinica, 36(5): 90–98. doi: 10.1007/s13131-017-1063-6 Morel A, Berthon J F. 1989. Surface pigments, algal biomass profiles, and potential production of the euphotic layer: relationships reinvestigated in view of remote-sensing applications. Limnology and Oceanography, 34(8): 1545–1562. doi: 10.4319/lo.1989.34.8.1545 Ning Xiuren, Lin Chuanlan, Su Jilan, et al. 2011. Long-term changes of dissolved oxygen, hypoxia, and the responses of the ecosystems in the East China Sea from 1975 to 1995. Journal of Oceanography, 67(1): 59–75. doi: 10.1007/s10872-011-0006-7 Rabalais N N, Díaz R J, Levin L A, et al. 2010. Dynamics and distribution of natural and human-caused hypoxia. Biogeosciences, 7(2): 585–619. doi: 10.5194/bg-7-585-2010 Renaud M L. 1986. Hypoxia in Louisiana coastal waters during 1983: implications for fisheries. Fishery Bulletin, 84(1): 19–26 Wang Baodong. 2009. Hydromorphological mechanisms leading to hypoxia off the Changjiang Estuary. Marine Environmental Research, 67(1): 53–58. doi: 10.1016/j.marenvres.2008.11.001 Wang Kui, Cai Weijun, Chen Jianfang, et al. 2021. Climate and human-driven variability of summer hypoxia on a large river-dominated shelf as revealed by a hypoxia index. Frontiers in Marine Science, 8: 634184. doi: 10.3389/fmars.2021.634184 Wang Wentao, Cao Xihua, Yuan Yongquan, et al. 2016. Variation and controlling factor of nutrient distribution in Changjiang River Estuary and adjacent areas in 2012. Oceanologia et Limnologia Sinica, 47(4): 804–812. doi: 10.11693/hyhz20160100017 Wang Baodong, Wei Qinsheng, Chen Jianfang, et al. 2012. Annual cycle of hypoxia off the Changjiang (Yangtze River) Estuary. Marine Environmental Research, 77: 1–5. doi: 10.1016/j.marenvres.2011.12.007 Wang Jianing, Yan Weijin, Chen Nengwang, et al. 2015. Modeled long-term changes of DIN: DIP ratio in the Changjiang River in relation to Chl-α and DO concentrations in adjacent estuary. Estuarine, Coastal and Shelf Science, 166: 153–160, Wei Hao, He Yunchang, Li Qingji, et al. 2007. Summer hypoxia adjacent to the Changjiang Estuary. Journal of Marine Systems, 67(3−4): 292–303. doi: 10.1016/j.jmarsys.2006.04.014 Wei Qinsheng, Wang Baodong, Chen Jianfang, et al. 2015. Recognition on the forming-vanishing process and underlying mechanisms of the hypoxia off the Yangtze River estuary. Science China: Earth Sciences, 58(4): 628–648. doi: 10.1007/s11430-014-5007-0 Xu Lingjing, Yang Dezhou, Benthuysen J A, et al. 2018. Key dynamical factors driving the Kuroshio subsurface water to reach the Zhejiang coastal area. Journal of Geophysical Research: Oceans, 123(12): 9061–9081. doi: 10.1029/2018JC014219 Xu Lingjing, Yang Dezhou, Greenwood J, et al. 2020. Riverine and oceanic nutrients govern different algal bloom domain near the Changjiang Estuary in summer. Journal of Geophysical Research: Biogeosciences, 125(10): e2020JG005727. doi: 10.1029/2020JG005727 Zhang Haiyan, Fennel K, Laurent A, et al. 2020. A numerical model study of the main factors contributing to hypoxia and its interannual and short-term variability in the East China Sea. Biogeosciences, 17(22): 5745–5761. doi: 10.5194/bg-17-5745-2020 Zhang Jing, Liu Sumei, Ren Jingling et al. 2007. Nutrient gradients from the eutrophic Changjiang (Yangtze River) Estuary to the oligotrophic Kuroshio waters and re-evaluation of budgets for the East China Sea shelf. Progress in Oceanography, 74(4): 449–478. doi: 10.1016/j.pocean.2007.04.019 Zheng Jingjing, Gao Shan, Liu Guimei, et al. 2016. Modeling the impact of river discharge and wind on the hypoxia off Yangtze Estuary. Natural Hazards and Earth System Sciences, 16(12): 1–25. doi: 10.5194/nhess-2016-129 Zhou Feng, Chai Fei, Huang Daji, et al. 2017. Investigation of hypoxia off the Changjiang Estuary using a coupled model of ROMS-CoSiNE. Progress in Oceanography, 159: 237–254. doi: 10.1016/j.pocean.2017.10.008 Zhou Feng, Chai Fei, Huang Daji, et al. 2020. Coupling and decoupling of high biomass phytoplankton production and hypoxia in a highly dynamic coastal system: the Changjiang (Yangtze River) Estuary. Frontiers in Marine Science, 7: 259. doi: 10.3389/fmars.2020.00259 Zhou Feng, Huang Daji, Ni Xiaobo, et al. 2010. Hydrographic analysis on the multi-time scale variability of hypoxia adjacent to the Changjiang River Estuary. Acta Ecologica Sinica, 30(17): 4728–4740 Zhu Zhuoyi, Zhang Jing, Wu Ying, et al. 2011. Hypoxia off the Changjiang (Yangtze River) Estuary: oxygen depletion and organic matter decomposition. Marine Chemistry, 125(1−4): 108–116. doi: 10.1016/j.marchem.2011.03.005 -


 点击查看大图

计量
- 文章访问数: 375
- HTML全文浏览量: 122
- PDF下载量: 17
- 被引次数: 0

