

Variability of the deep South China Sea circulation derived from HYCOM reanalysis data
-
Abstract: This study aims to investigate variability of the deep South China Sea (SCS) circulation using the Hybrid Coordinate Ocean Model (HYCOM) global reanalysis product. The results reveal that annual cycle is a dominant component in the deep SCS circulation. Meanwhile, the boundary circulation strength is the weakest in January and peaks between June and September. The eastern and southern boundary currents strengthen/weaken one to three months earlier than that in the western and northern boundaries. Vector Empirical Orthogonal Functions (VEOF) analysis results reveal that semiannual and intraseasonal fluctuations are significant components, of which the spatial patterns are mainly confined in the northern and western boundary areas as well as the southwestern sub-basin. Wavelet analysis results show the strength of significant fluctuation varies year to year. Trend analysis results indicate a decadal weakening in the deep SCS circulation. An anomalous anticyclonic circulation, 50–70 km apart from the slope break, tends to weaken the cyclonic boundary circulation in the western and northern boundaries as well as the southwestern sub-basin. This trend is similar to the observed decadal weakening in the North Atlantic deep circulation. Thus, the findings of this study reveal that the variation of the deep SCS circulation has a remarkable response to the climate change. The mechanisms responsible for the variation are worth pursuing if more observations are available.
-
Key words:
- South China Sea /
- variability of deep circulation /
- HYCOM data /
- VEOF analysis /
- wavelet analysis
-
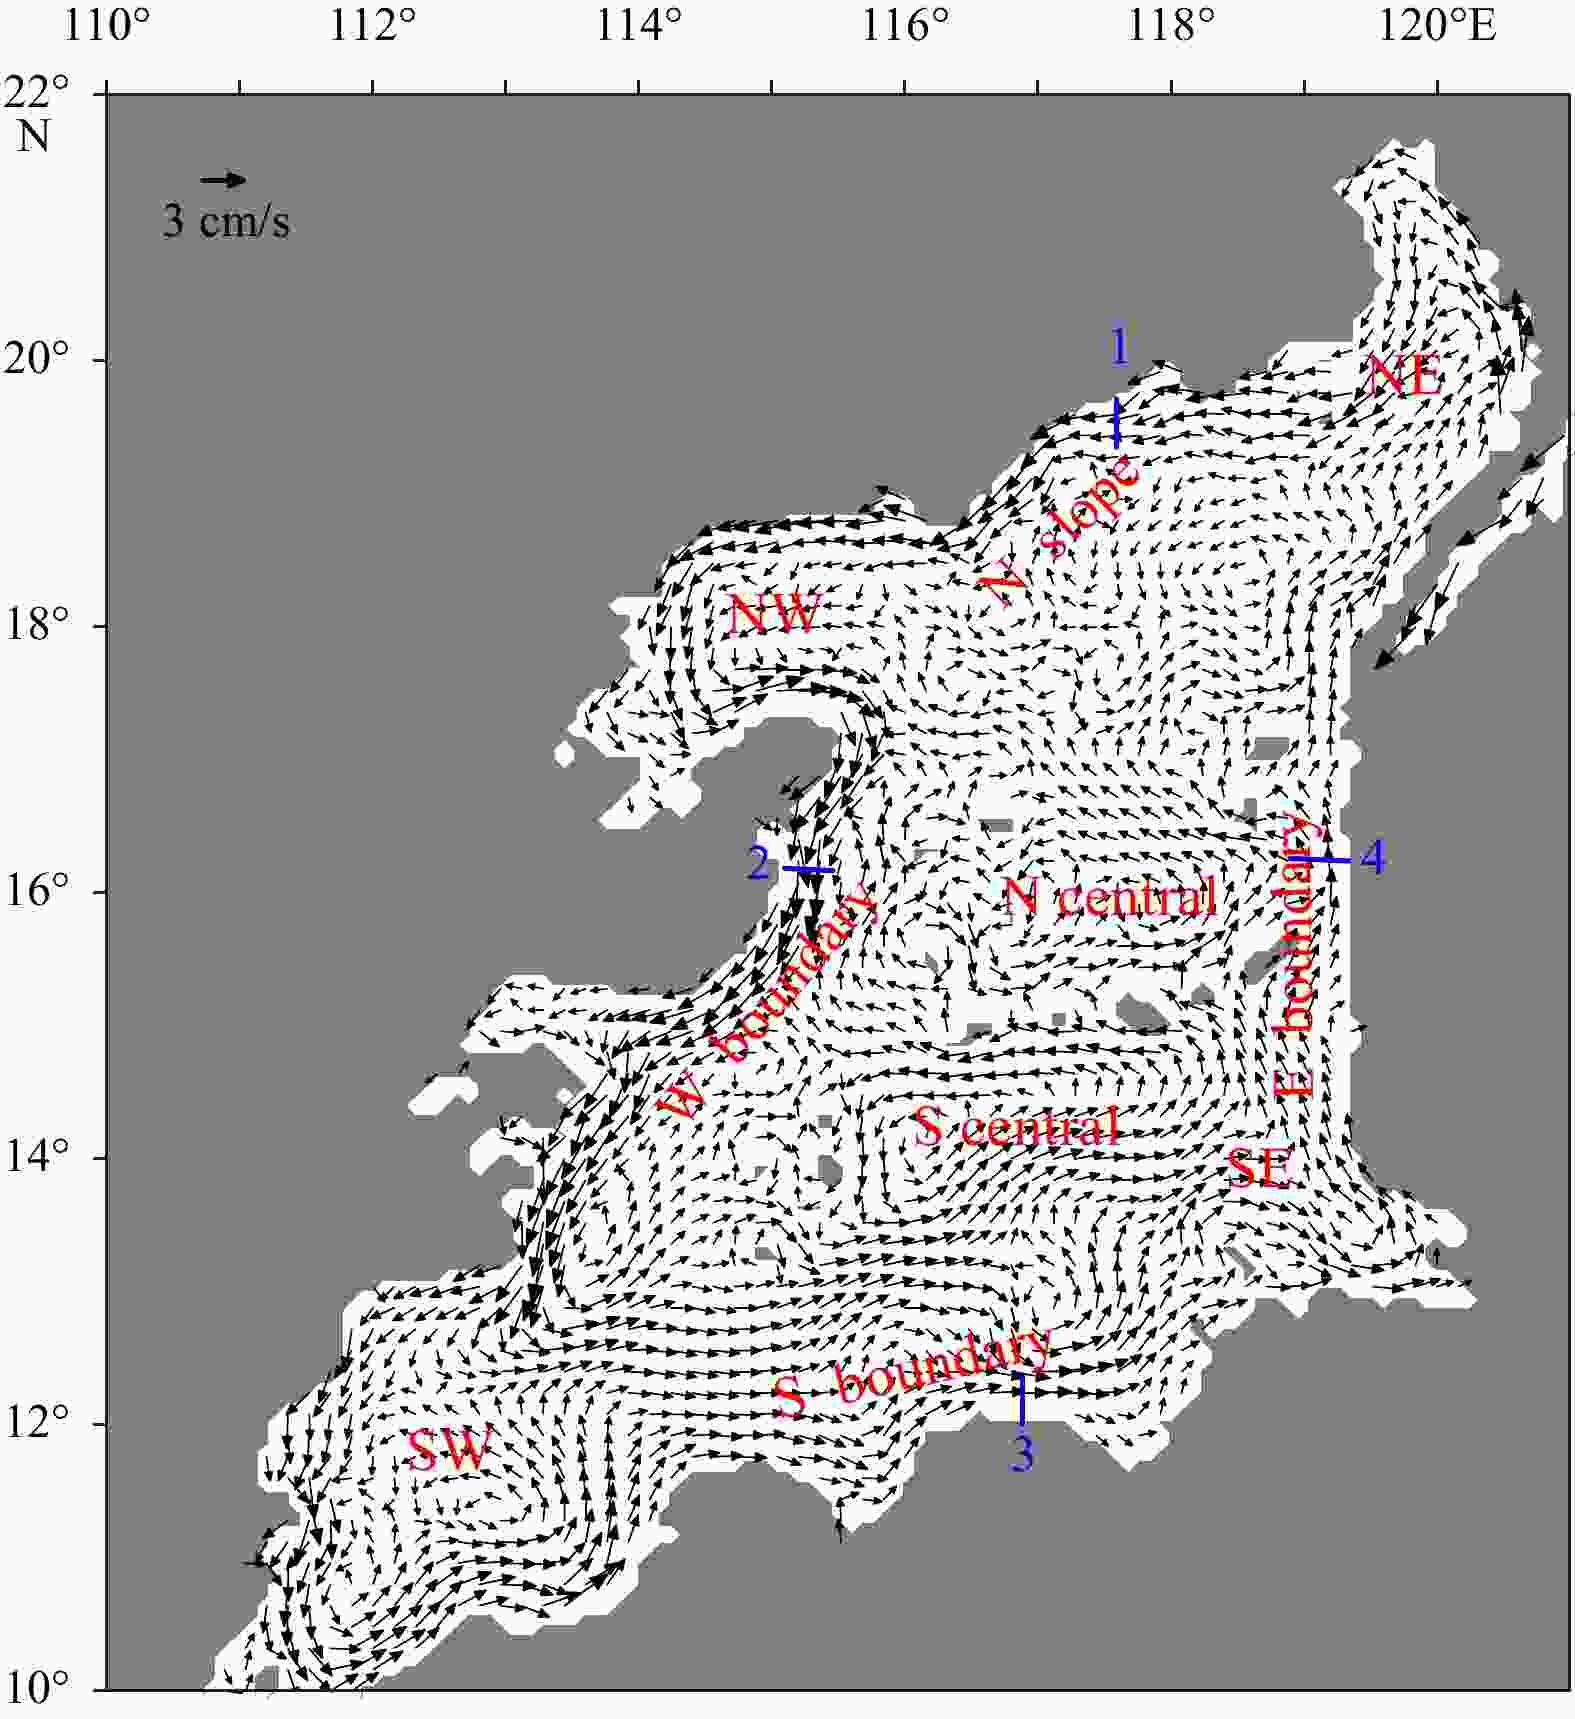
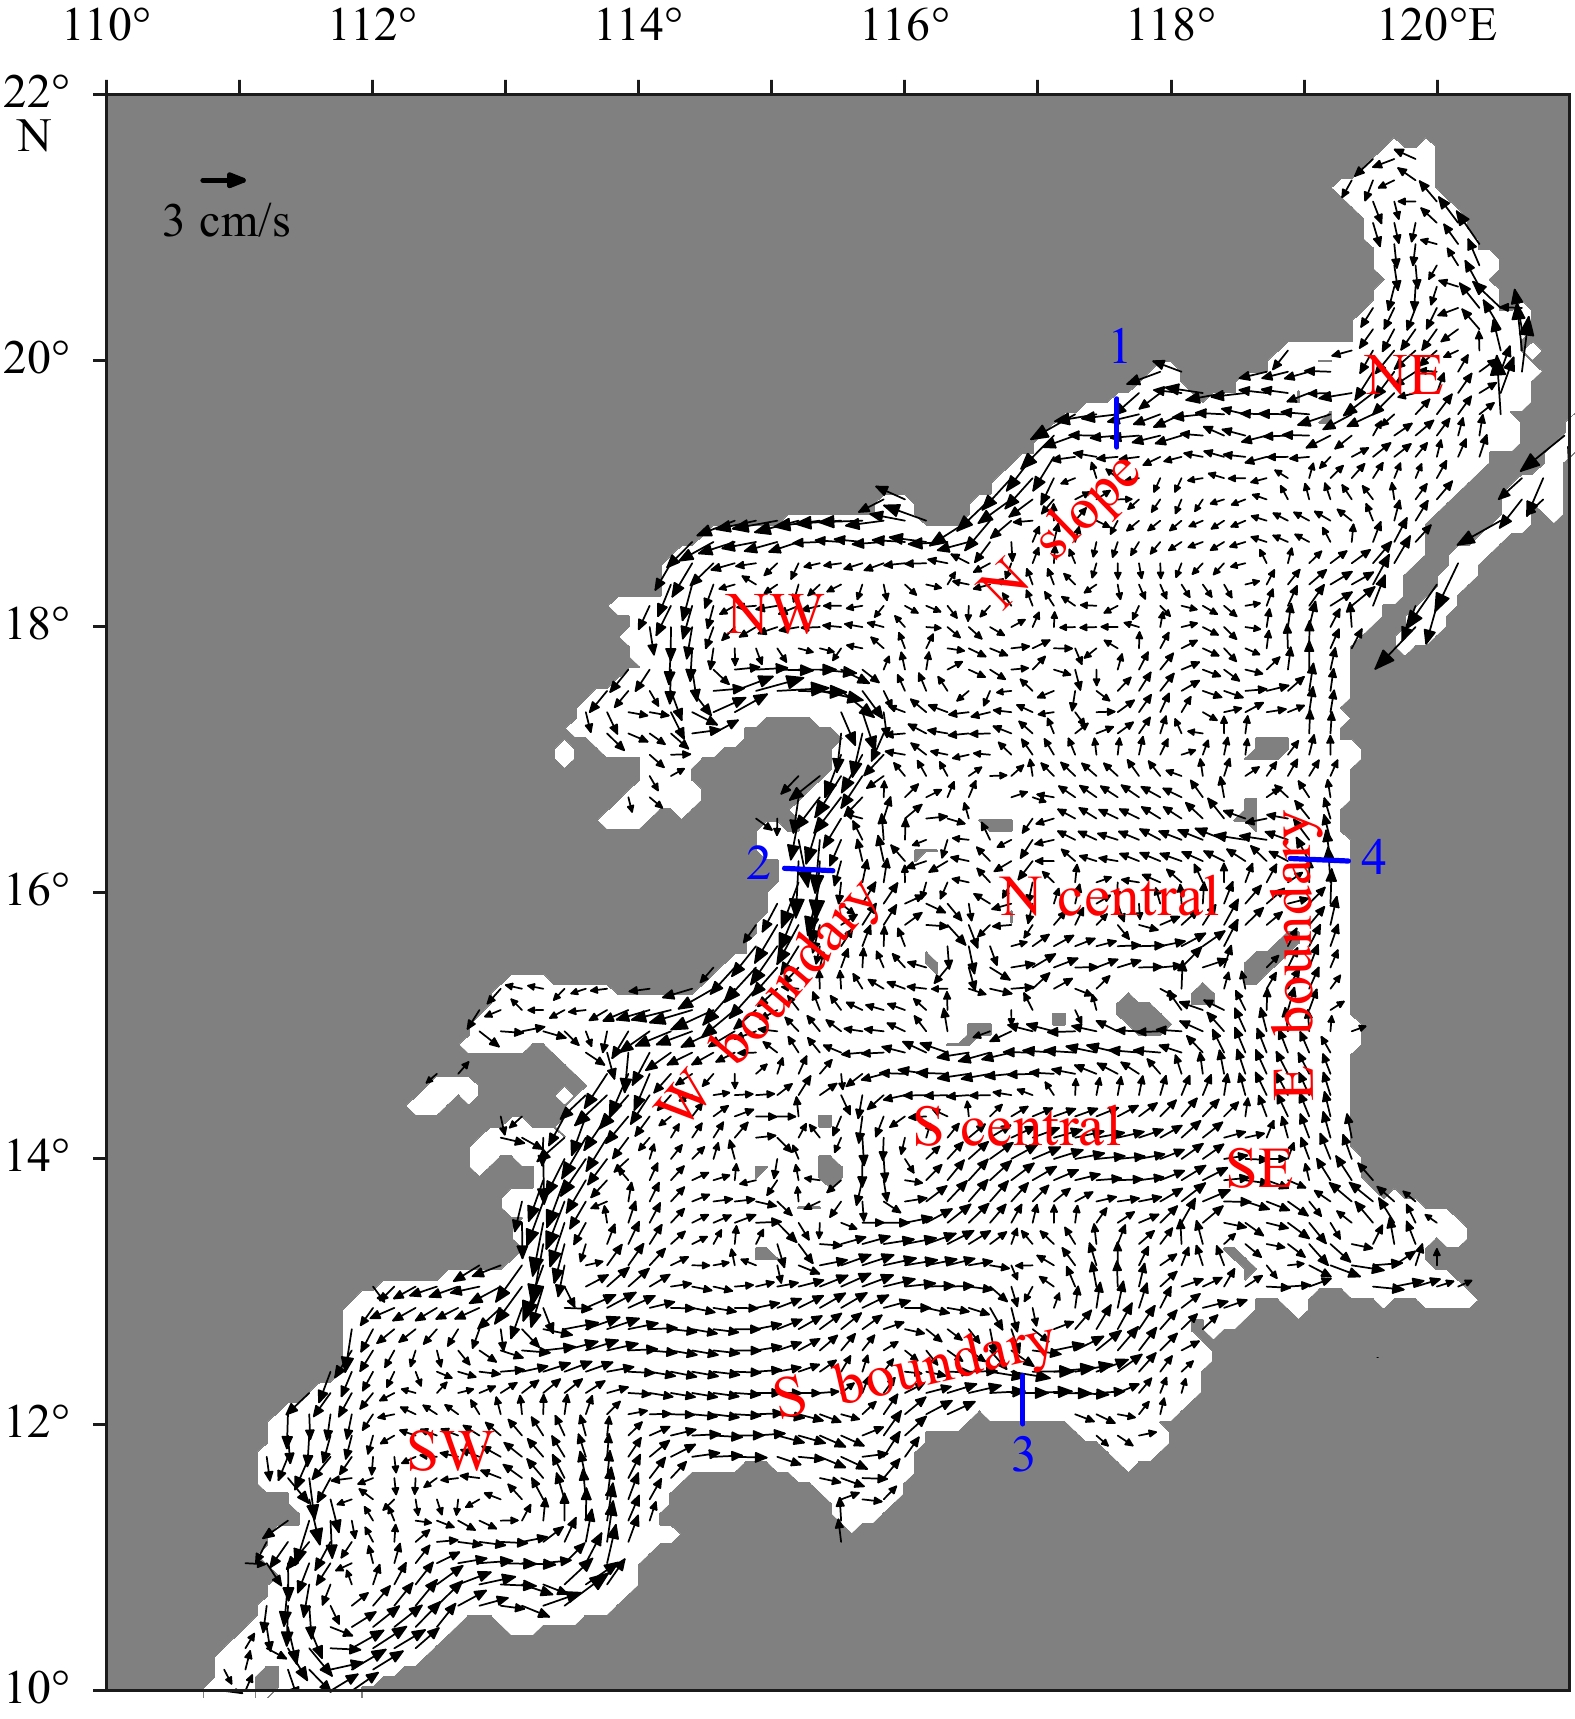
Figure 1. Time-mean current velocity field at 3 000 m depth. The grey shading indicates water depths shallower than 3 000 m. Abbreviations NE, NW, SW, and SE denote the northeastern, northwestern, southwestern, and southeastern sub-basins, respectively. N central and S central indicate the northern and southern central sub-basins, respectively. Blue lines stand for transects through which monthly mean climatology of the deep boundary circulation is estimated.

Figure 2. Standard deviations (STDs) of u (a), and v (b) components at 3 000 m, respectively. Stippled area denotes STDs greater than 3 cm/s.
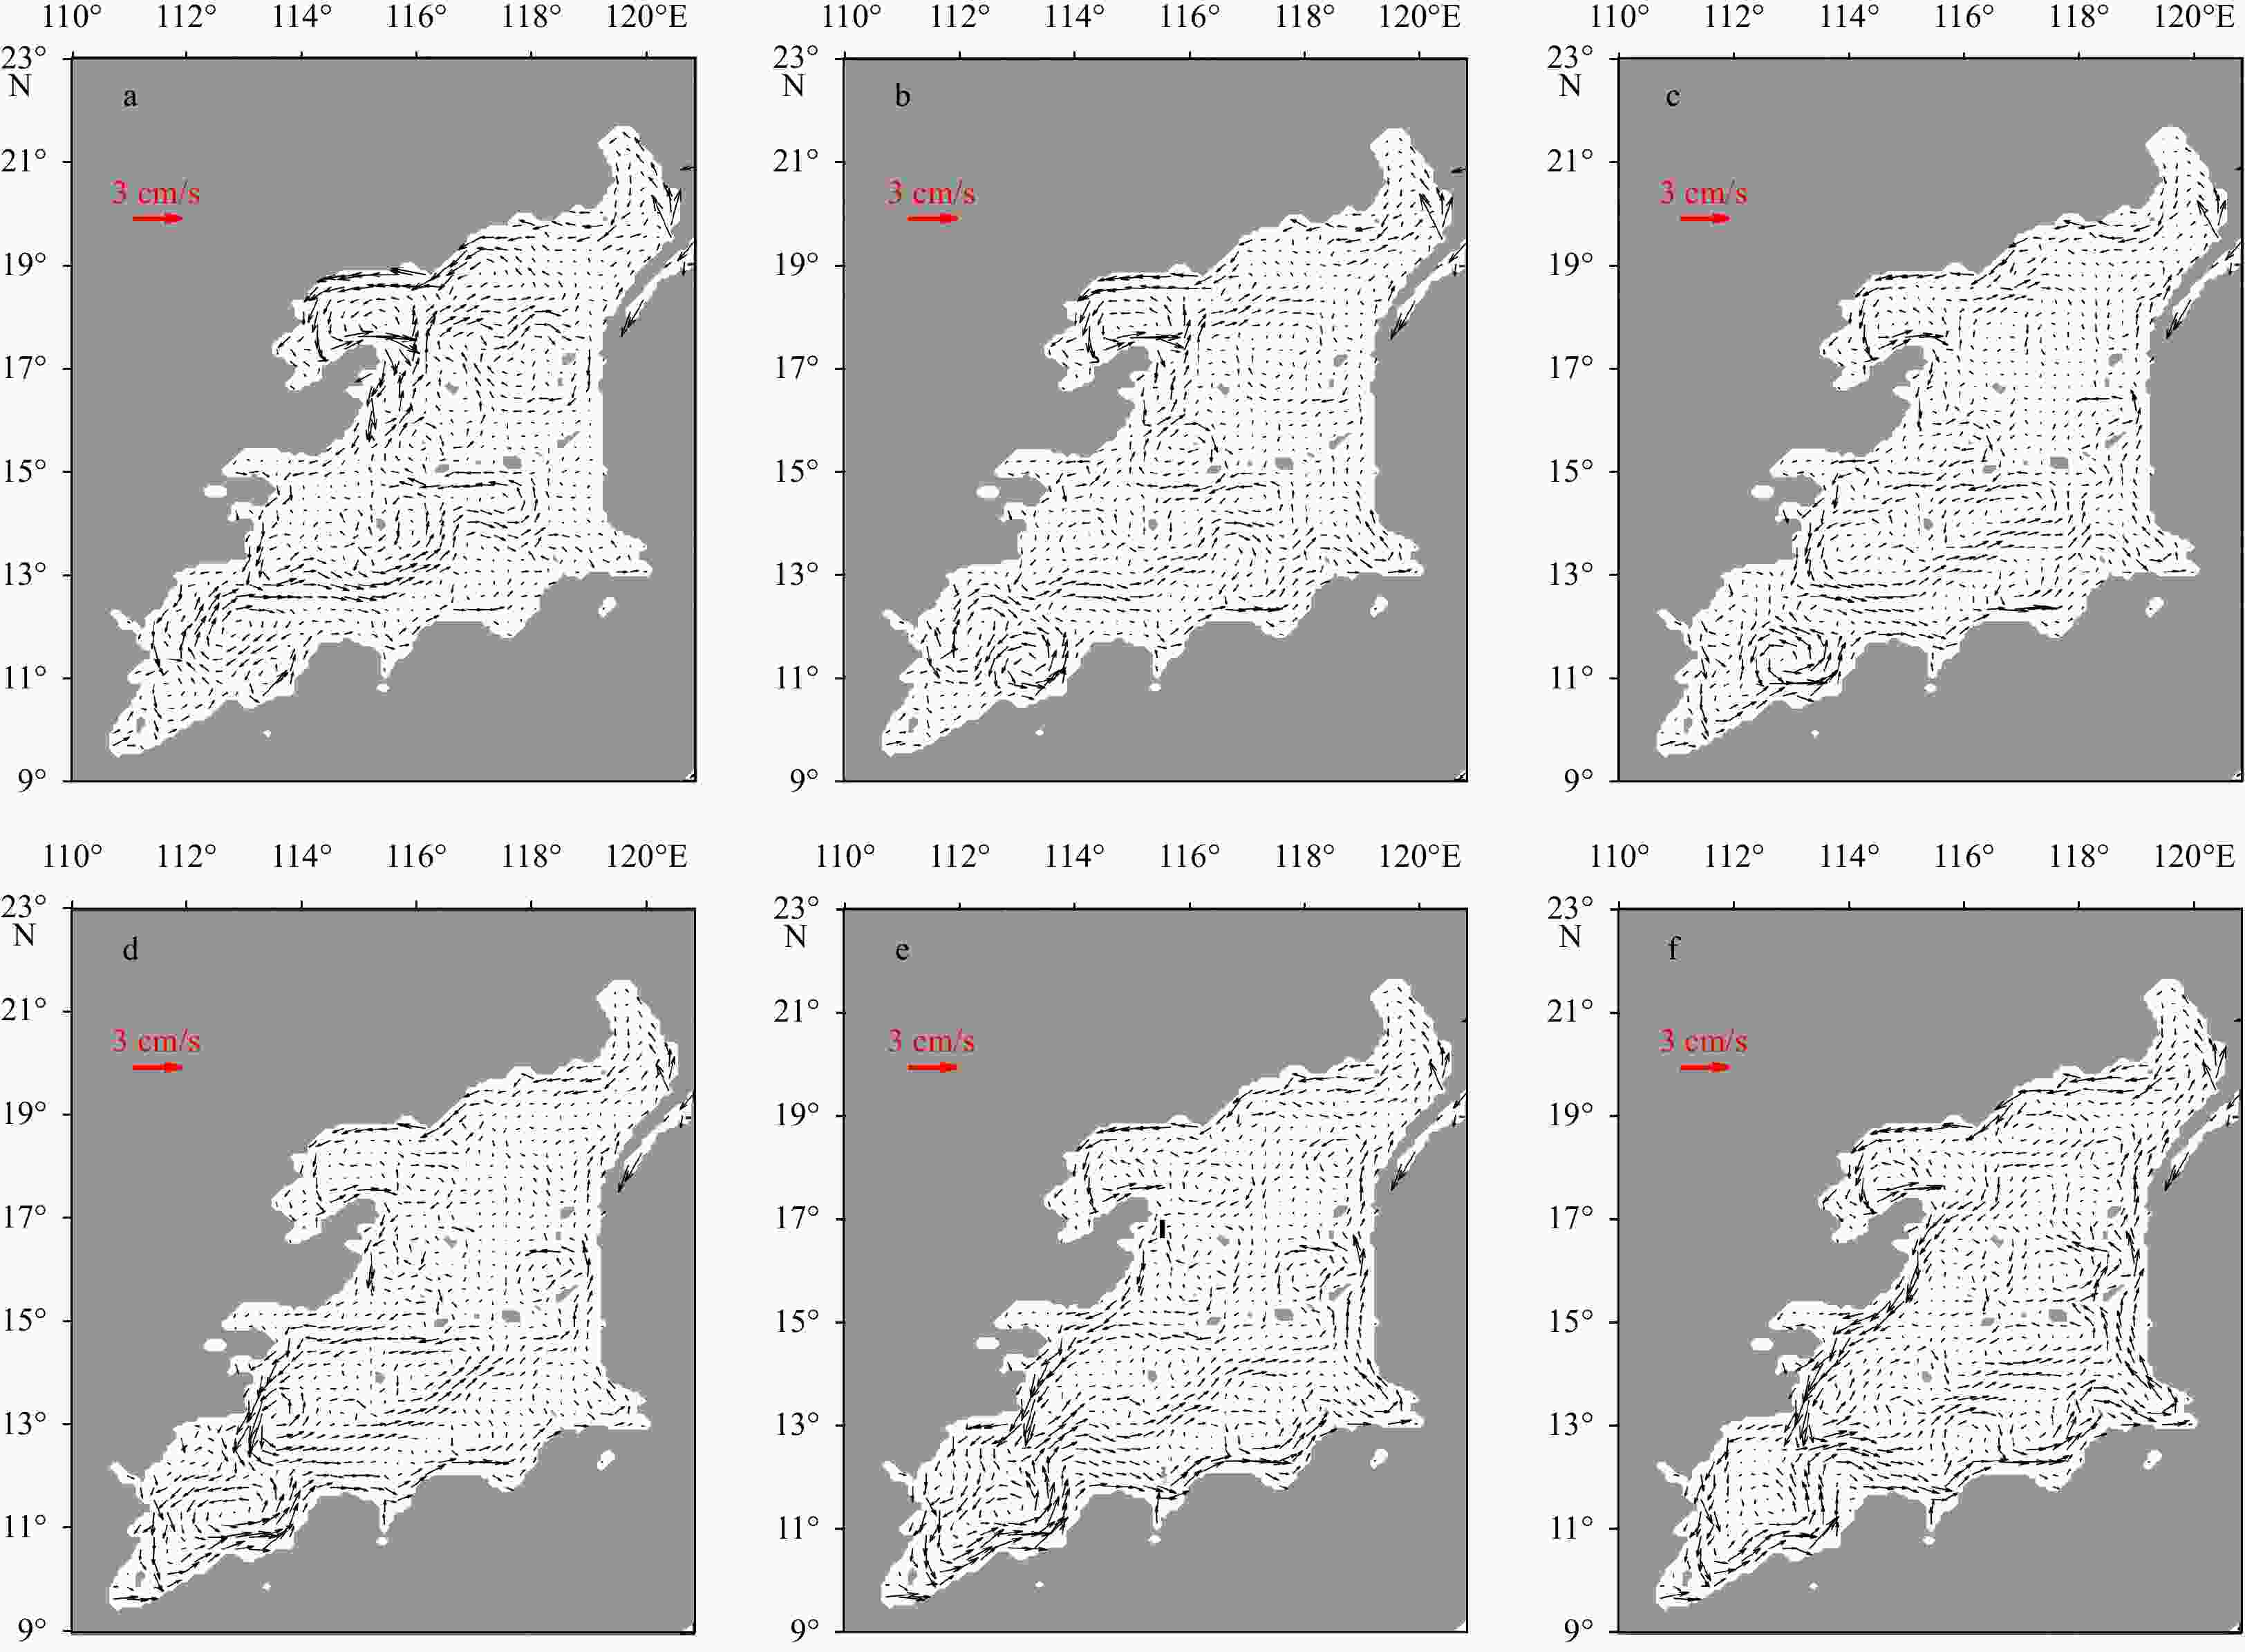
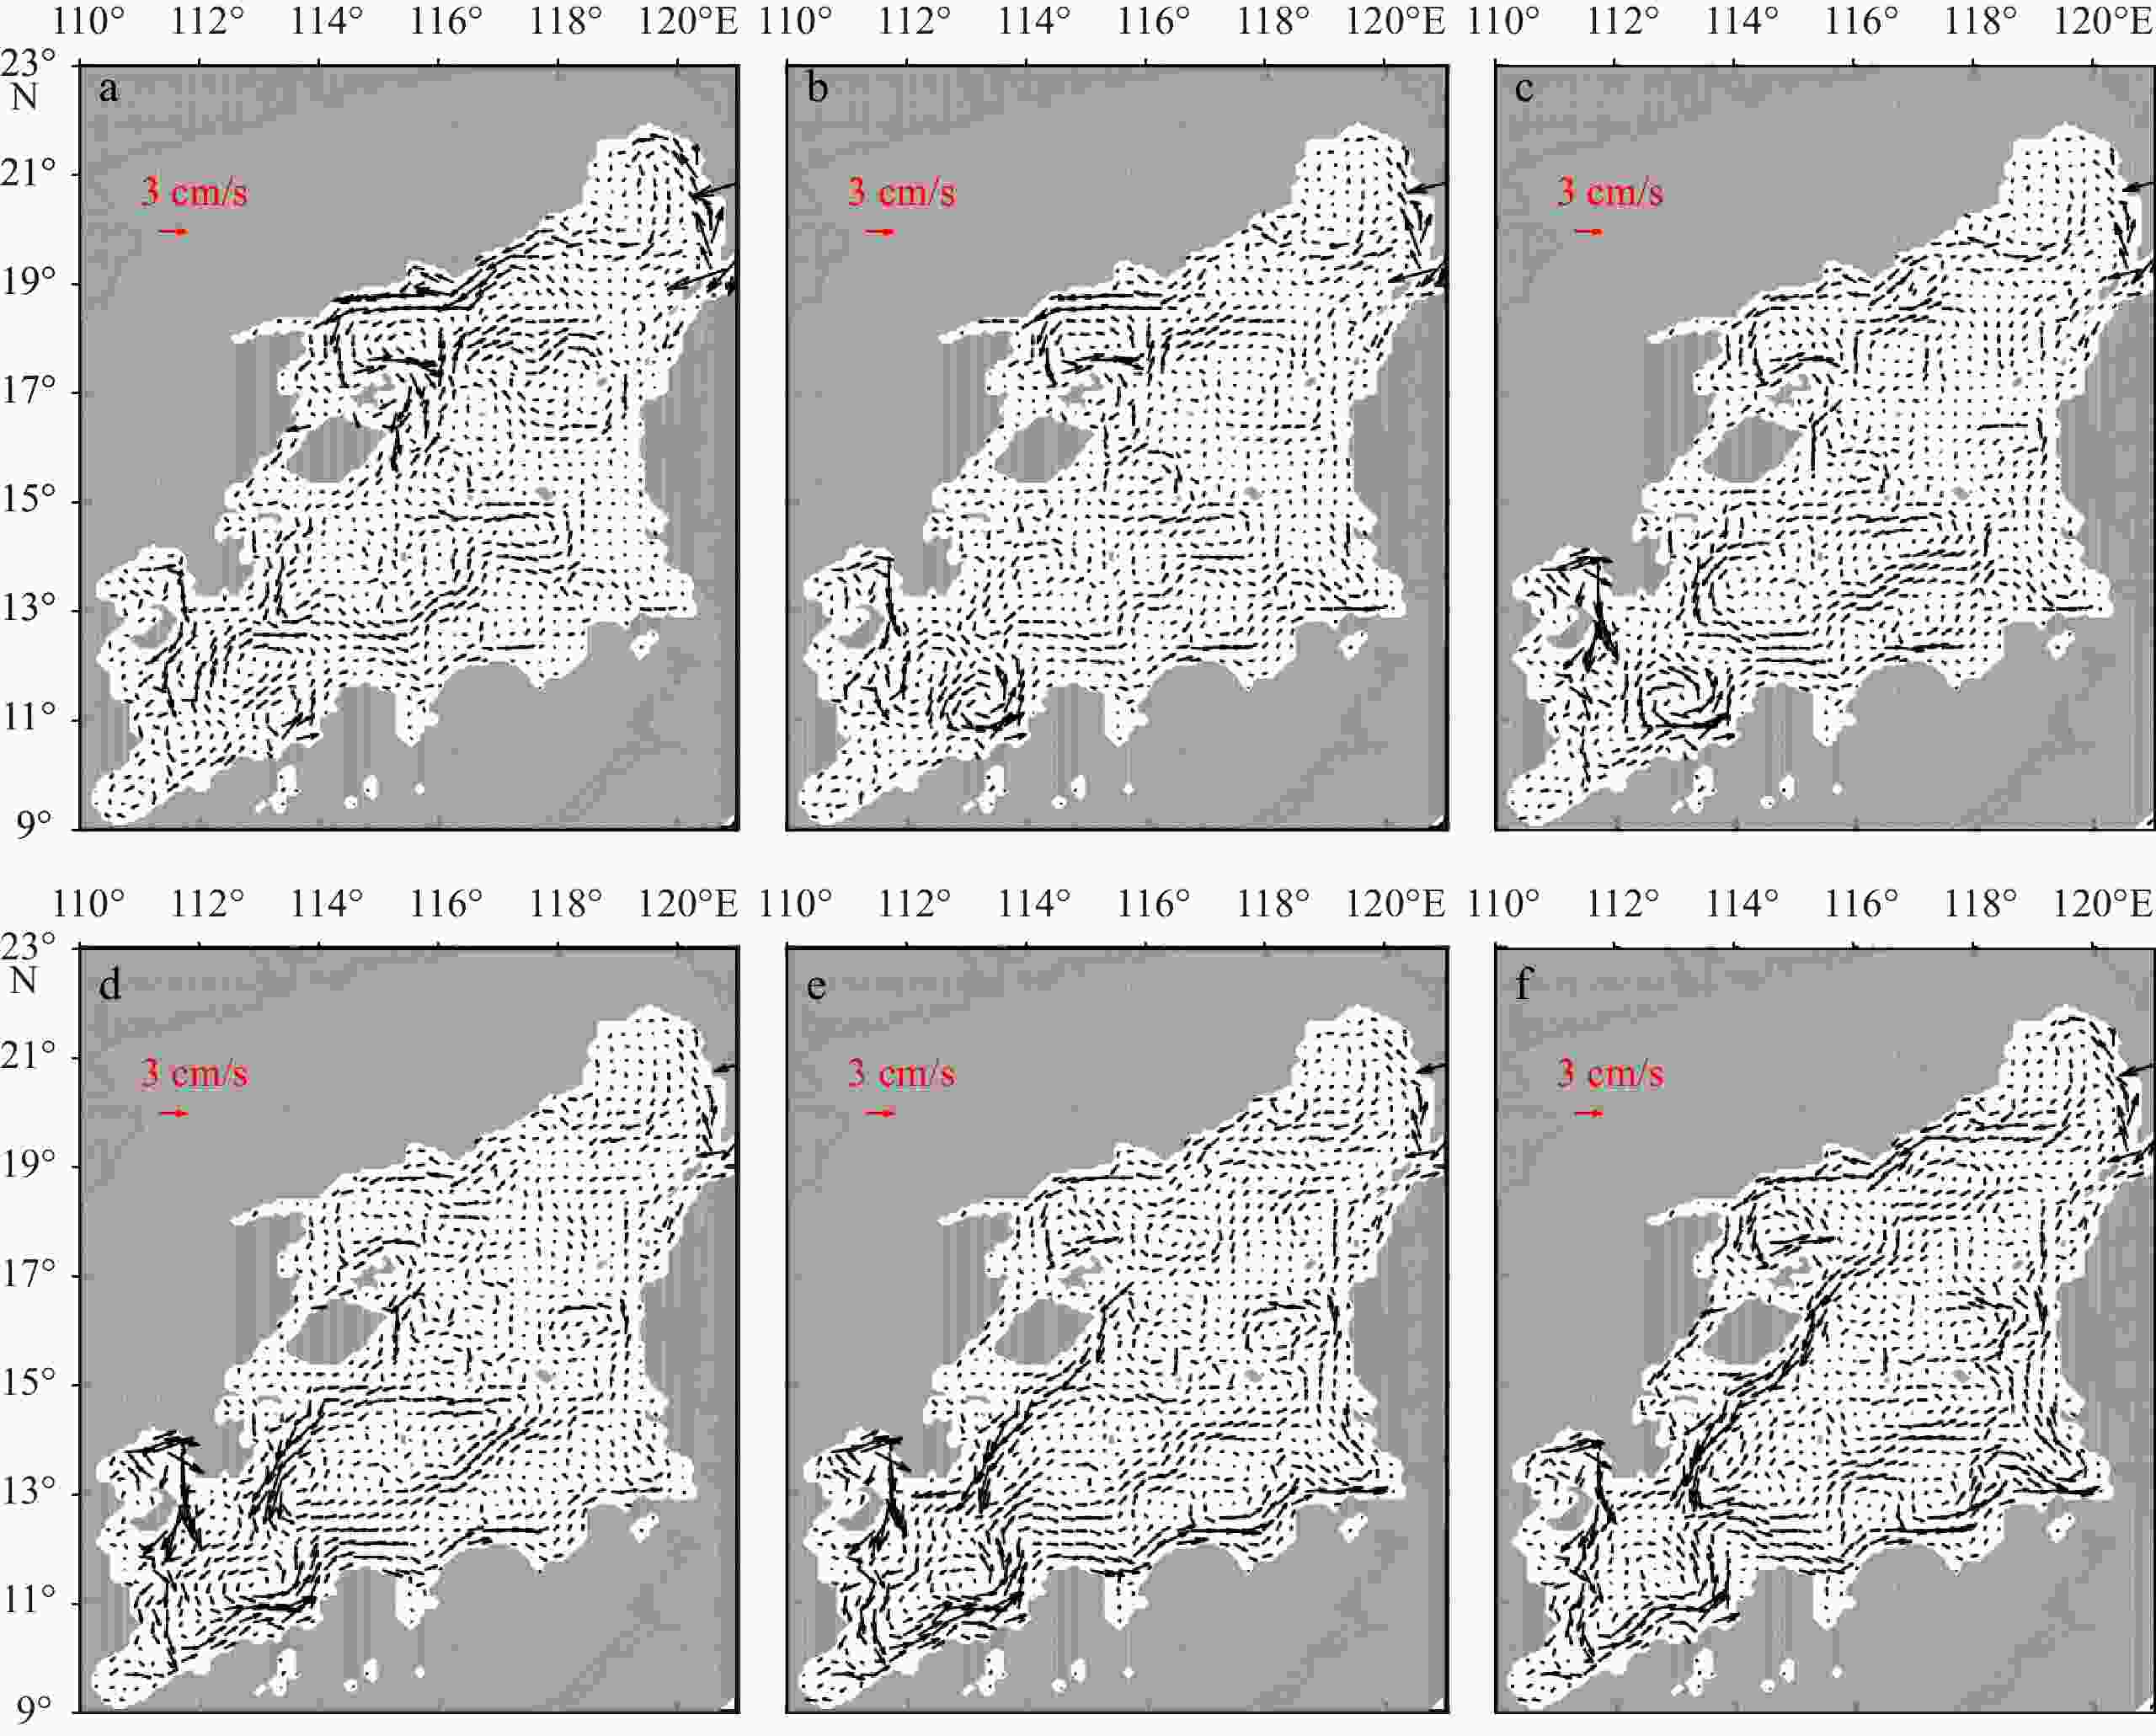
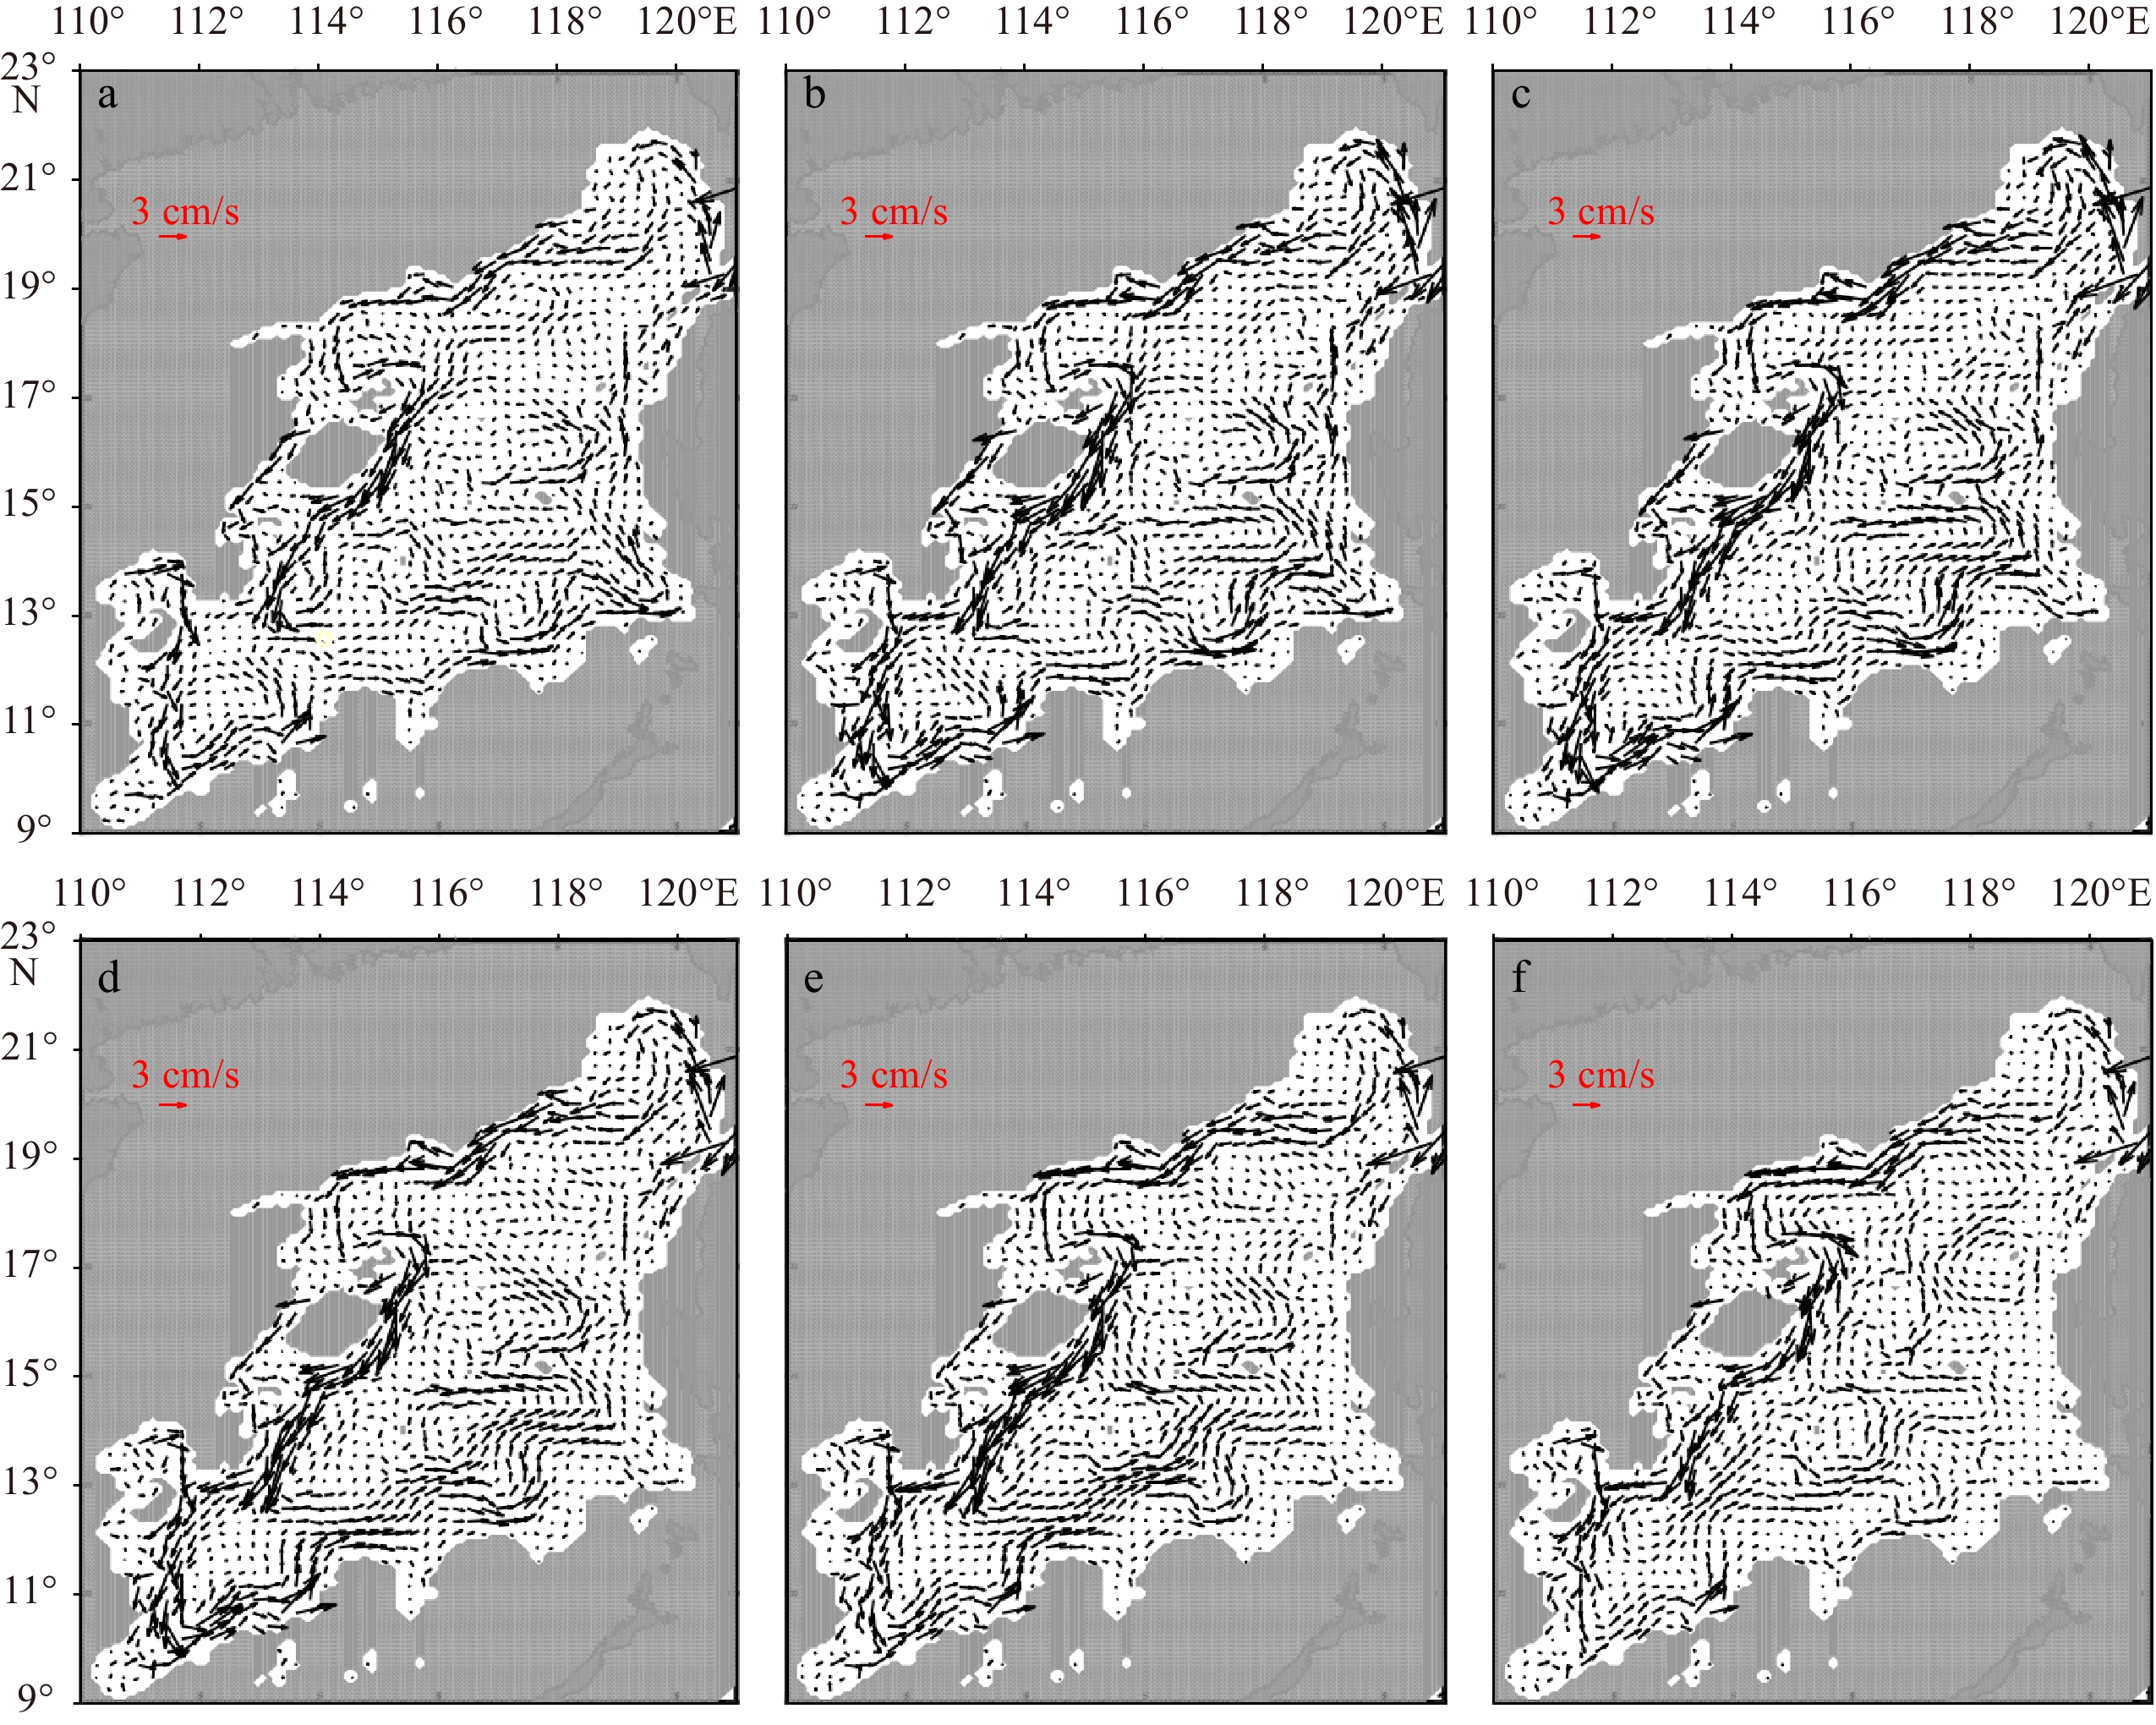
Figure 3. Monthly mean circulation at 3 000 m in December (a), January (b), February (c), March (d), April (e), and May (f).
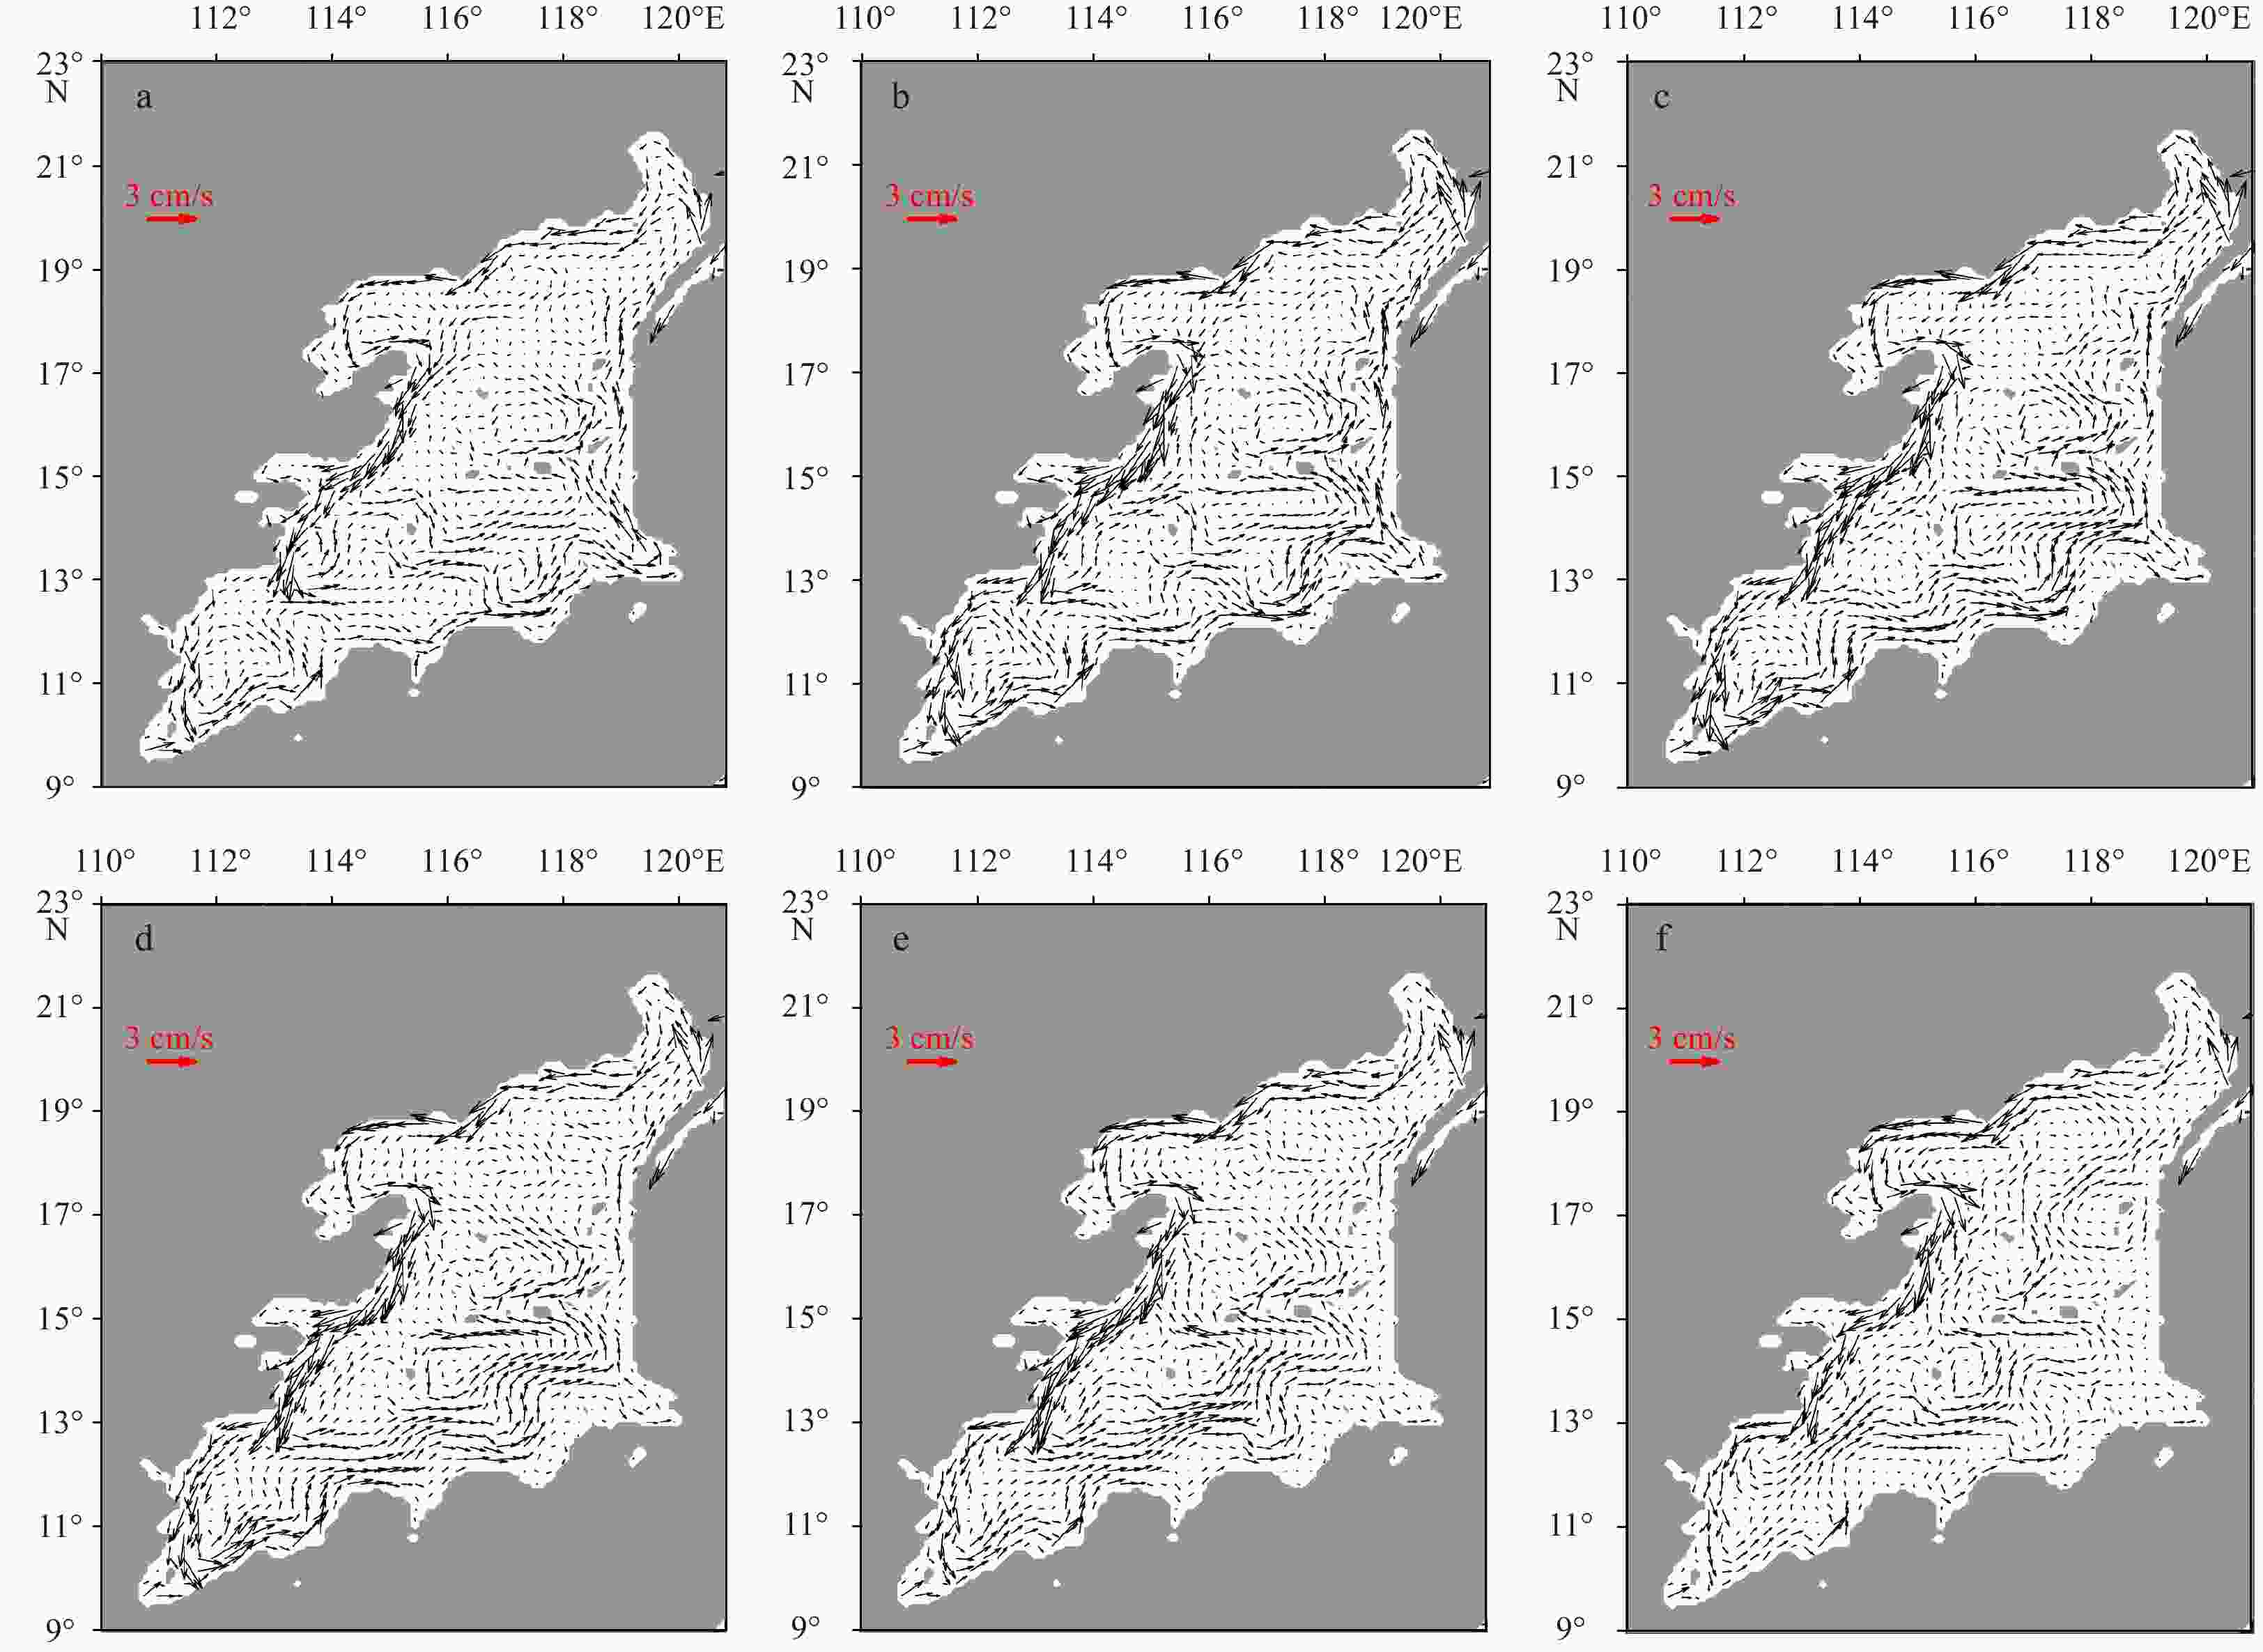
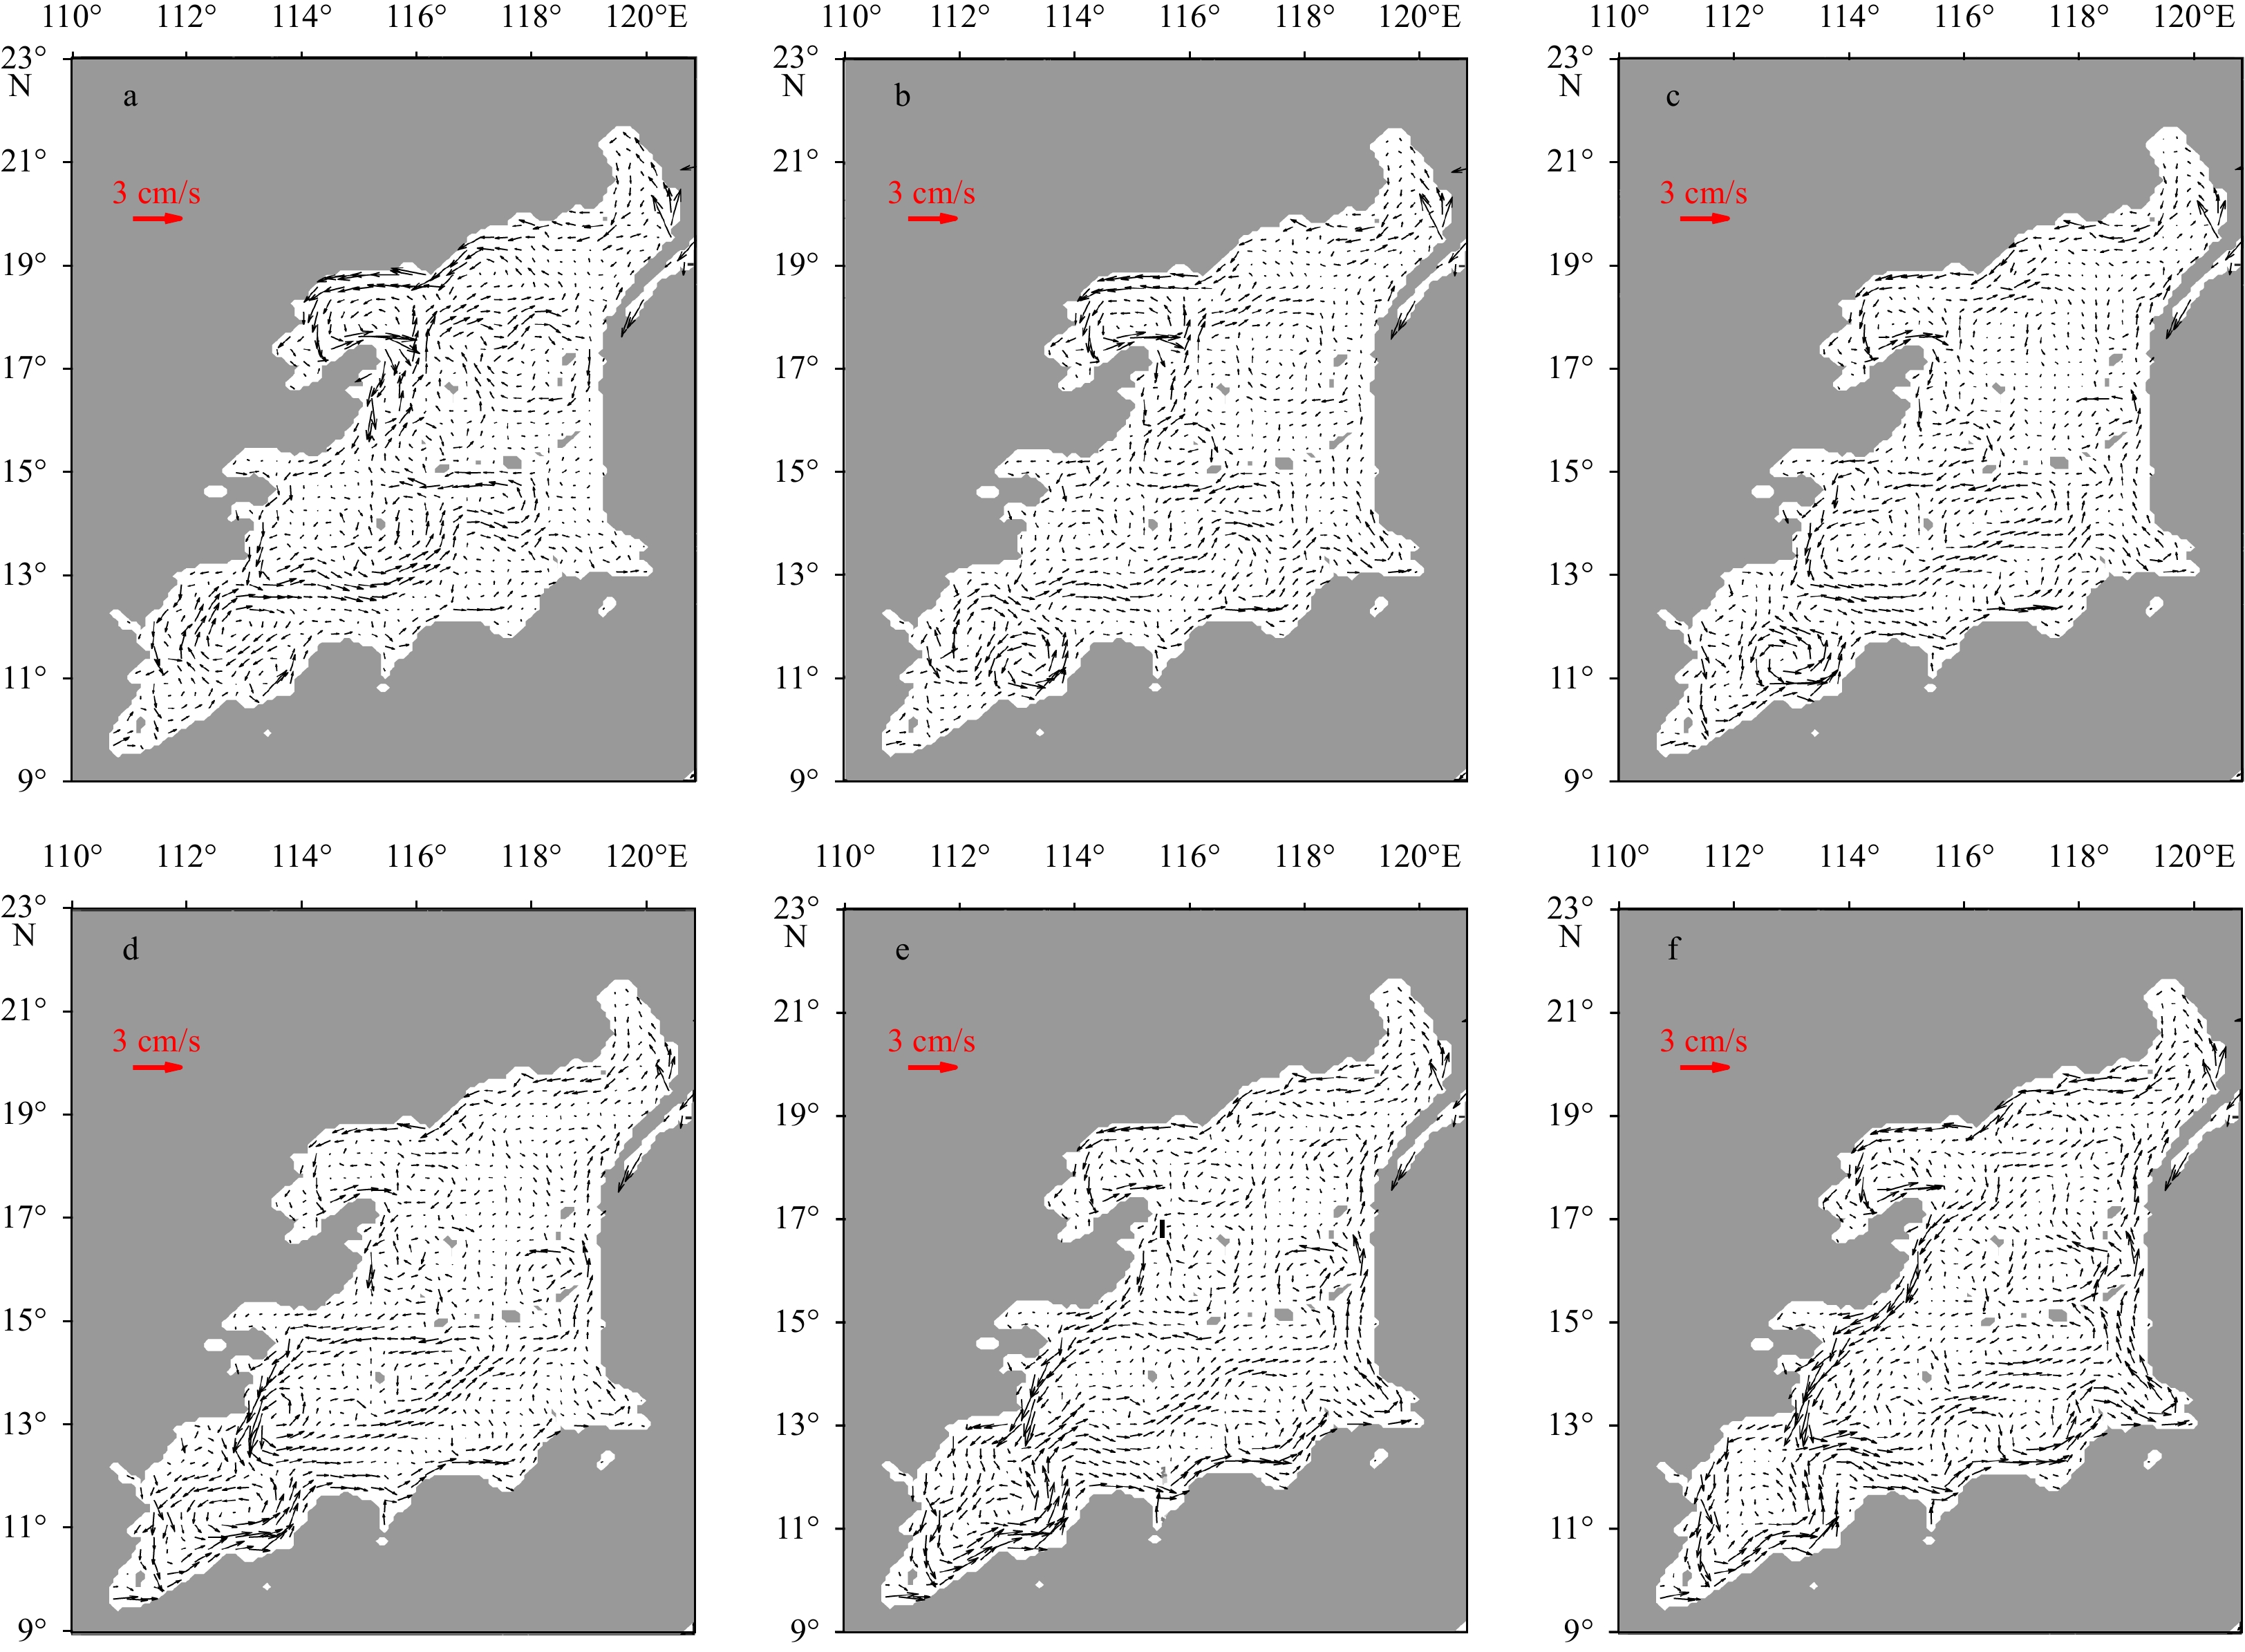
Figure 4. Monthly mean circulation at 3 000 m in June (a), July (b), August (c), September (d), October (e), and November (f).

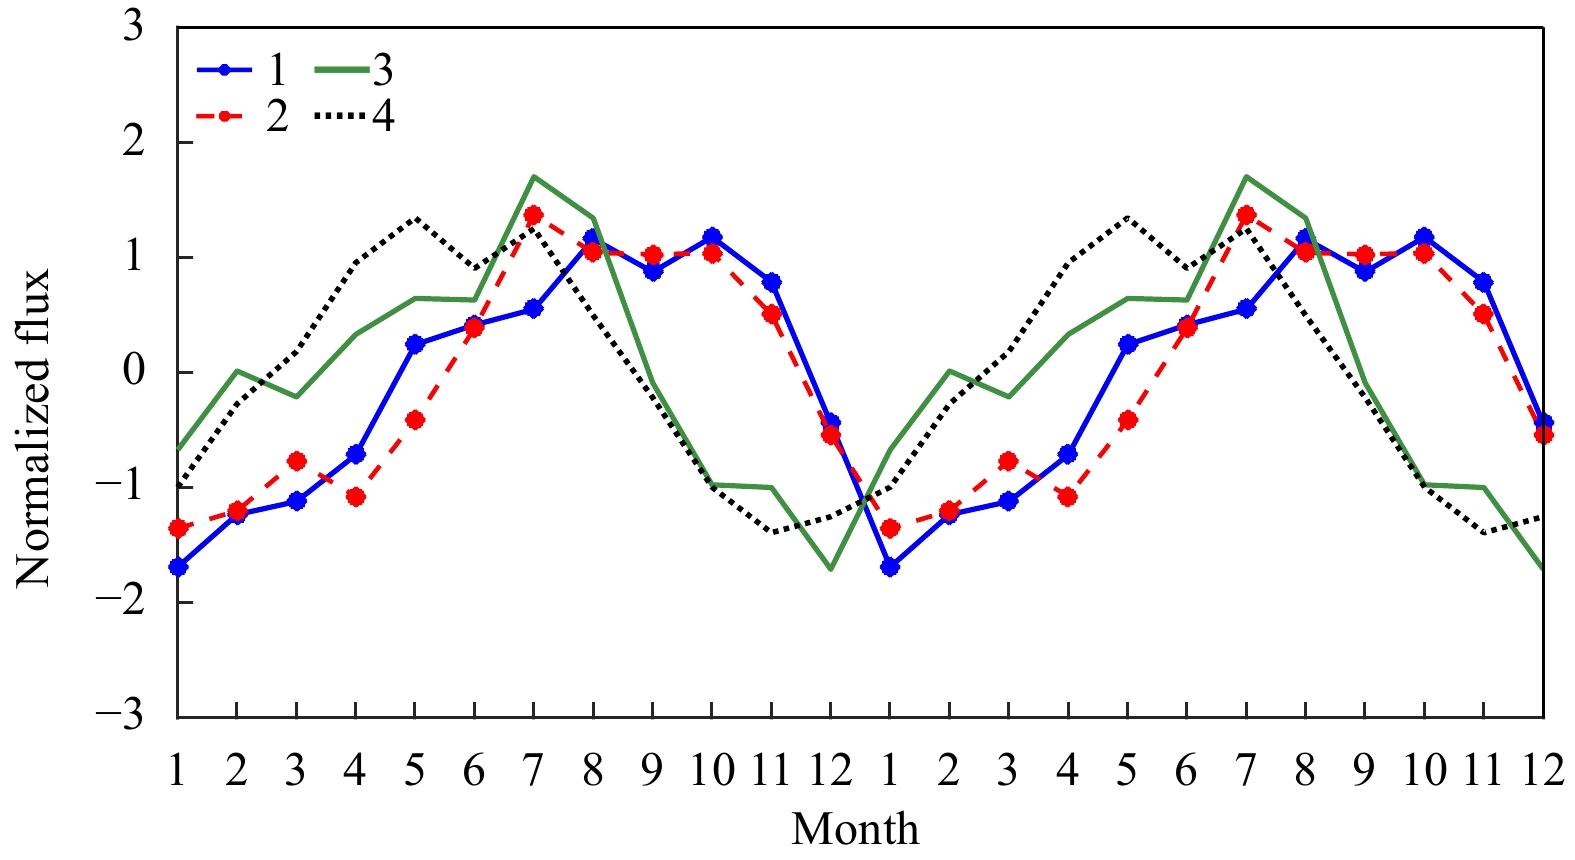
Figure 5. Annual cycle of normalized fluxes through boundary transects. Transects 1, 2, 3, and 4 indicate the northern, western, southern, and eastern boundaries, respectively.

Figure 6. Spatial structure (a), temporal variation (b), associated power spectrum density (c) and wavelet analysis (d) of the first VEOF mode.

Figure 7. Spatial structure (a), temporal variation (b), associated power spectrum density (c) and wavelet analysis (d) of the second VEOF mode.
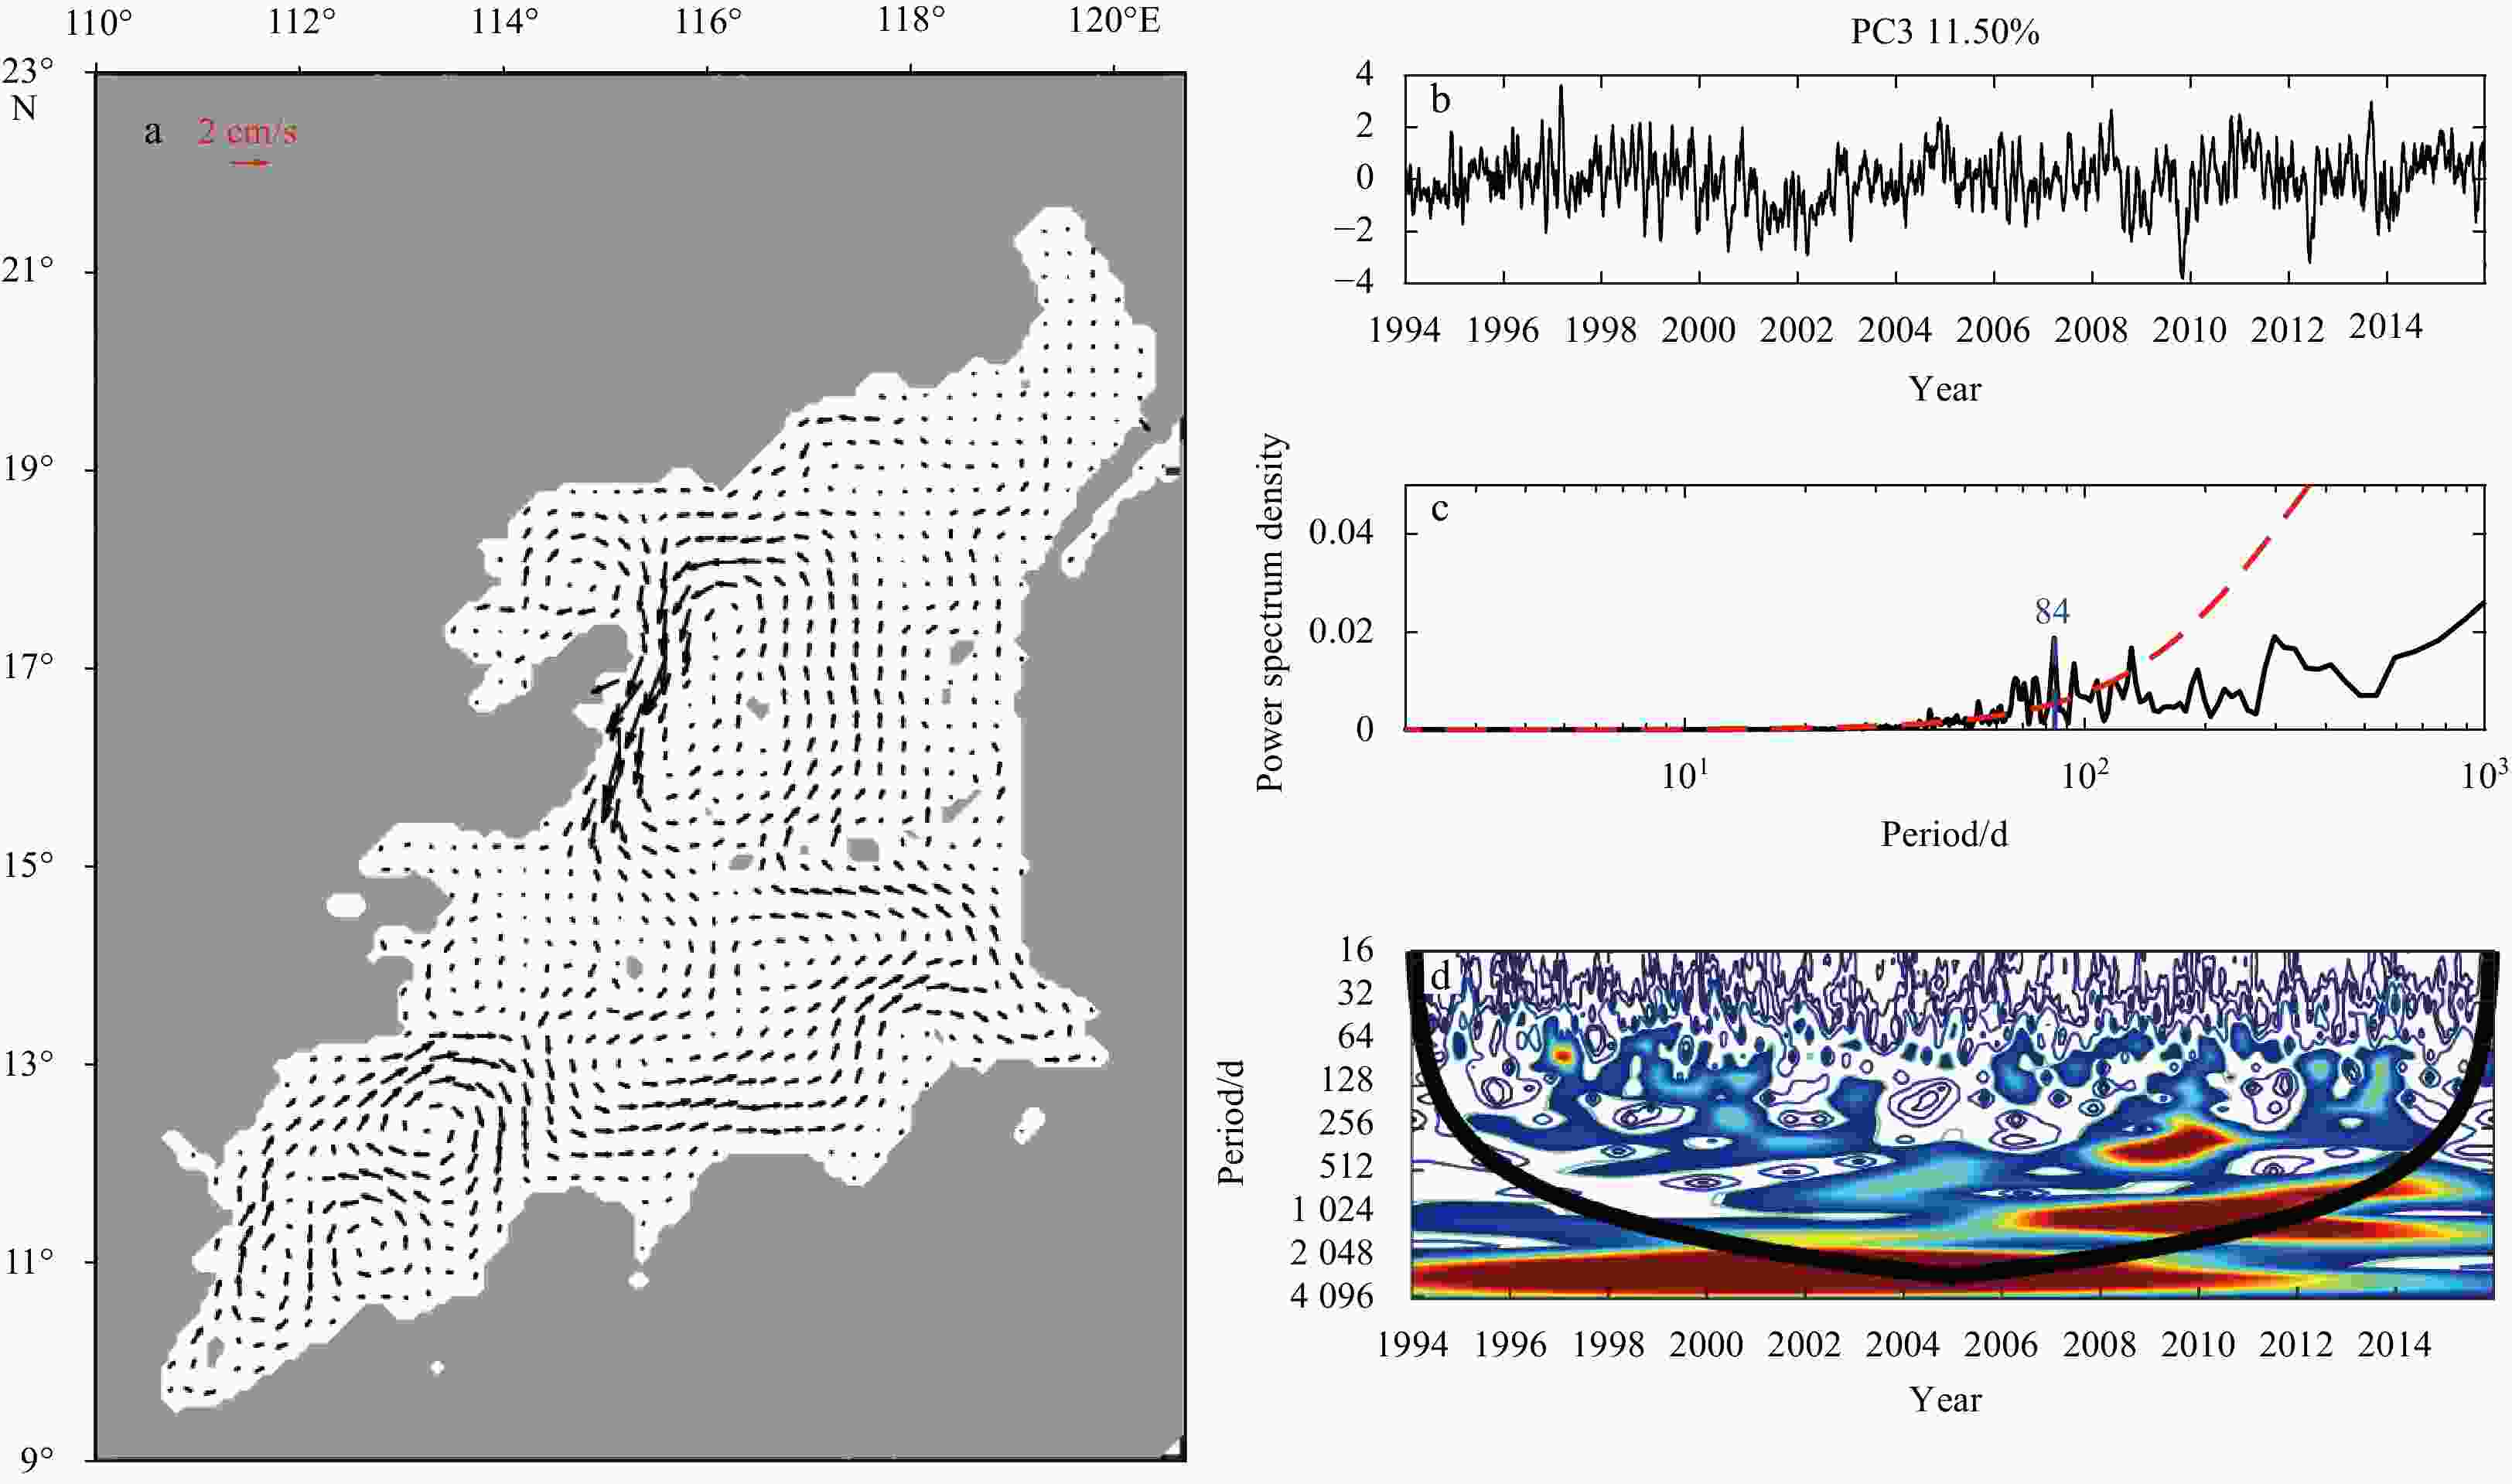
Figure 8. Spatial structure (a), temporal variation (b), associated power spectrum density (c) and wavelet analysis (d) of the third VEOF mode.
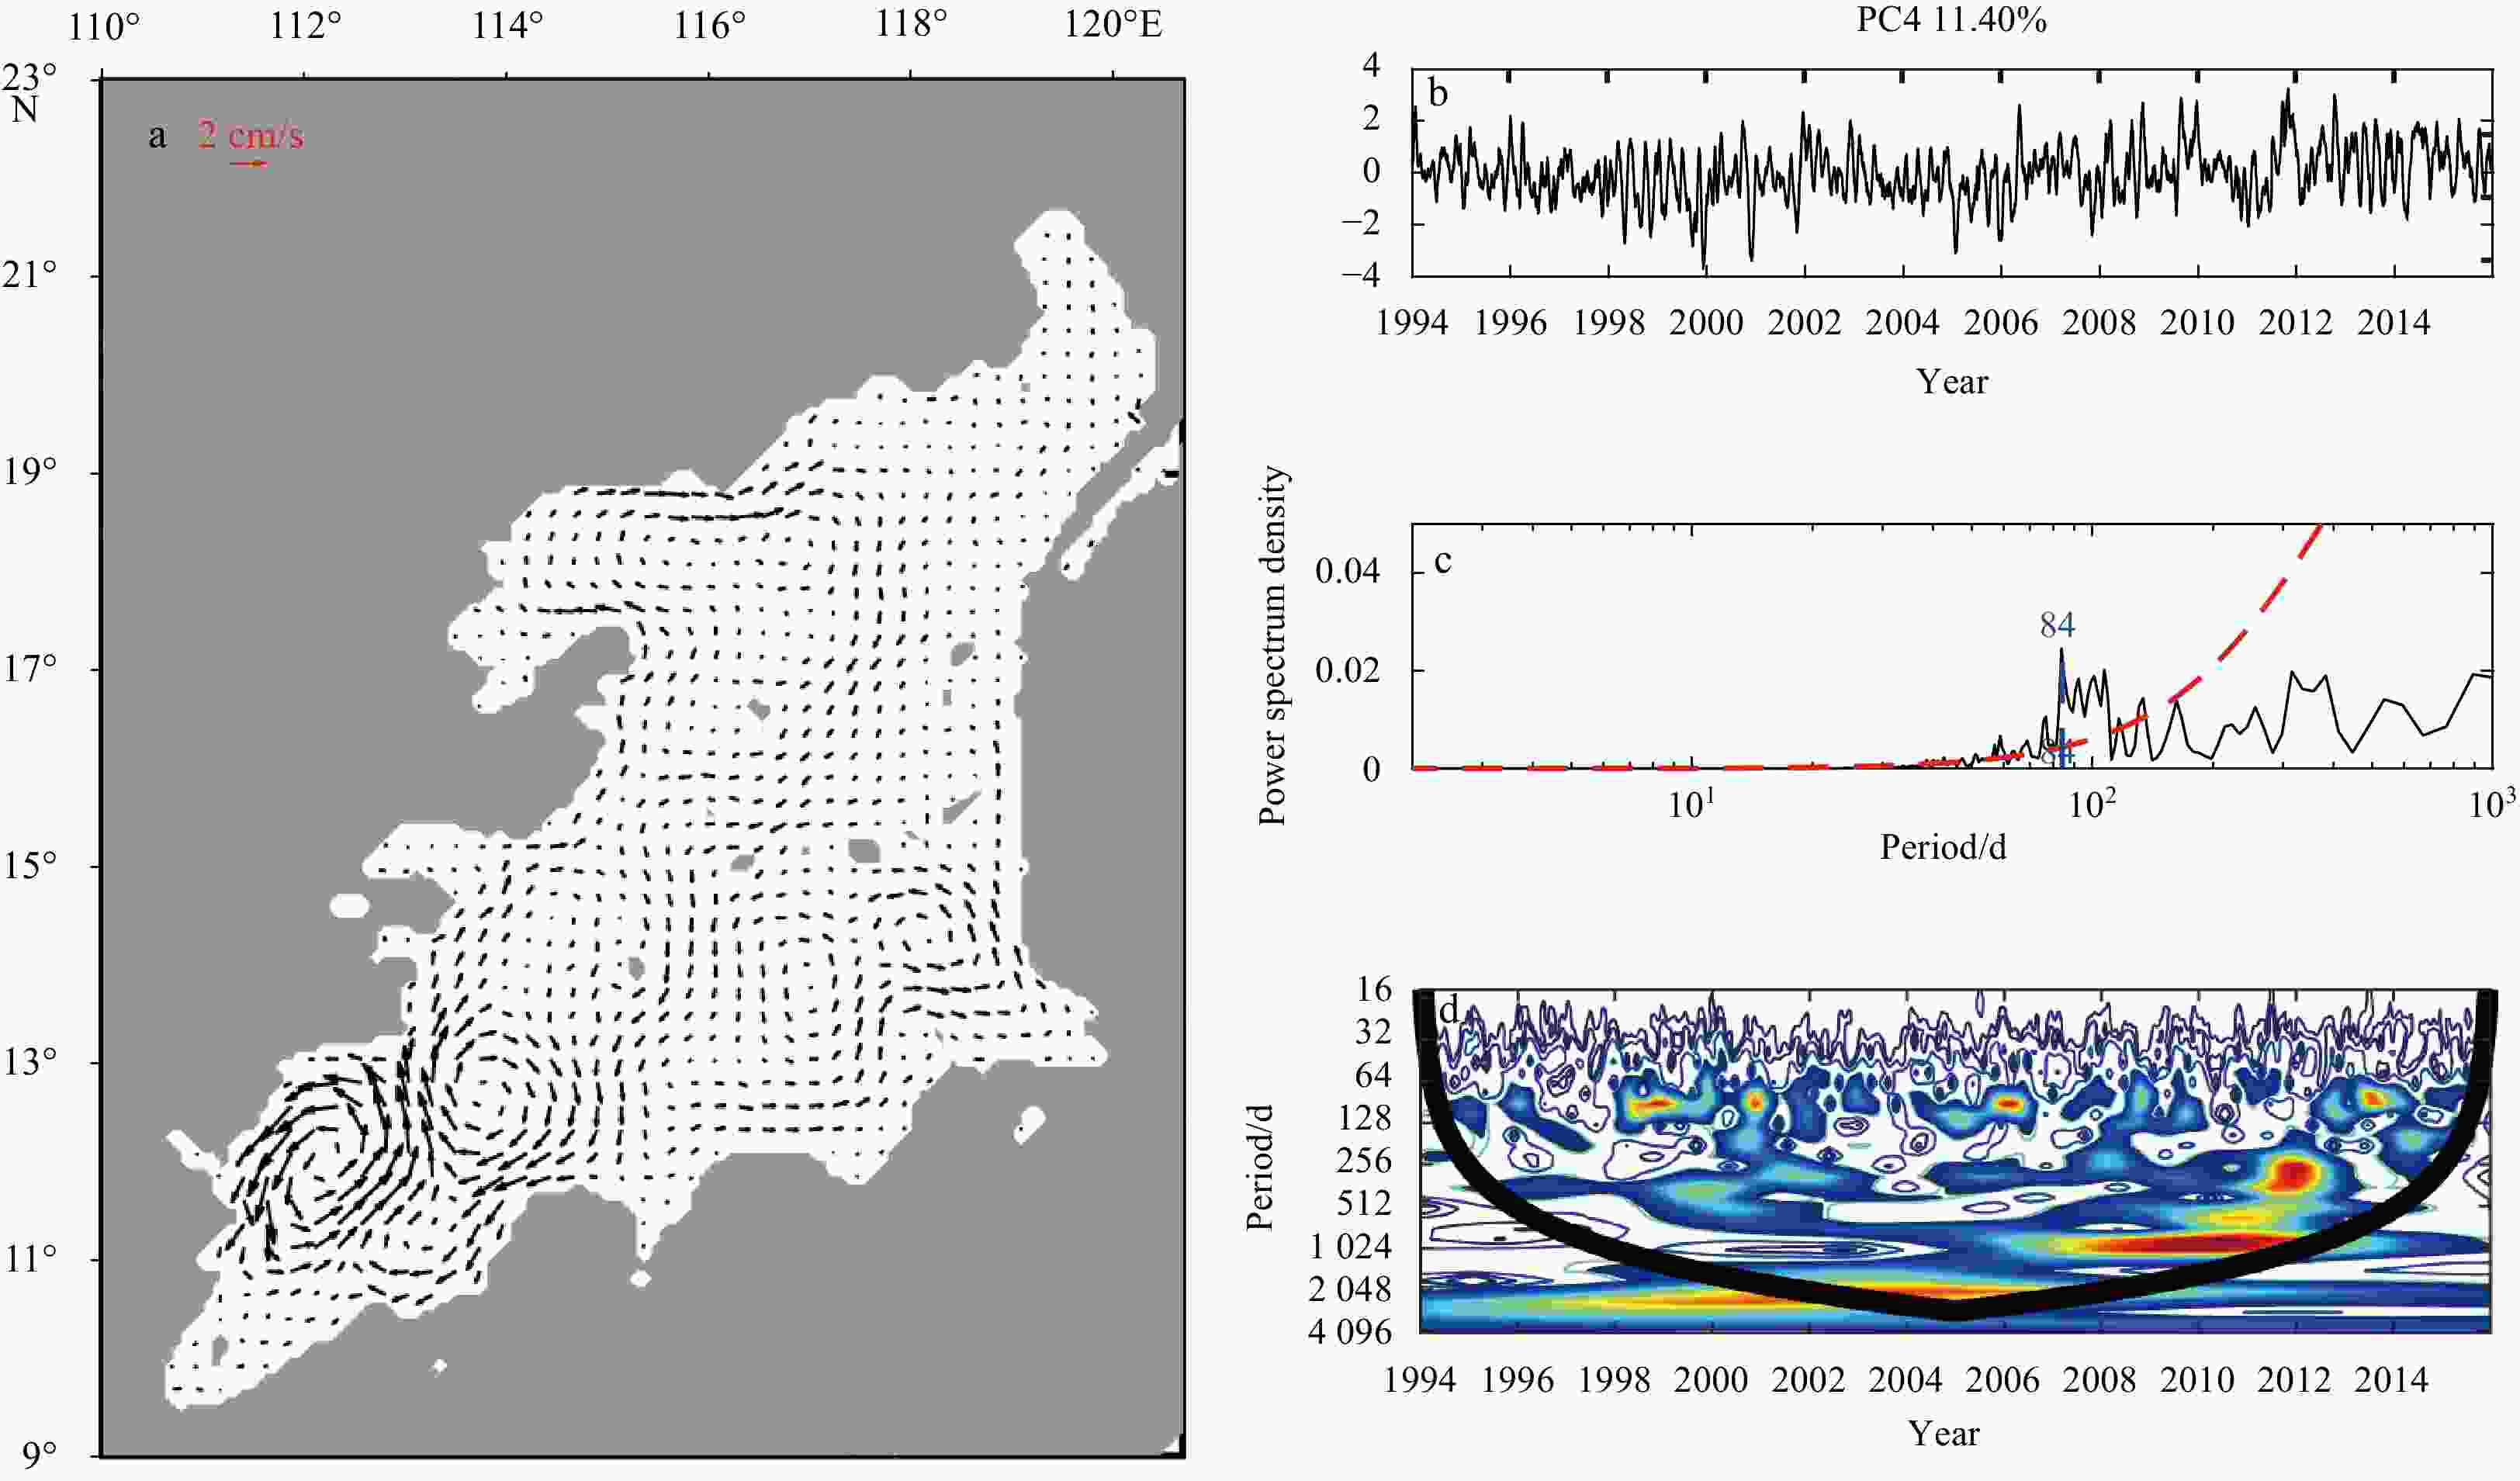
Figure 9. Spatial structure (a), temporal variation (b), associated power spectrum density (c) and wavelet analysis (d) of the fourth VEOF mode.

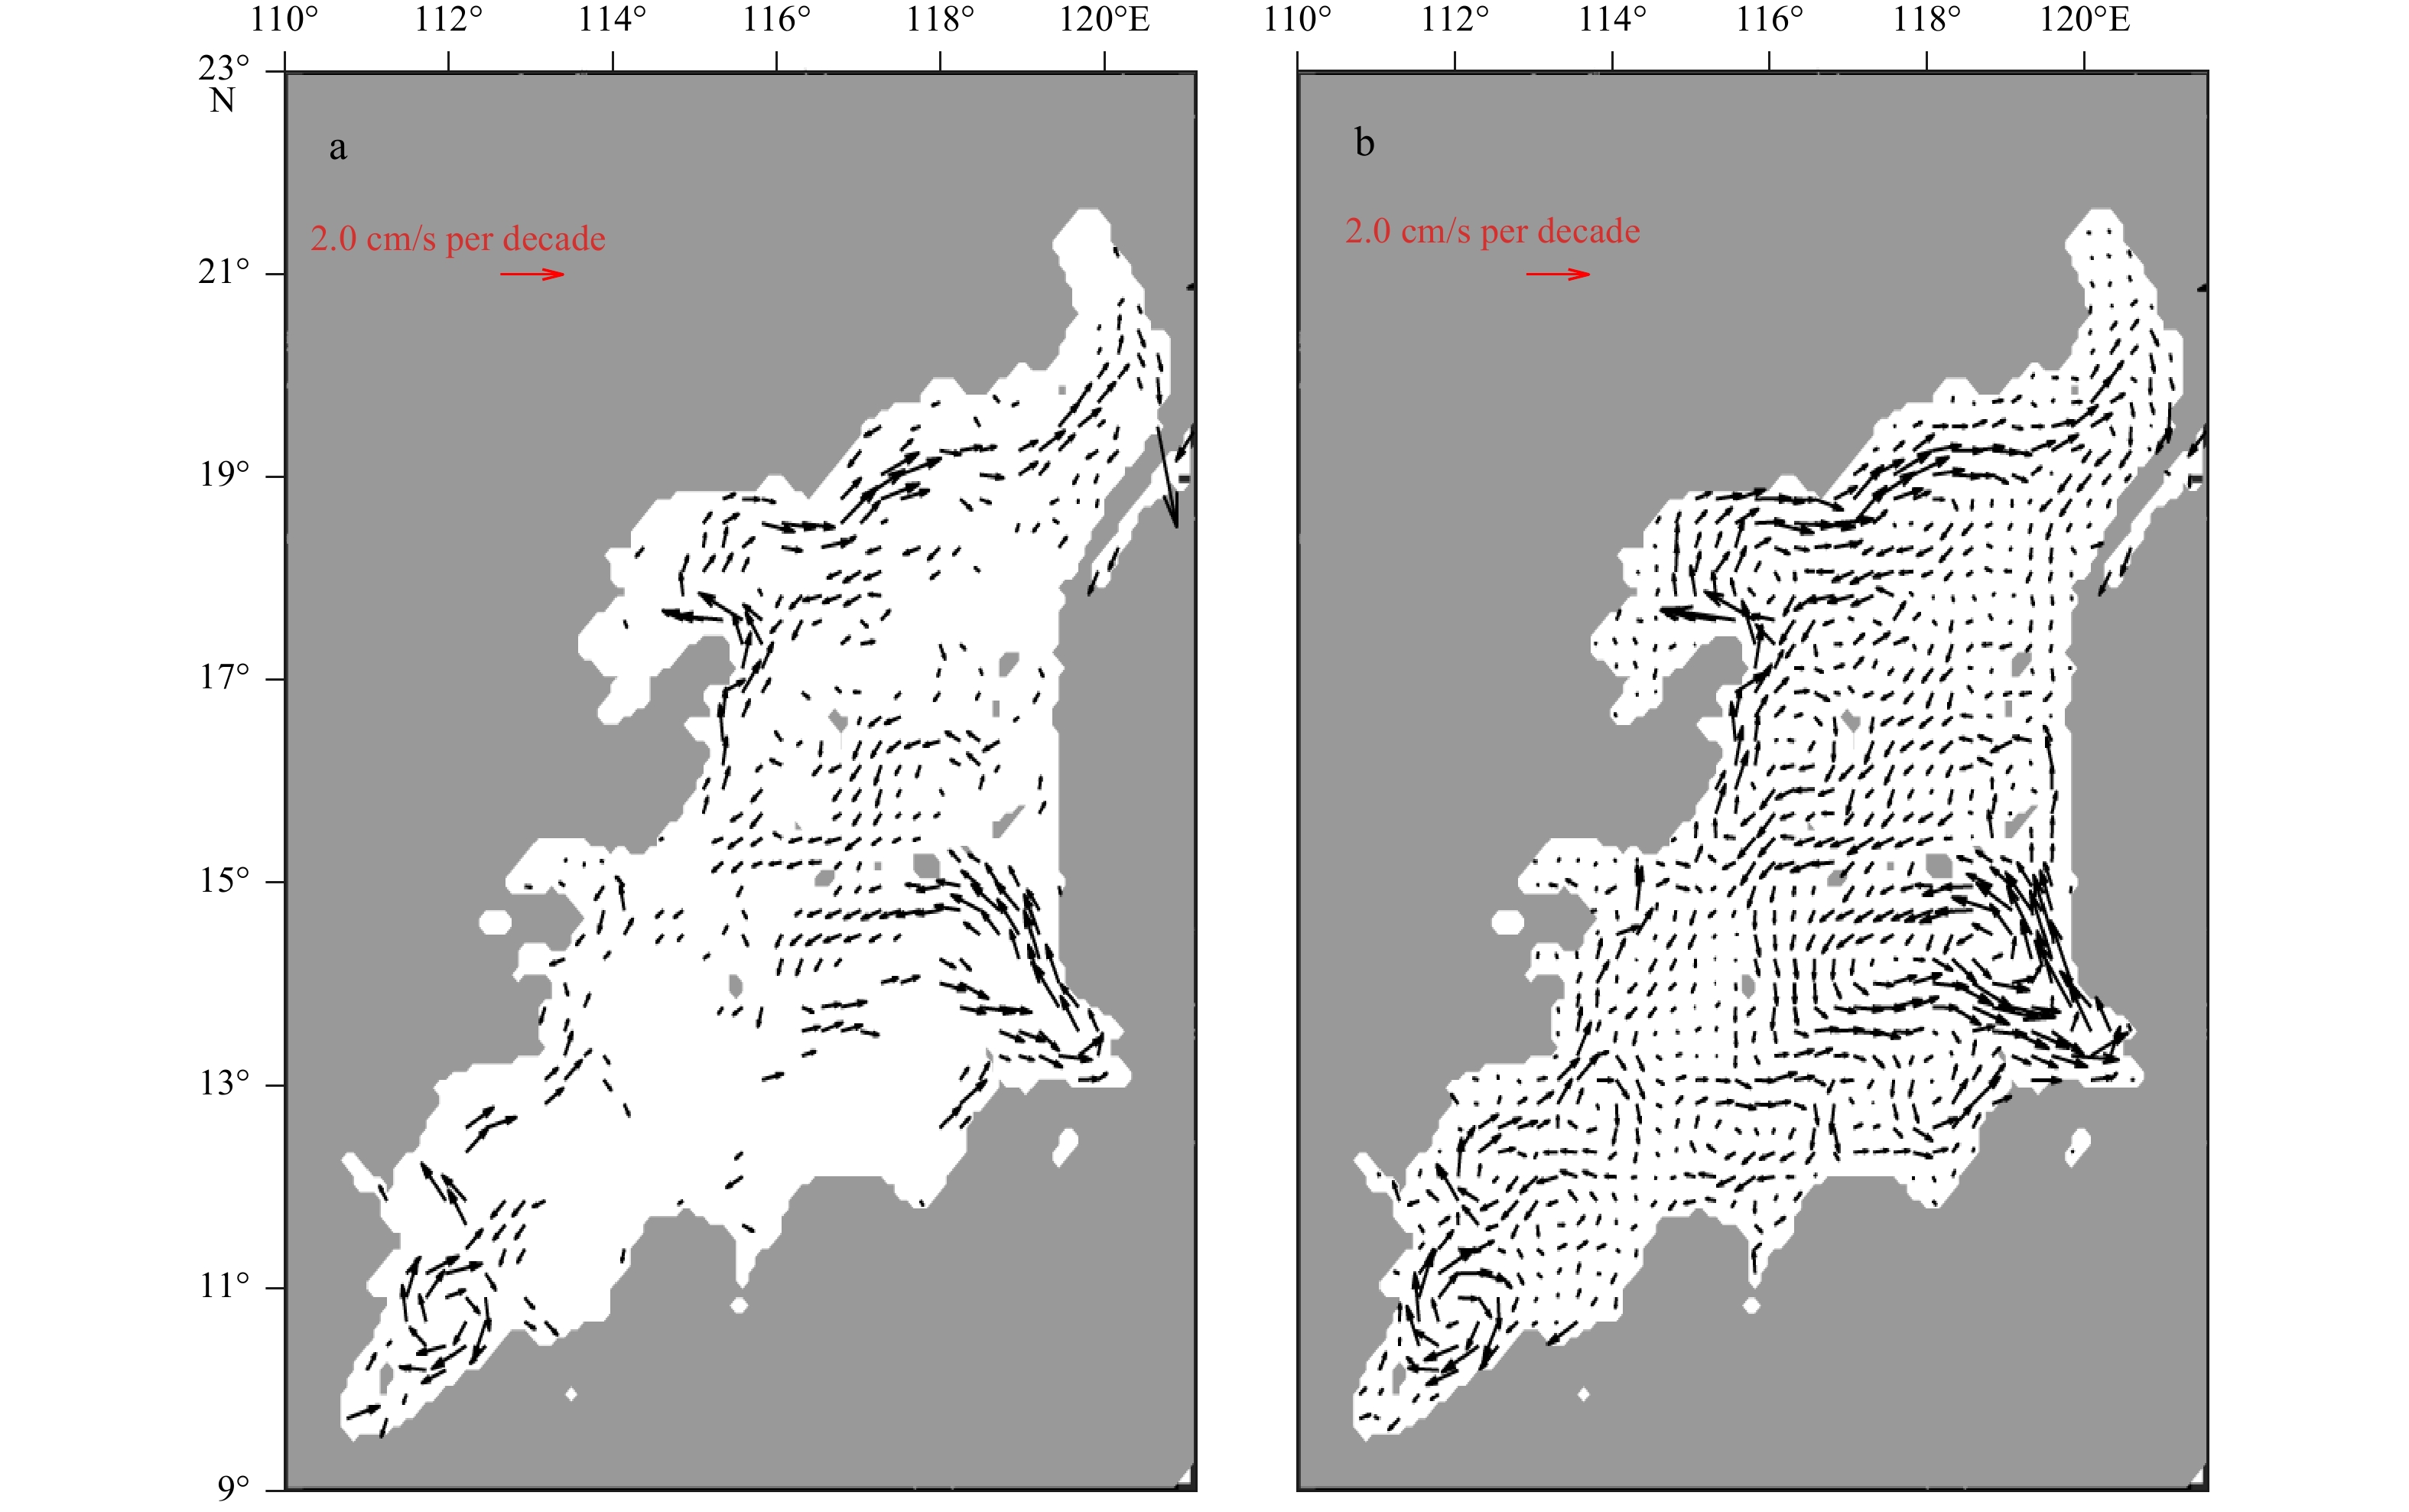
Figure 10. The linear trend of current velocity (a), and decadal change of deep circulation (b) (2006–2015 mean minus 1996–2005 mean). In a, only the trend above the 95% confidence level is presented.
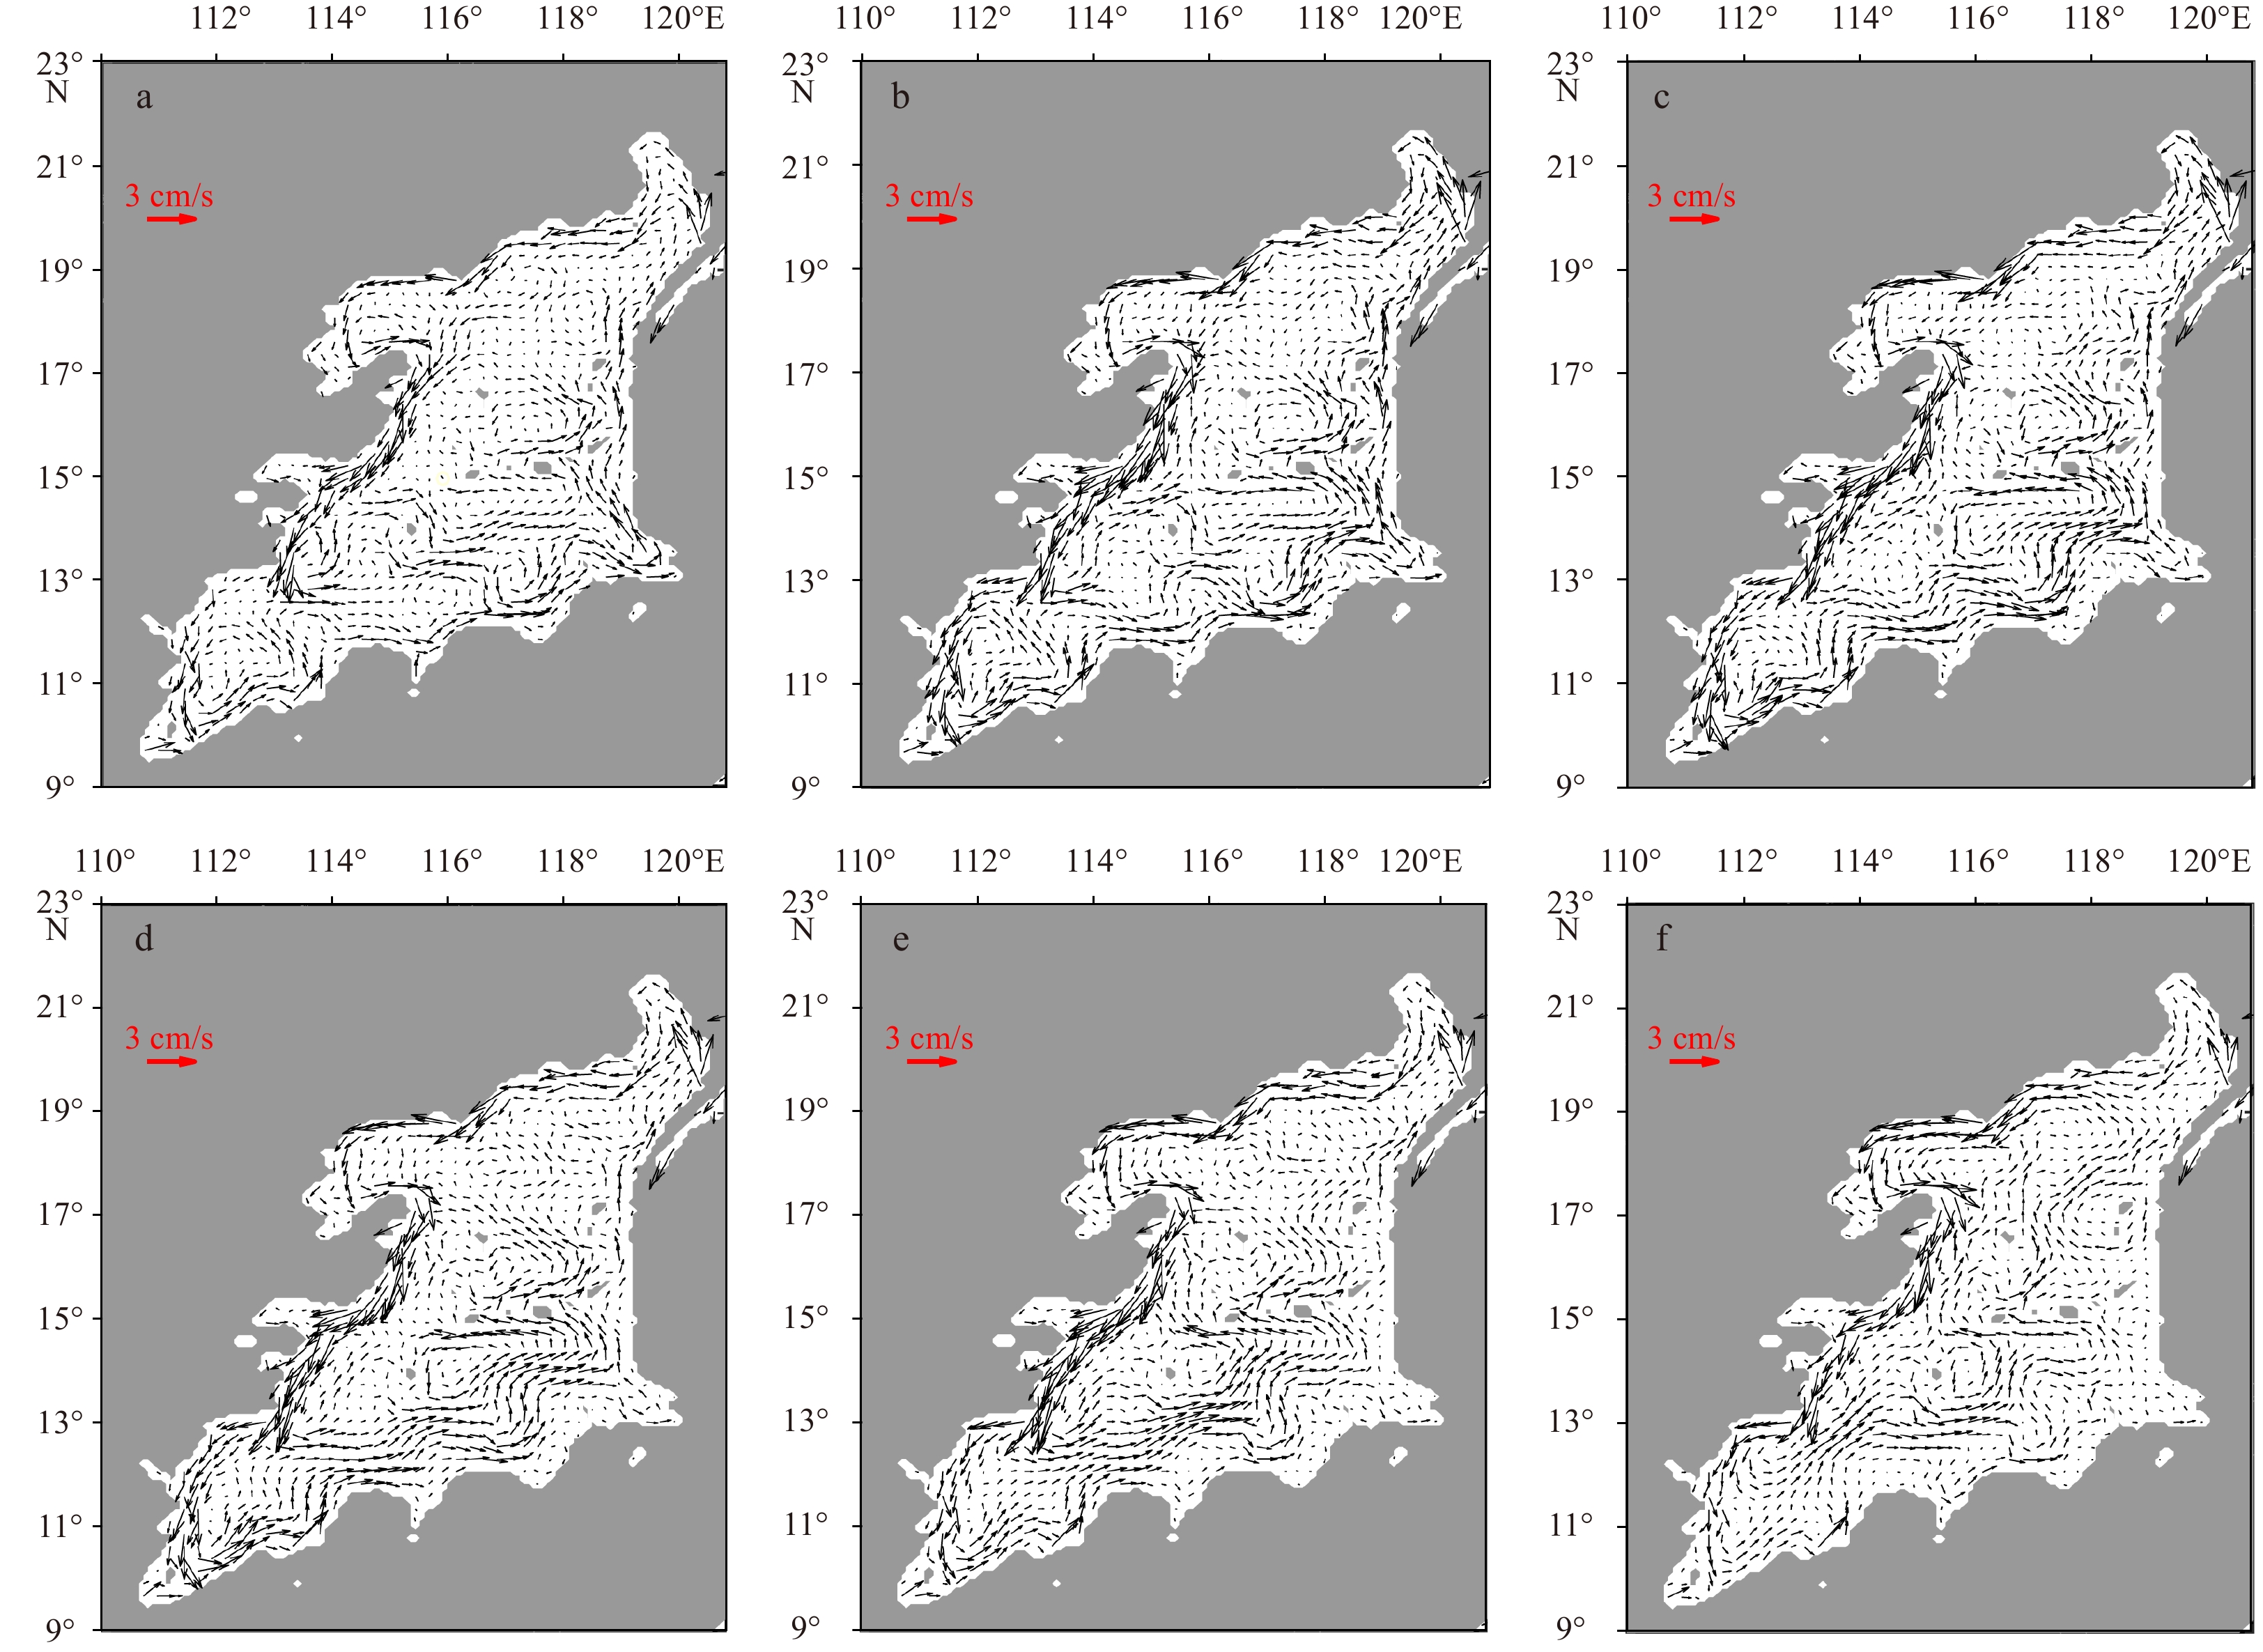
A1. Monthly mean circulation averaged between 2 500 m and 4 000 m in December (a), January (b), February (c), March (d), April (e), and May (f).
-
[1] Chao S Y, Shaw P T, Wu S Y. 1996. Deep water ventilation in the South China Sea. Deep-Sea Research Part I: Oceanographic Research Papers, 43(4): 445–466. [2] Fang Guohong, Chen Haiying, Wei Zexun, et al. 2006. Trends and interannual variability of the South China Sea surface winds, surface height, and surface temperature in the recent decade. Journal of Geophysical Research: Oceans, 111(C11): C11S16. doi: 10.1029/2005JC003276 [3] Gan Jianping, Liu Zhiqiang, Hui C R. 2016a. A three-layer alternating spinning circulation in the South China Sea. Journal of Physical Oceanography, 46(8): 2309–2315. [4] Gan Jianping, Liu Zhiqiang, Liang Linlin. 2016b. Numerical modeling of intrinsically and extrinsically forced seasonal circulation in the China Seas: A kinematic study. Journal of Geophysical Research: Oceans, 121(7): 4697–4715. [5] Koelling J, Send U, Lankhorst M. 2020. Decadal strengthening of interior flow of North Atlantic Deep Water observed by GRACE satellites. Journal of Geophysical Research: Oceans, 125(11): e2020JC016217. doi: 10.1029/2020JC016217 [6] Lan Jian, Wang Yu, Cui Fengjuan, et al. 2015. Seasonal variation in the South China Sea deep circulation. Journal of Geophysical Research: Oceans, 120(3): 1682–1690 [7] Lan Jian, Zhang Ningning, Wang Yu. 2013. On the dynamics of the South China Sea deep circulation. Journal of Geophysical Research: Oceans, 118(3): 1206–1210. [8] Li Li, Qu Tangdong. 2006. Thermohaline circulation in the deep South China Sea basin inferred from oxygen distributions. Journal of Geophysical Research: Oceans, 111(C5): C05017. doi: 10.1029/2005JC003164 [9] Qu Tangdong, Girton J B, Whitehead J A. 2006. Deepwater overflow through Luzon Strait. Journal of Geophysical Research: Oceans, 111(C1): C01002. doi: 10.1029/2005JC003139 [10] Shao Lei, Li Xuejie, Geng Jianhua, et al. 2007. Deep water bottom current deposition in the northern South China Sea. Science in China Series D: Earth Sciences, 50(7): 1060–1066 [11] Shu Yeqiang, Xue Huijie, Wang Dongxiao, et al. 2014. Meridional overturning circulation in the South China Sea envisioned from the high-resolution global reanalysis data GLBa0.08. Journal of Geophysical Research: Oceans, 119(5): 3012–3028. [12] Tian Jiwei, Yang Qingxuan, Zhao Wei. 2009. Enhanced diapycnal mixing in the South China Sea. Journal of Physical Oceanography, 39(12): 3191–3203 [13] Wang J. 1986. Observation of abyssal flows in the Northern South China Sea. Acta Oceanographica Taiwanica, 16: 36– 45 [14] Wang Yonggang, Fang Guohong, Wei Zexun, et al. 2006. Interannual variation of the South China Sea circulation and its relation to El Niño, as seen from a variable grid global ocean model. Journal of Geophysical Research: Oceans, 111(C11): C11S14 [15] Wang Guihua, Xie Shangping, Qu Tangdong, et al. 2011. Deep South China Sea circulation. Geophysical Research Letters, 38(5): L05601. doi: 10.1029/2010GL046626 [16] Wang Bin, Zhao Wei. 2013. The influence of horizontal resolution on the numerical simulation of deep water circulation in Luzon Strait. Periodical of Ocean University of China, 43(4): 1–8 [17] Wu C R, Shaw P T, Chao S Y. 1998. Seasonal and interannual variations in the velocity field of the South China Sea. Journal of Oceanography, 54(4): 361–372 [18] Wyrtki K. 1961. Scientific results of marine investigations of the South China Sea and the Gulf of Thailand 1959– 1961: Physical oceanography of the Southeast Asian waters. La Jolla, CA, USA: Scripps Institute of Oceanography [19] Xiao Jingen, Xie Qiang, Liu Changjian, et al. 2013. A diagnostic model of the South China Sea bottom circulation in consideration of tidal mixing, eddy-induced mixing and topography. Haiyang Xuebao (in Chinese), 35(5): 1–13. [20] Xie Qiang, Xiao Jingen, Wang Dongxiao, et al. 2013. Analysis of deep-layer and bottom circulations in the South China Sea based on eight quasi-global ocean model outputs. Chinese Science Bulletin, 58(23): 4000–4011. [21] Xu Fanghua, Oey L Y. 2014. State analysis using the Local Ensemble Transform Kalman Filter (LETKF) and the three-layer circulation structure of the Luzon Strait and the South China Sea. Ocean Dynamics, 64(6): 905–923. [22] Xu Tengfei, Wei Zexun, Susanto R D, et al. 2021. Observed water exchange between the South China Sea and Java Sea through Karimata Strait. Journal of Geophysical Research: Oceans, 126(2): e2020JC016608. doi: 10.1029/2020JC016608 [23] Yuan Dongliang. 2002. A numerical study of the South China Sea deep circulation and its relation to the Luzon Strait transport. Acta Oceanologica Sinica, 21(2): 187–202 [24] Zhang Zhiwei, Zhao Wei, Tian Jiwei, et al. 2015. Spatial structure and temporal variability of the zonal flow in the Luzon Strait. Journal of Geophysical Research: Oceans, 120(2): 759–776. [25] Zhao Wei, Zhou Chun, Tian Jiwei, et al. 2014. Deep water circulation in the Luzon Strait. Journal of Geophysical Research: Oceans, 119(2): 790–804. [26] Zheng Hua, Zhang Chuanzheng, Zhao Ruixiang, et al. 2021. Structure and variability of abyssal current in northern South China Sea based on CPIES observations. Journal of Geophysical Research: Oceans, 126(4): e2020JC016780. doi: 10.1029/2020JC016780 [27] Zhou Chun, Zhao Wei, Tian Jiwei, et al. 2014. Variability of the deep-water overflow in the Luzon Strait. Journal of Physical Oceanography, 44(11): 2972–2986 [28] Zhou Chun, Zhao Wei, Tian Jiwei, et al. 2017. Deep western boundary current in the South China Sea. Scientific Reports, 7(1): 9303. doi: 10.1038/s41598-017-09436-2 [29] Zhou Chun, Zhao Wei, Tian Jiwei, et al. 2018. Observations of deep current at the western boundary of the Northern Philippine Basin. Scientific Reports, 8(1): 14334. doi: 10.1038/s41598-018-32541-9 [30] Zhu Yaohua, Sun Junchuan, Wang Yonggang, et al. 2017a. Effect of potential vorticity flux on the circulation in the South China Sea. Journal of Geophysical Research: Oceans, 122(8): 6454–6469. [31] Zhu Yaohua, Sun Junchuan, Wang Yonggang, et al. 2019. Overview of the multi-layer circulation in the South China Sea. Progress in Oceanography, 175: 171–182. [32] Zhu Yaohua, Sun Junchuan, Wei Zexun, et al. 2017b. A fresh look at the deepwater overflow in the Luzon Strait. Acta Oceanologica Sinica, 36(5): 1–8. -

 下载:
下载:


 点击查看大图
计量
- 文章访问数: 382
- HTML全文浏览量: 130
- PDF下载量: 34
- 被引次数: 0

