

-
Abstract: Deep water in the South China Sea is renewed by the cold and dense Luzon Strait overflow. However, from where and how the deep water upwells is poorly understood yet. Based on the Hybrid Coordinate Ocean Model reanalysis data, vertical velocity is derived to answer these questions. Domain-integrated vertical velocity is of two maxima, one in the shallow water and the other at depth, and separated by a layer of minimum at the bottom of the thermocline. Further analysis shows that this two-segmented vertical transport is attributed to the vertical compensation of subsurface water to the excessive outflow of shallow water and upward push of the dense Luzon Strait overflow, respectively. In the abyssal basin, the vertical transport increases upward from zero at the depth of 3 500–4 000 m and reaches a maximum of 1.5×10⁶ m3/s at about 1 500 m. Deep water upwells mainly from the northeastern and southwestern ends of the abyssal basin and off the continental slopes. To explain the upward velocity arising from slope breaks, a possible mechanism is proposed that an onshore velocity component can be derived from the deep western boundary current above steep slopes under bottom friction.
-
Key words:
- vertical velocity /
- vertical transport /
- Luzon Strait overflow /
- South China Sea
-
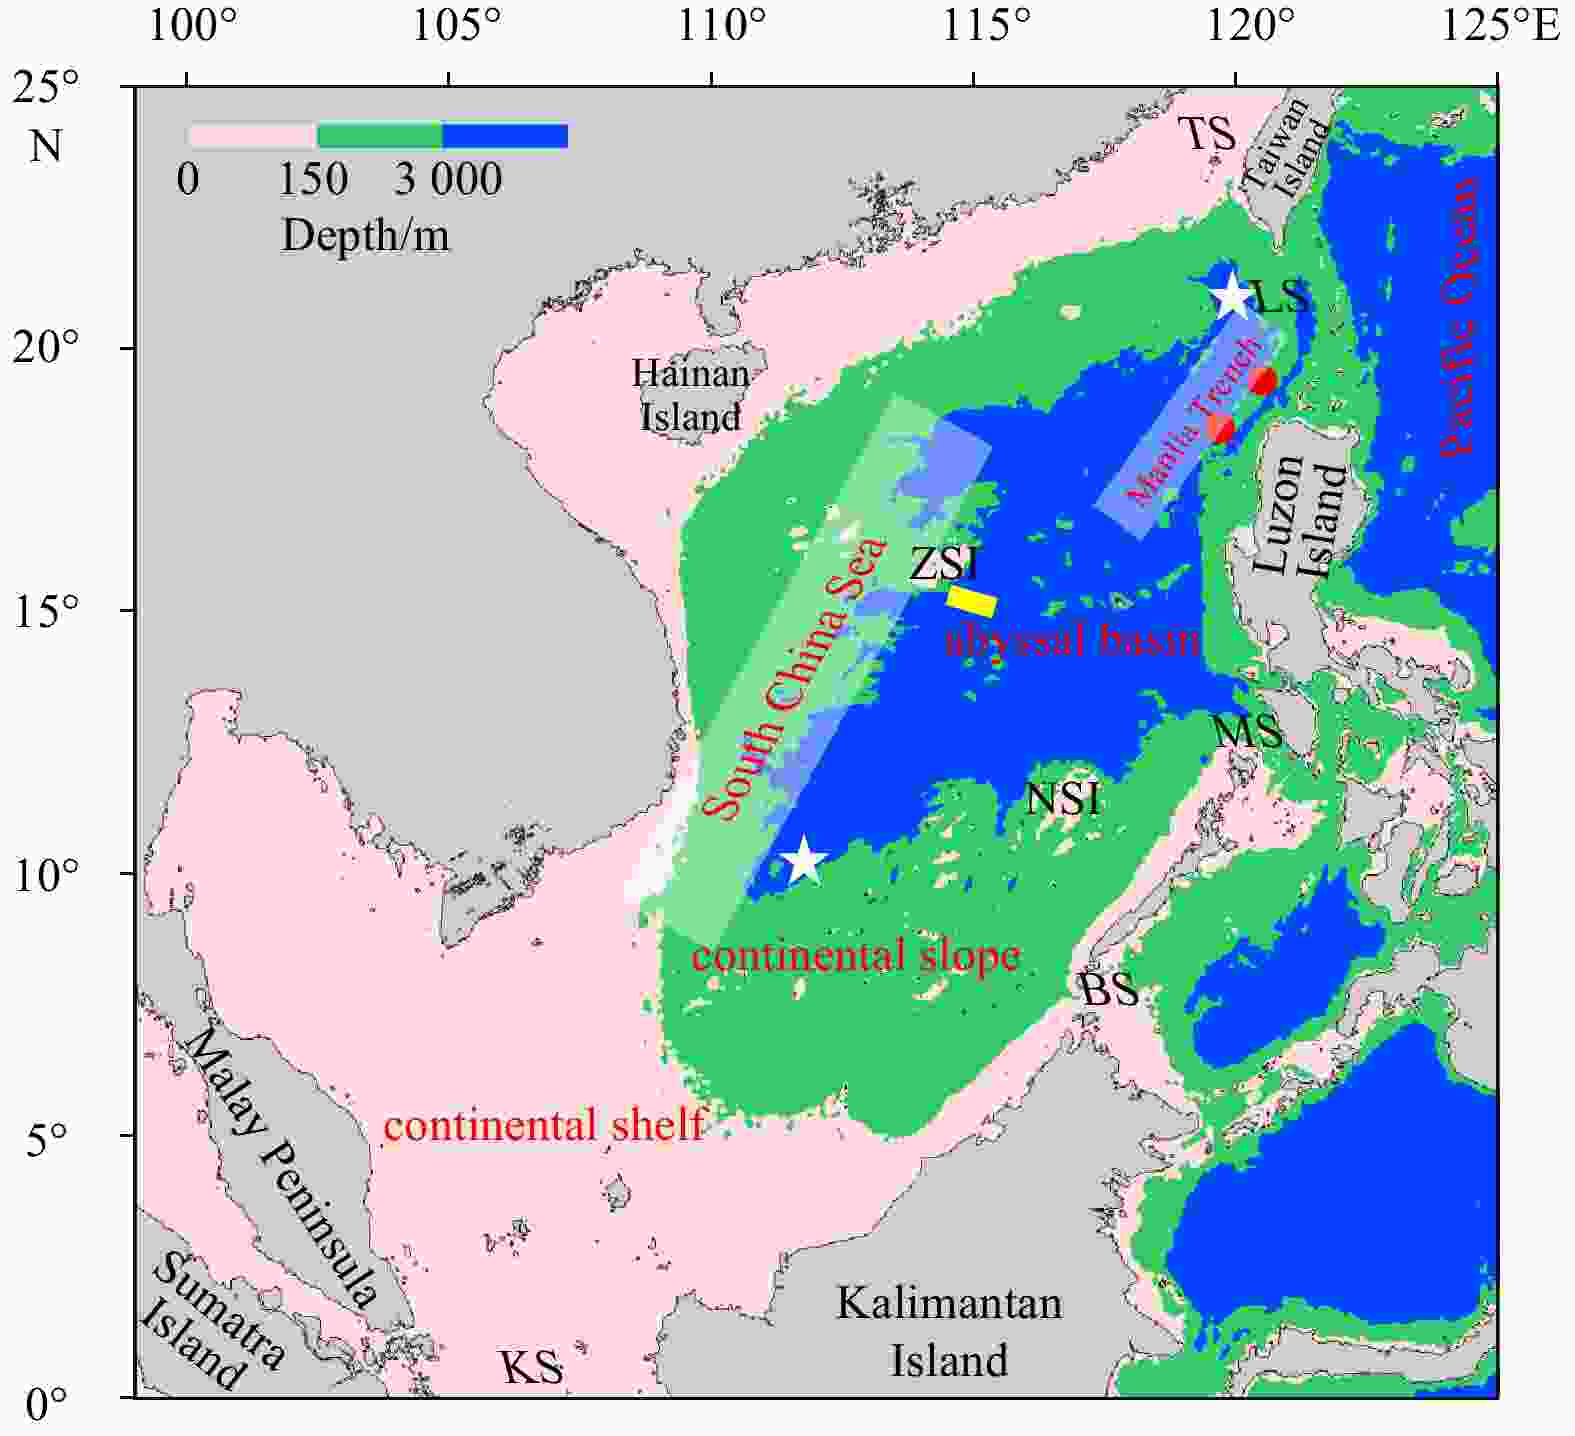
Figure 1. Topography of the South China Sea. The abbreviations LS, TS, KS, MS, BS denote the Luzon Strait, Taiwan Strait, Karimata Strait, Mindoro Strait, Balabac Strait, respectively; and ZSI and NSI denote the Zhongsha Islands and Nansha Islands, respectively. Yellow line indicates the mooring section deployed off the Zhongsha Islands in Zhou et al. (2017). White stars represent the northern and southern ends of the abyssal basin below 3 000 m, where the abyssal water upwells. Red dots stand for gaps in the Heng-Chun Ridge, through which the Luzon Strait overflow sinks into the Manila Trench.
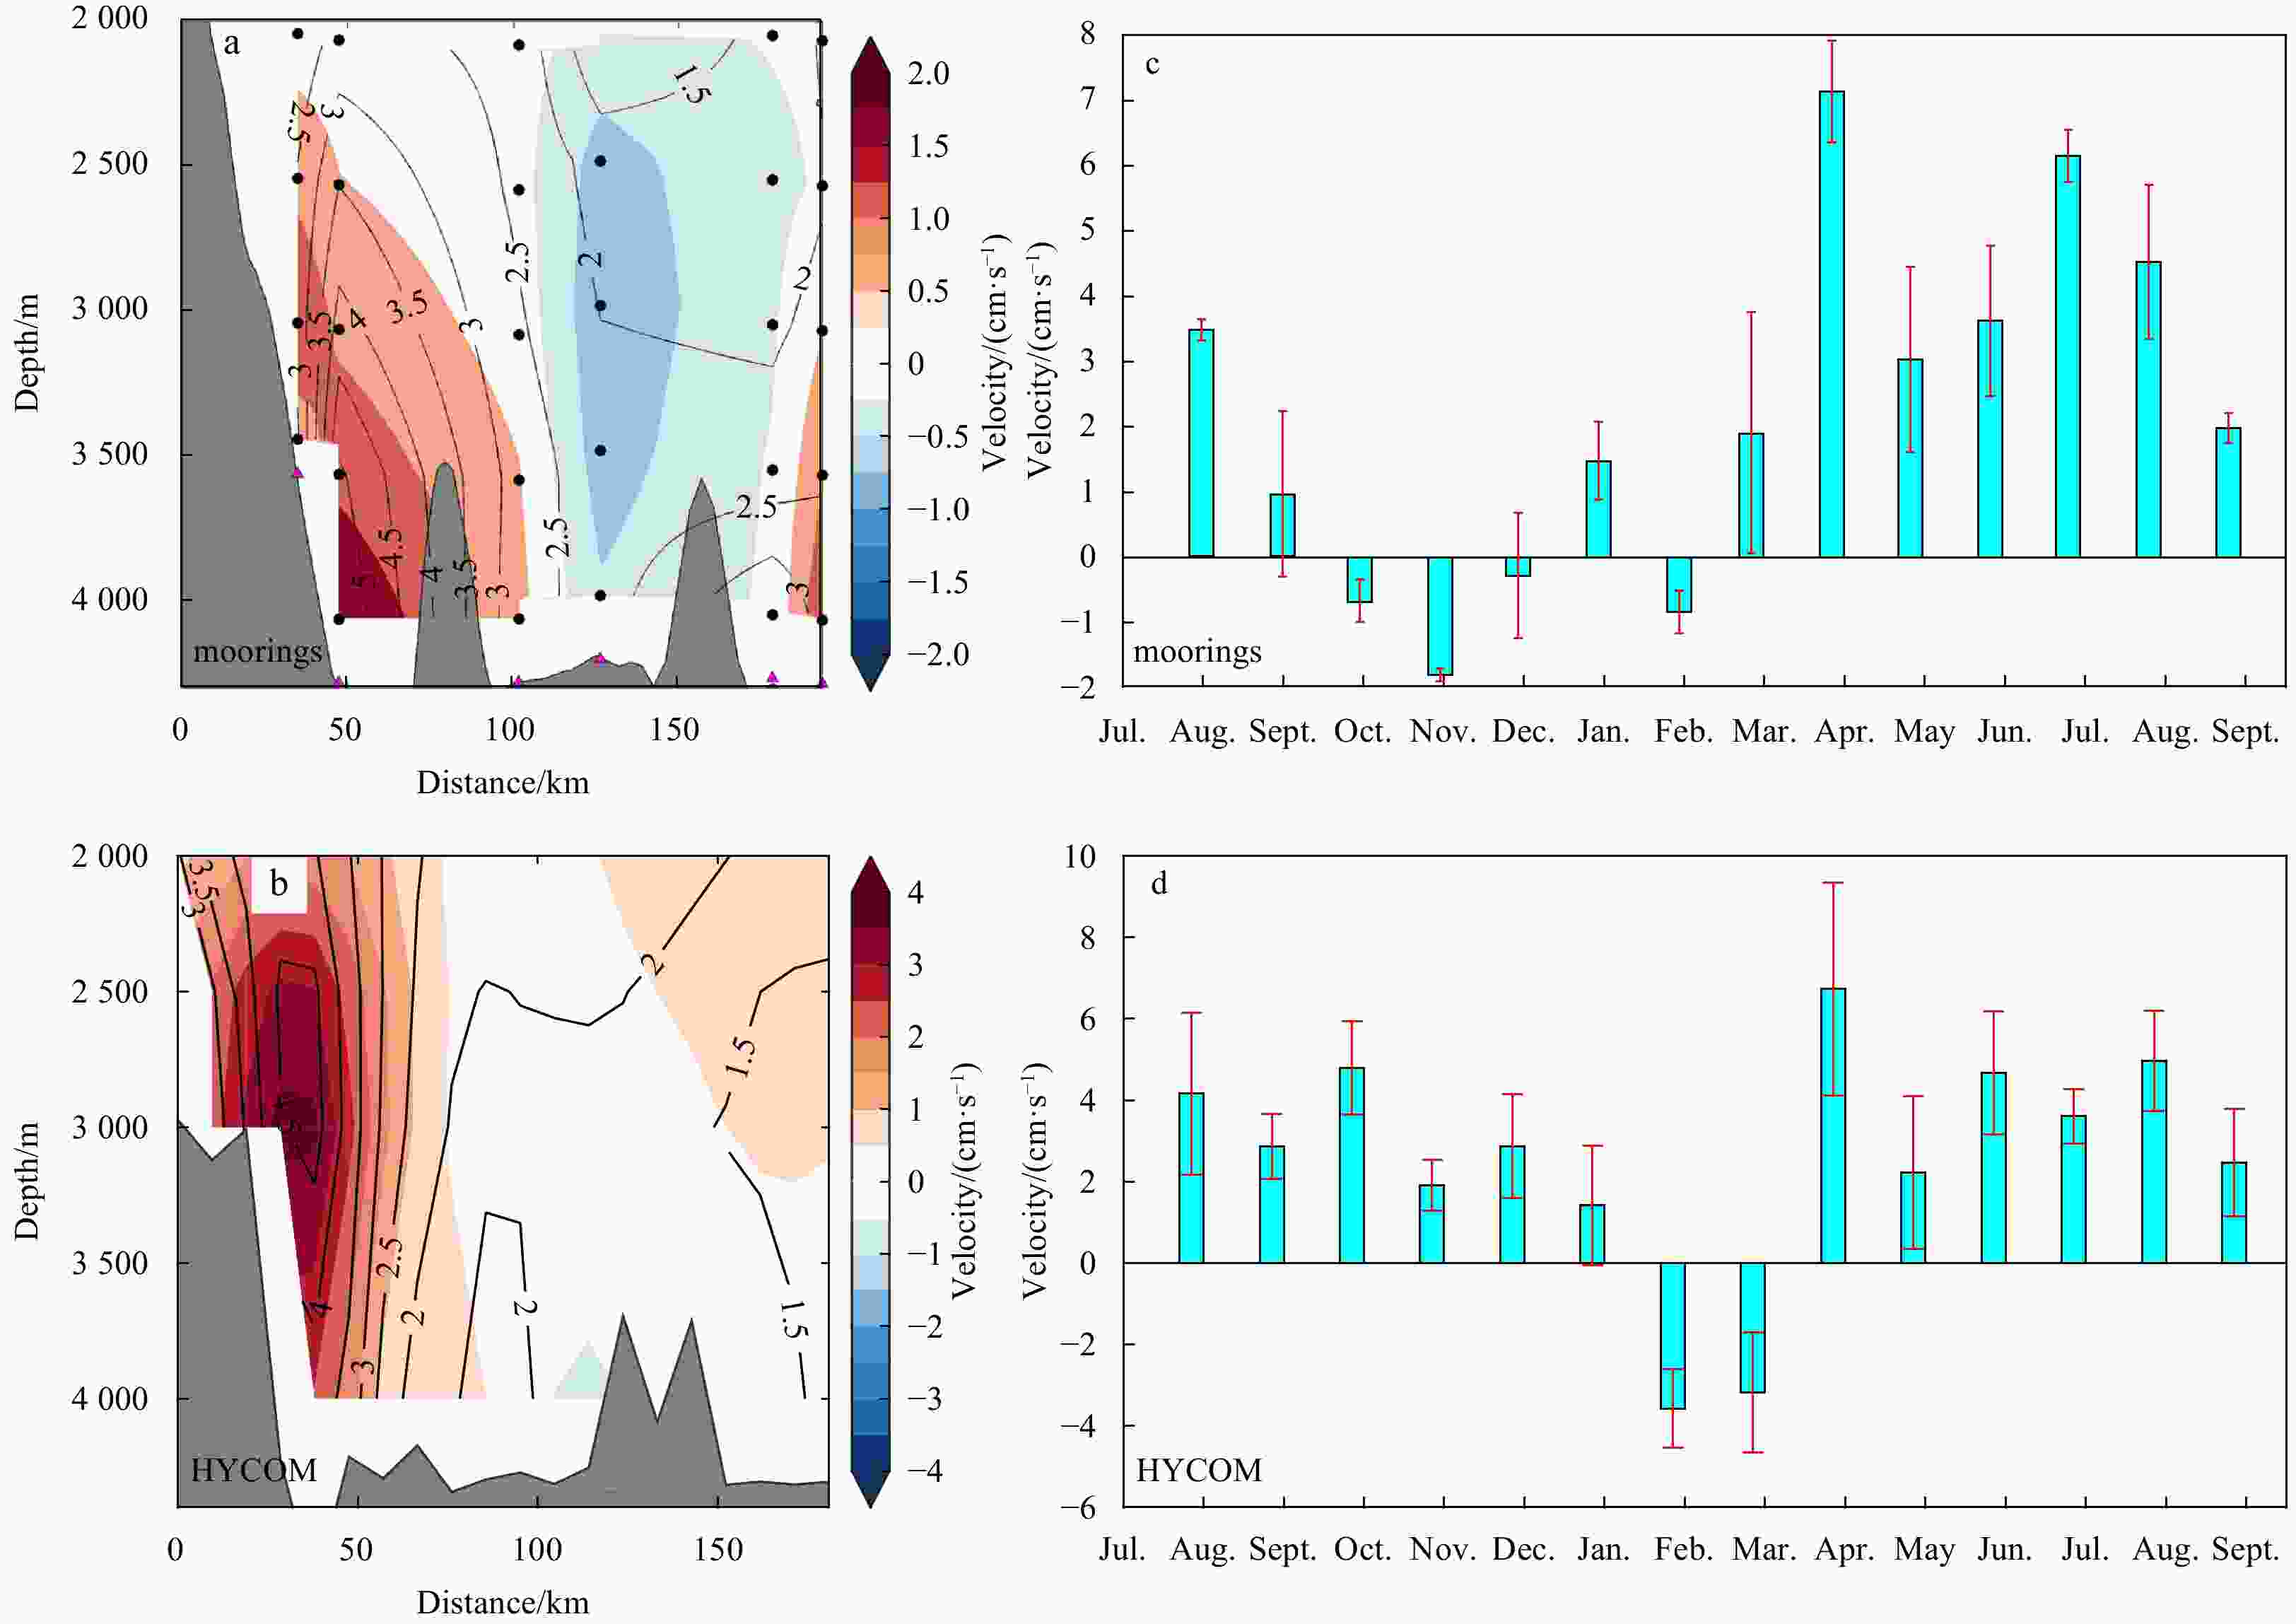
Figure 2. Time-mean alongshore velocity in the deep western boundary current (DWBC) east of Zhongsha Islands from mooring observations (a), after Zhou et al. (2017), and HYCOM GOFS3.1 reanalysis (b). In a and b, color shading indicates the time-mean velocity, positive southwestward. Gray shading represents the topography. Black lines stand for the standard deviation of the alongshore velocity. Monthly mean alongshore velocity in the DWBC core east of Zhongsha Islands during August 2012 to September 2013 from mooring observations (c), after Zhou et al. (2017), and HYCOM GOFS3.1 reanalysis (d). In c and d, standard deviations are indicated by red bars.

Figure 3. Comparison of monthly mean transport from the HYCOM GOFS3.1 reanalysis (black) with that from observations (red) in the Karimata Strait (a), and with along channel velocity (red) observed in the Luzon Trough (b). In a, positive transport is flow into the SCS and negative transport is flow into the Java Sea through the Karimata Strait. In b, negative velocity/transport indicates westward flow; bars indicate the standard deviations.

Figure 4. Domain-integrated vertical transport (a) and domain-averaged vertical velocity (b) from the HYCOM GOFS3.1 reanalysis; domain-integrated vertical transport from the HYCOM GOFS3.0 reanalysis (c); separately integrated upward transport and downward transport from the HYCOM GOFS3.1 reanalysis (d).

Figure 5. Time-mean vertical velocity (w) at 50 m (a), and 250 m (b), and time-mean horizontal velocity field at 50 m (c), and 250 m (d). The isobaths at 100 m, 500 m, 1 000 m, 2 000 m, and 3 000 m are indicated.

Figure 6. Alternating bands of the upward-downward velocity (w) seen from vertical sections in the thermocline cell.

Figure 7. Vertical velocity (w) at 50 m (a), and 250 m (b) in winter, and at 50 m (c), and 250 m (d) in summer. The isobaths at 100 m, 500 m, 1 000 m, 2 000 m, and 3 000 m are indicated.
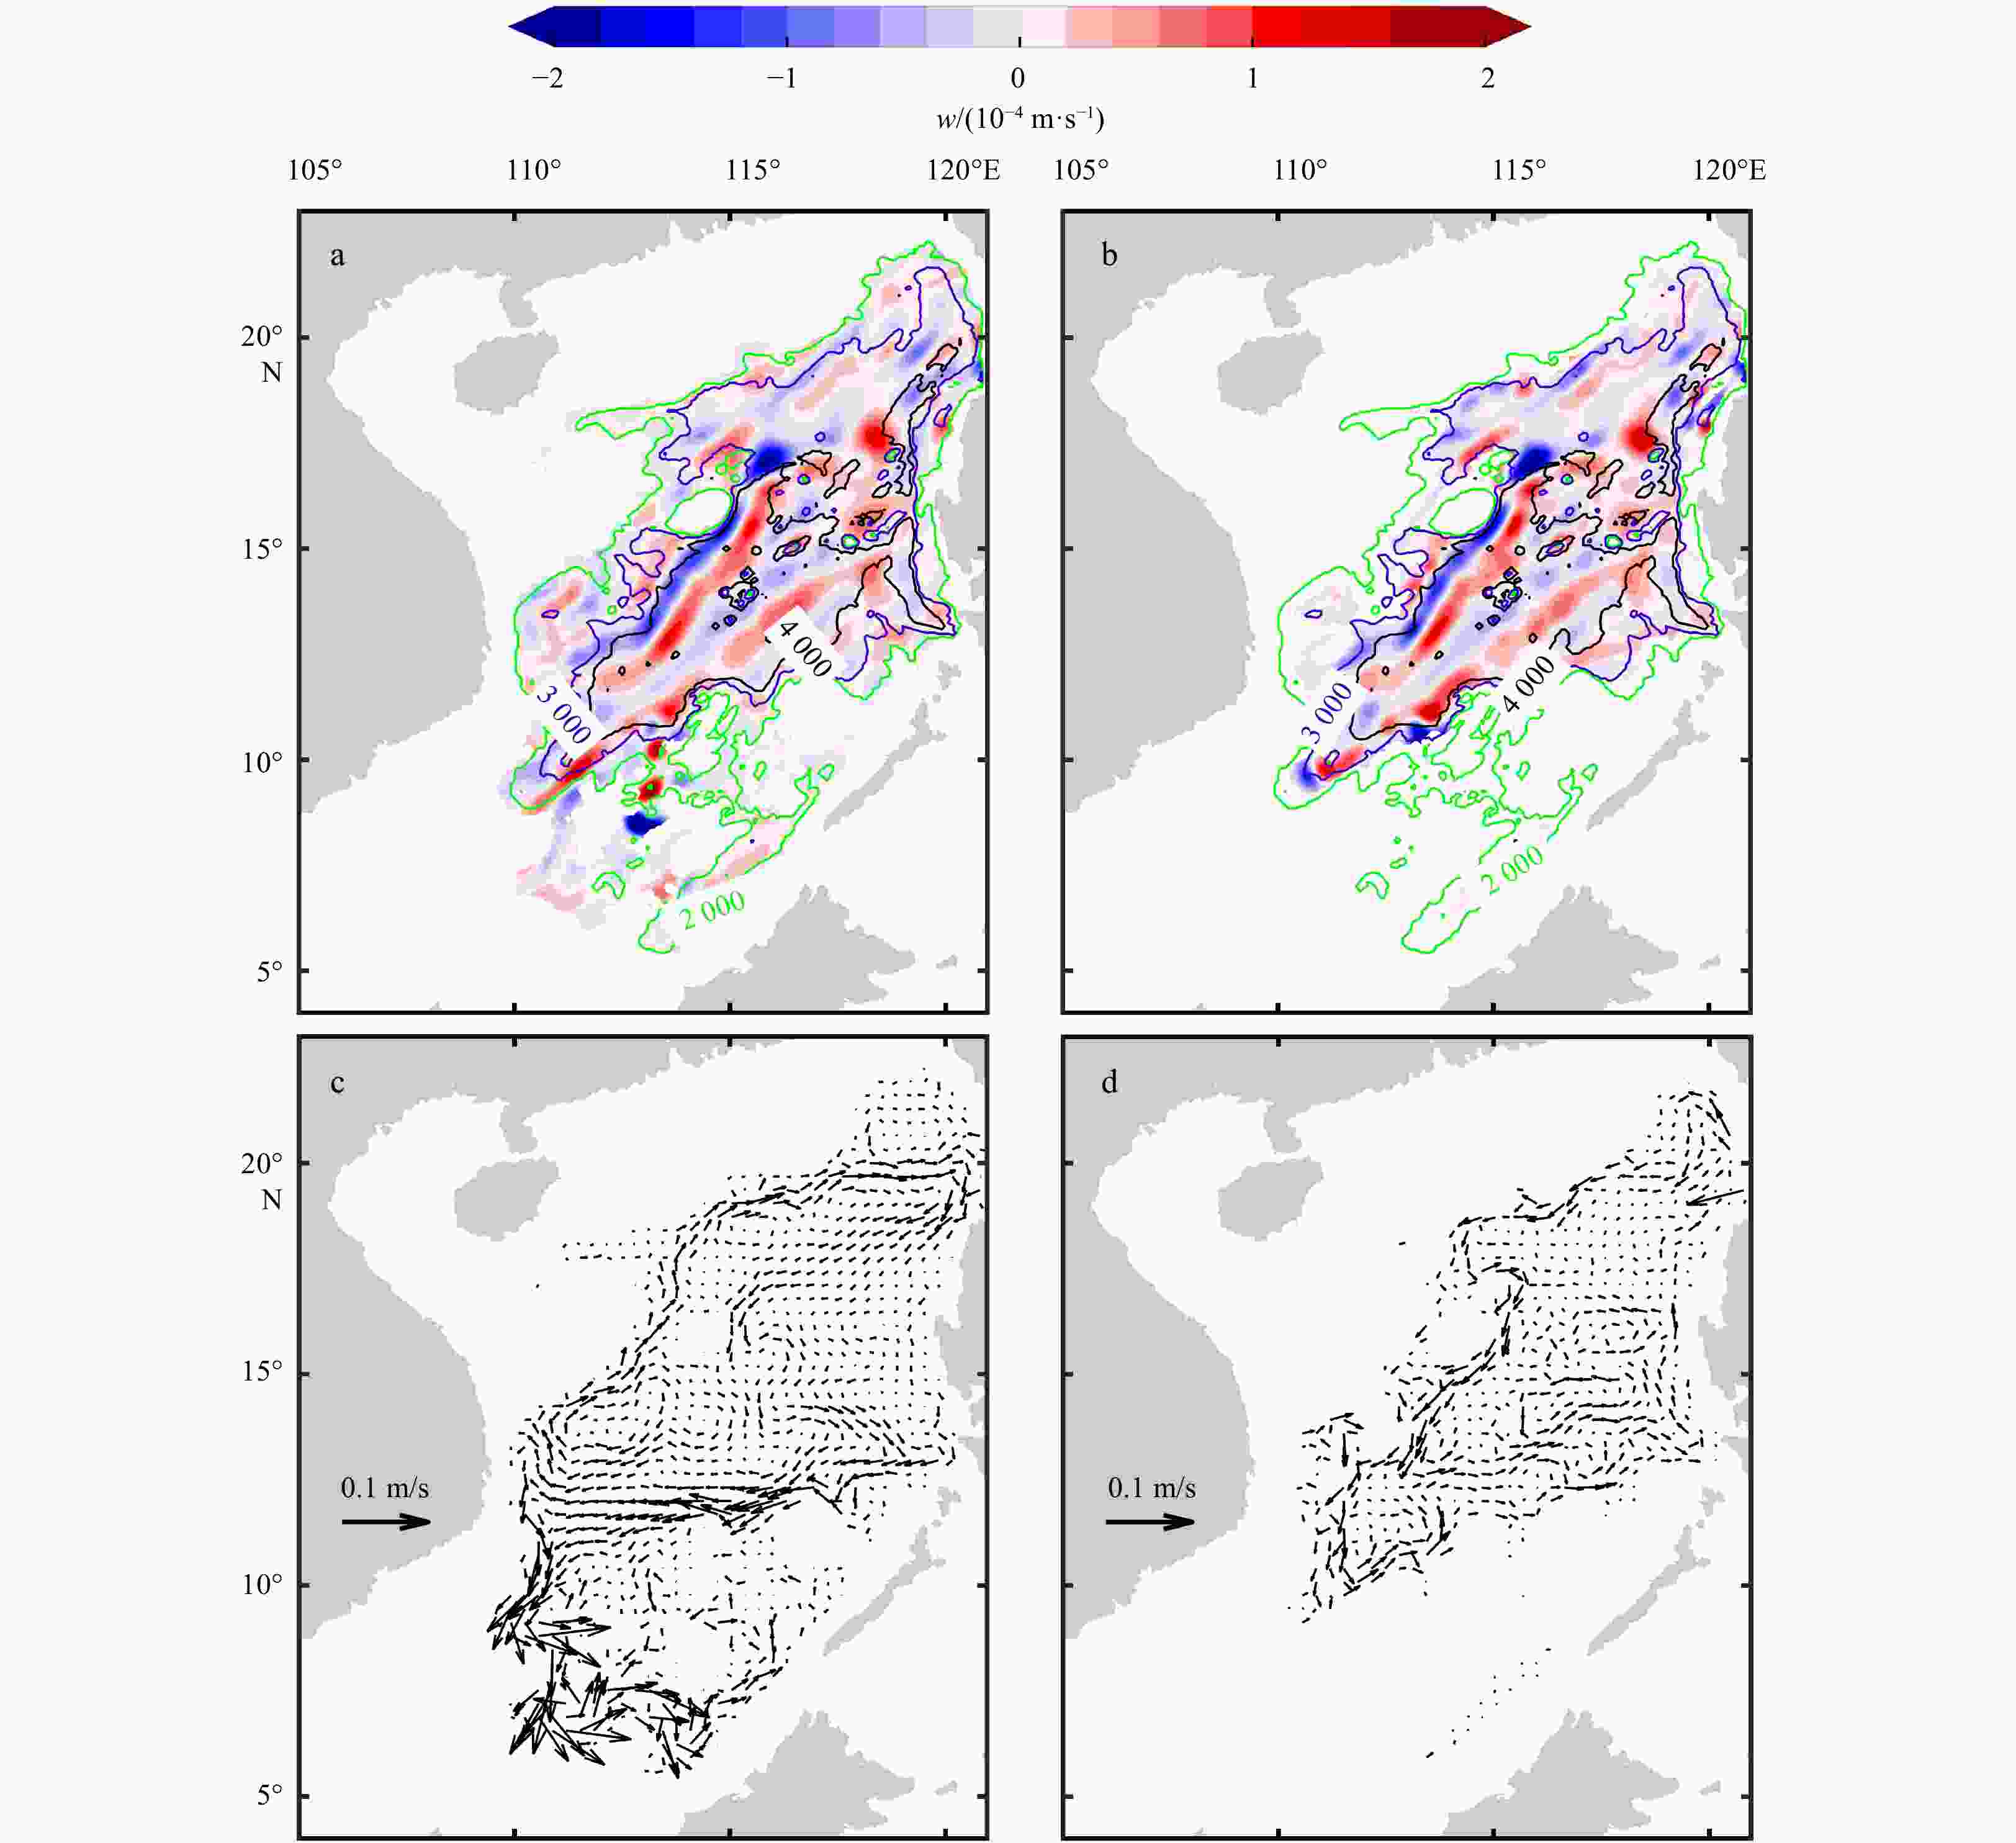
Figure 8. Time-mean vertical velocity (w) at 1 500 m (a), and 2 500 m (b), and associated horizontal velocity field in c and d. The isobaths at 2 000 m, 3 000 m, and 4 000 m are indicated.

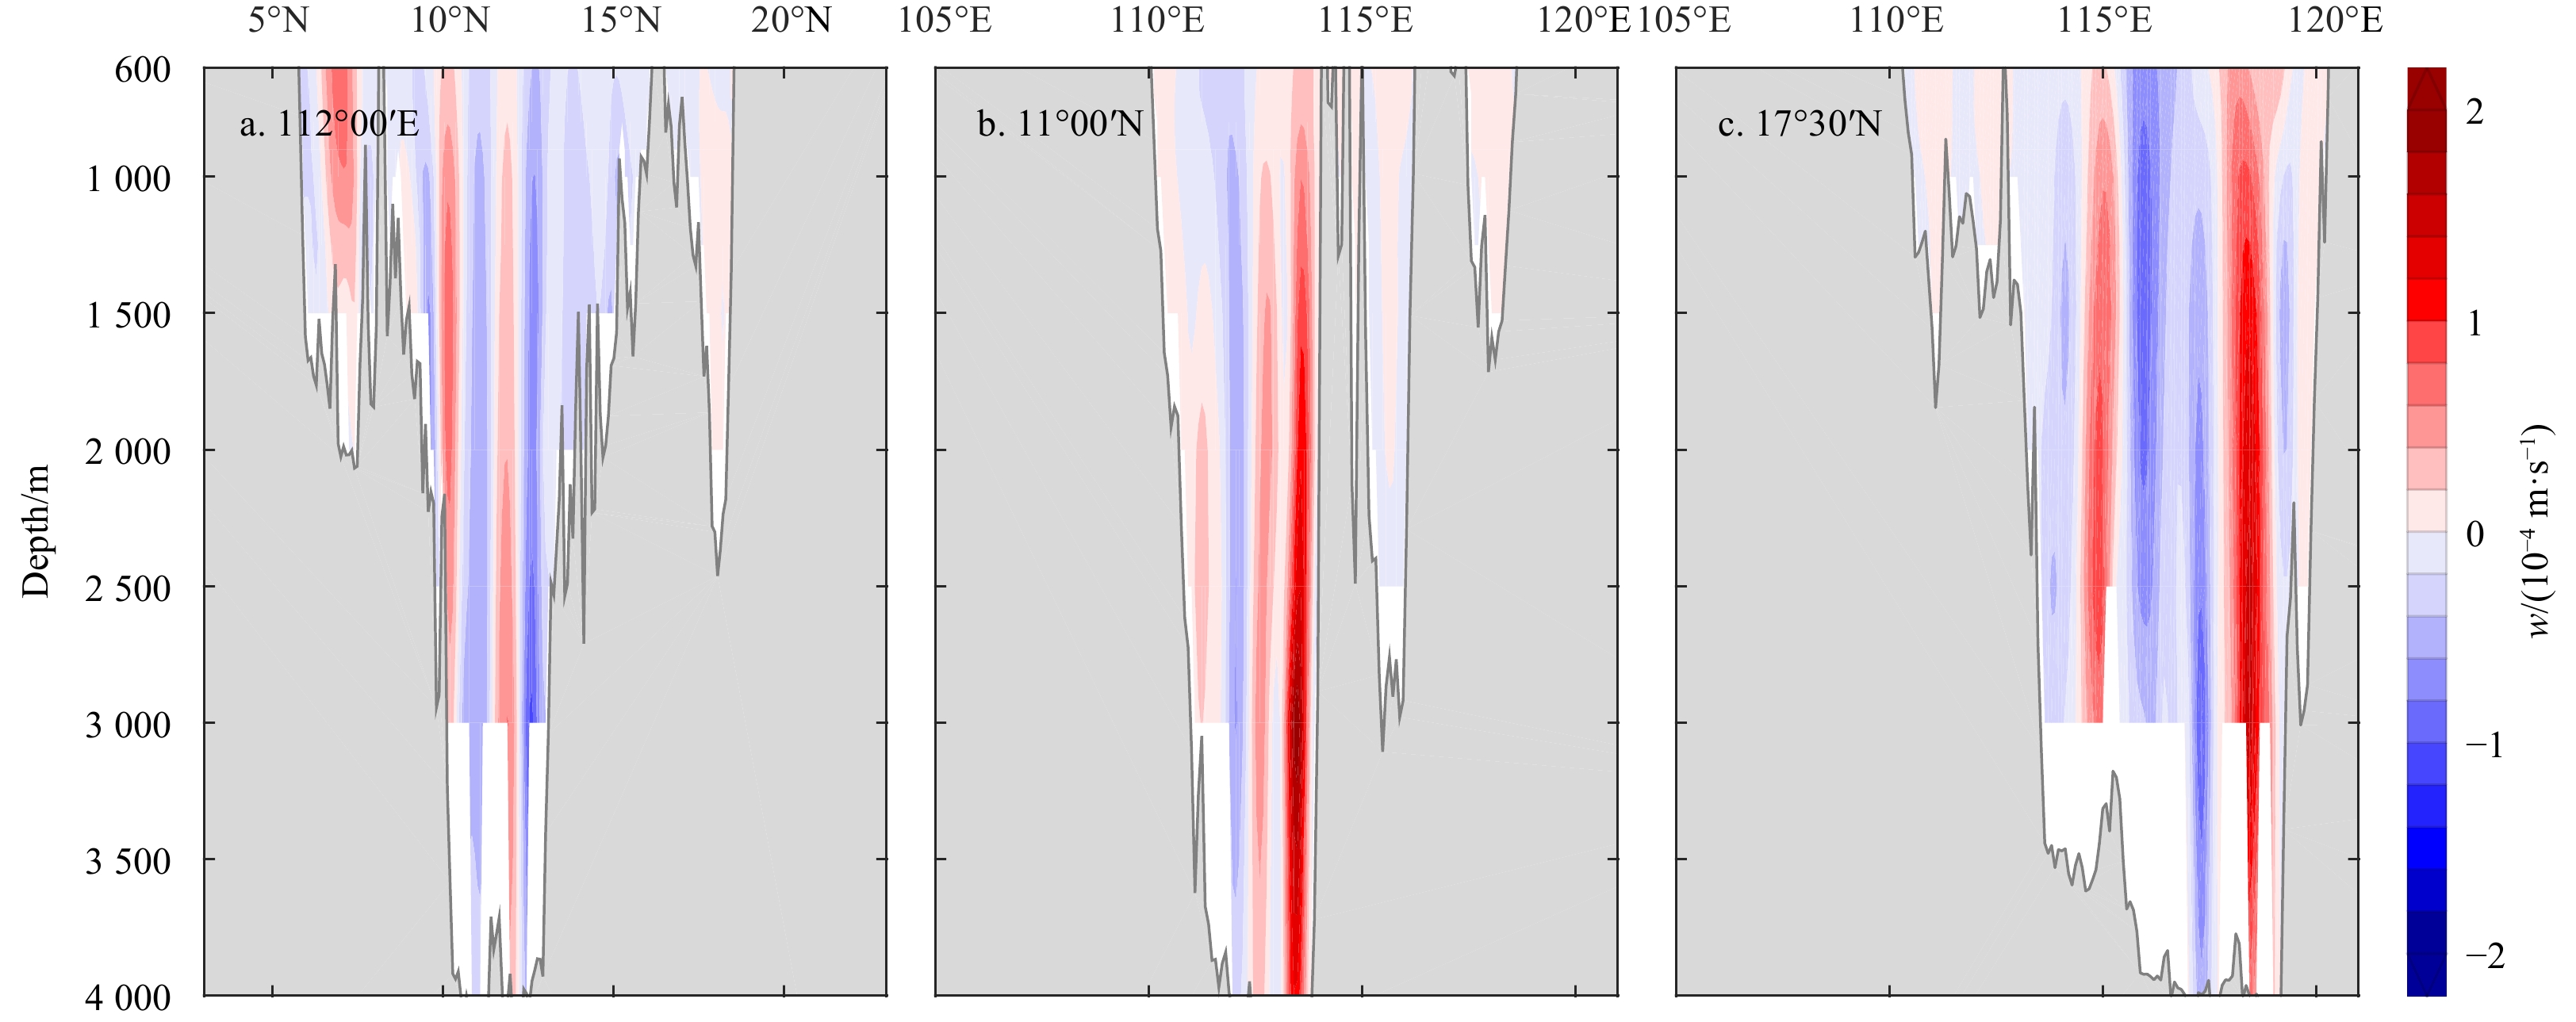
Figure 9. Upward vertical velocity (w) generates on the seaward side of the 3 000 m isobath along transect to the southeast of Vietnam (a), on the southern slope (b), west of the Heng-Chun Ridge (c).

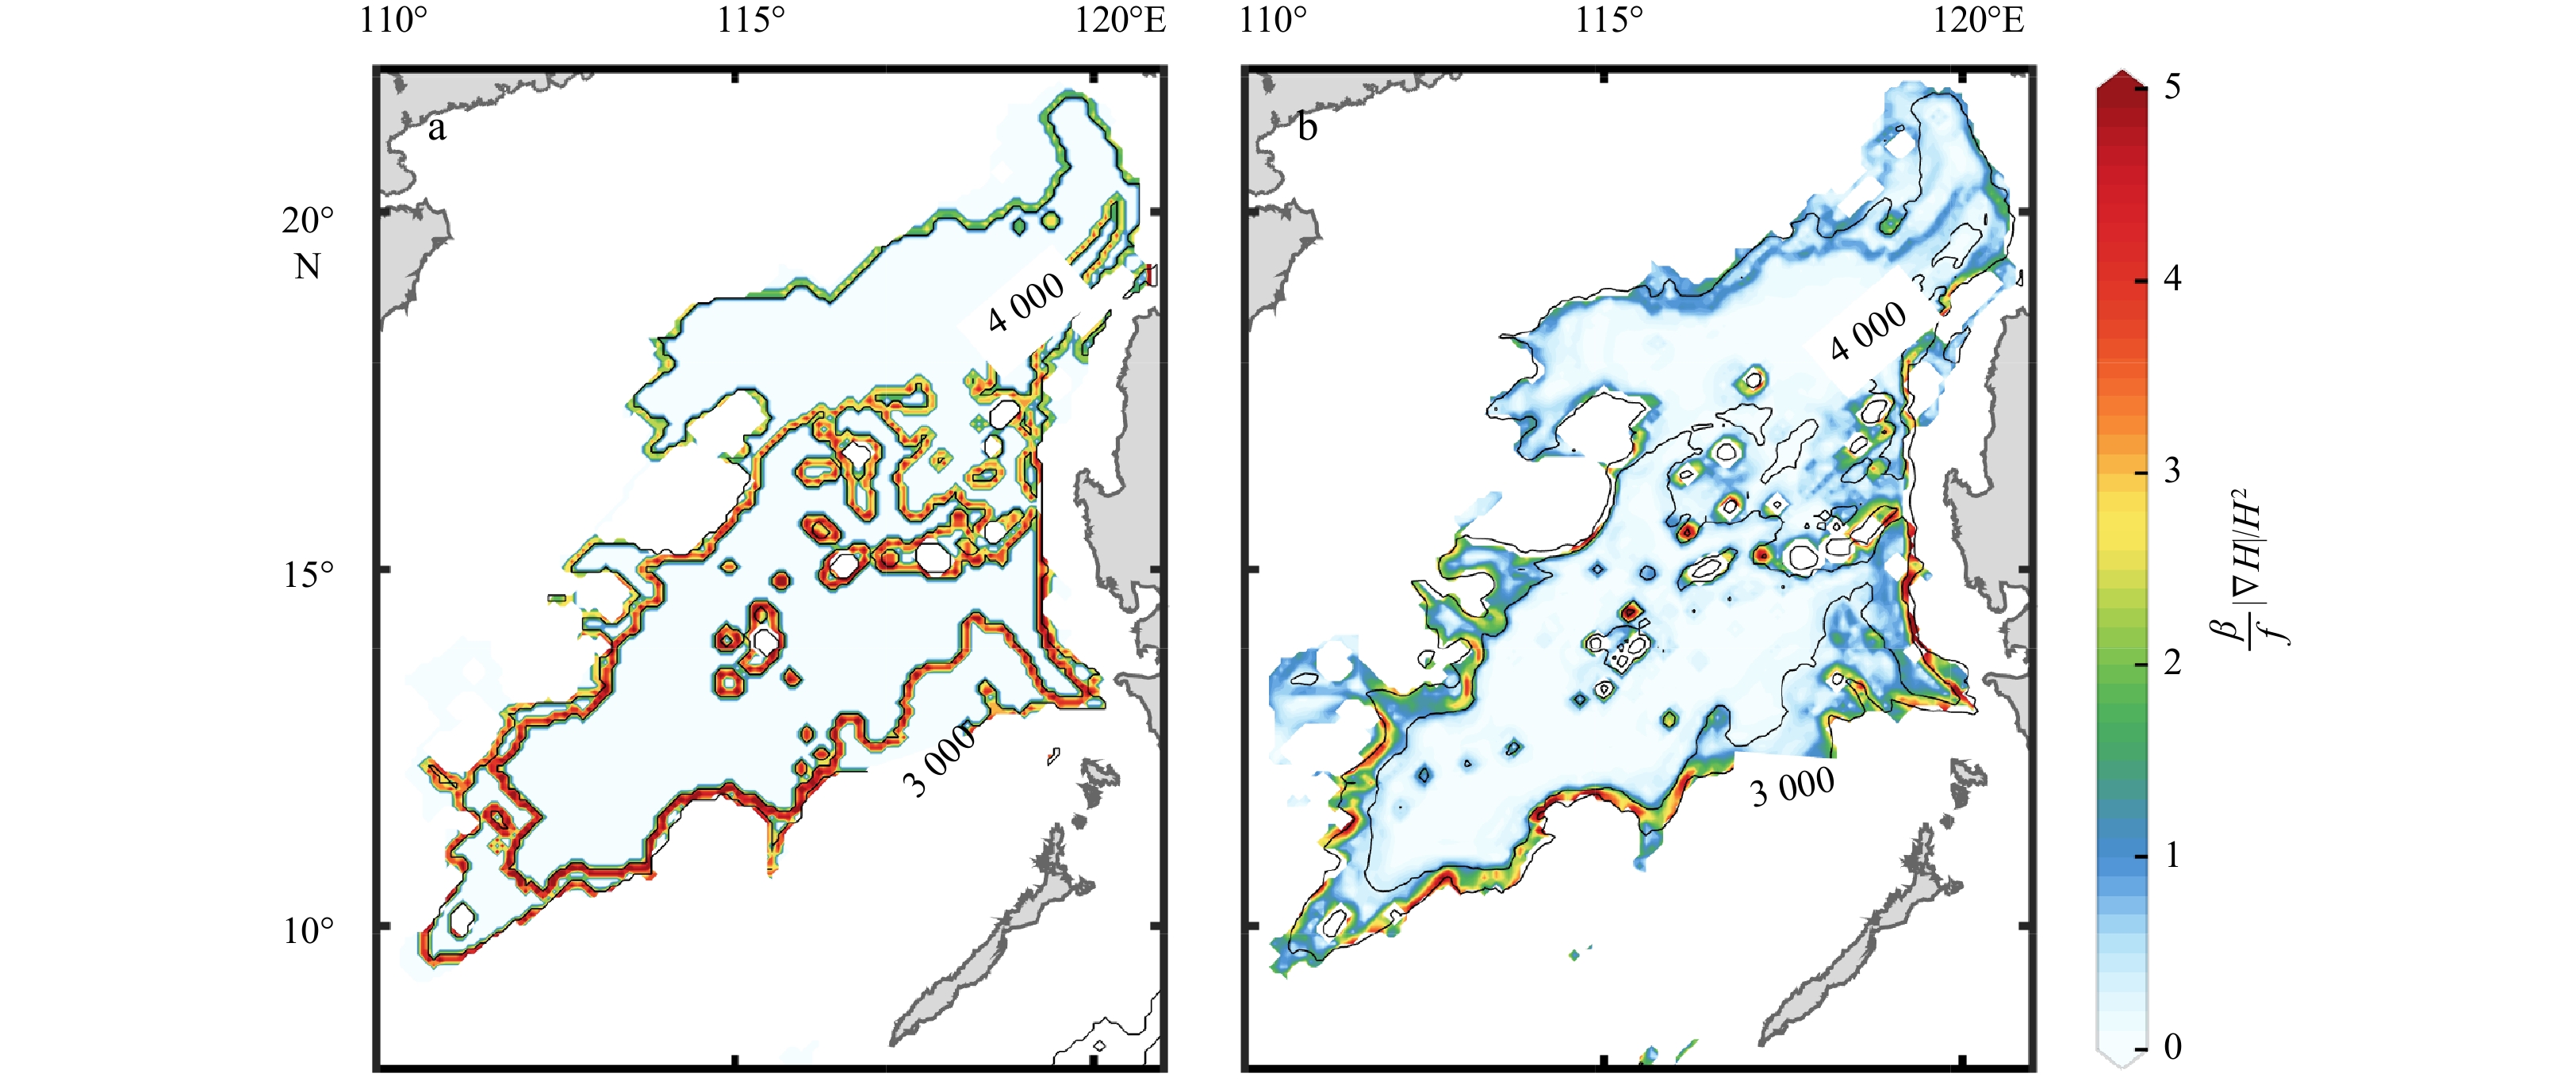
Figure 10. Distribution of
$ \dfrac{\beta }{f}\left|\nabla H\right|/{H}^{2} $ derived from the HYCOM model topography (a), and ETOPO5 (b). The isobaths at 3 000 m and 4 000 m are indicated.
Figure 11. The role of vertical transport in the three-dimensional SCS circulation. Dark blue and red arrows indicate the Luzon Strait overflow and Kuroshio intrusion, respectively. The hollow arrows in vertical present the strength of domain-averaged vertical velocity, inferring a positive vertical gradient of vertical velocity in the upper and deep layer, and a negative one in the intermediate layer. The thin blue arrows encompassing the yellow planes denote the direction of layer-averaged horizontal circulation in the basin scale. The abbreviation SCSTF indicates South China Sea throughflow.
Table 1. Outflows in the upper 50 m (positive outward from the SCS, unit: 106 m3/s)
Luzon St. Taiwan St. Mindoro St. Balabac St. Karimata St. Net outflow Mean −0.39 (−0.09) 1.25 (0.11) 0.09 (0.24) −0.27 (0.04) 0.59 1.27 (0.3) Winter −1.81 (−0.54) 0.17 (0.47) 0.51 (0.96) −0.42 (−0.16) 2.34 0.79 (0.73) Summer 1.17 (0.20) 2.60 (−0.04) −0.23 (−0.15) −0.24 (0.23) −1.17 2.13 (0.24) Note: The numbers in brackets indicate contribution from the Ekman drift.  下载: 导出CSV
Table 2. Comparison of vertical transport on the seaward side of the 3 000 m isobath with the domain-integrated transport at different vertical levels (unit: 106 m3/s)
100 m 500 m 1 500 m 2 500 m Seaward side of 3 000 m 0.19 −0.42 1.13 1.97 Domain-integrated 1.25 0.94 1.49 0.69
下载: 导出CSV
-
[1] Cai Zhongya, Gan Jianping. 2020. Dynamics of the cross-layer exchange for the layered circulation in the South China Sea. Journal of Geophysical Research: Oceans, 125(8): e2020JC016131. doi: 10.1029/2020JC016131 [2] Chai Fei, Xue Huijie, Shi Maochong. 2001. Formation and distribution of upwelling and downwelling in the South China Sea. China Oceanography Symposium, 13: 117–128 [3] Chao S Y, Shaw P T, Wu S Y. 1996. Deep water ventilation in the South China Sea. Deep-Sea Research Part I: Oceanographic Research Papers, 43(4): 445–466. doi: 10.1016/0967-0637(96)00025-8 [4] Chu P C, Chen Yuchun, Lu Shihua. 1998. Wind-driven South China Sea deep basin warm-core/cool-core eddies. Journal of Oceanography, 54(4): 347–360. doi: 10.1007/BF02742619 [5] Fang Guohong, Wang Gang, Fang Yue, et al. 2012. A review on the South China Sea western boundary current. Acta Oceanologica Sinica, 31(5): 1–10. doi: 10.1007/s13131-012-0231-y [6] Gan Jianping, Allen J S. 2002. A modeling study of shelf circulation off northern California in the region of the Coastal Ocean Dynamics Experiment 2. Response to relaxation of upwelling winds. Journal of Geophysical Research: Oceans, 107(C11): 3184. doi: 10.1029/2001JC001190 [7] Gan Jianping, Ho H S, Liang Linlin. 2013. Dynamics of intensified downwelling circulation over a widened shelf in the Northeastern South China Sea. Journal of Physical Oceanography, 43(1): 80–94. doi: 10.1175/JPO-D-12-02.1 [8] Gan Jianping, Li H, Curchitser E N, et al. 2006. Modeling South China Sea circulation: Response to seasonal forcing regimes. Jousrnal of Geophysical Research: Oceans, 111(C6): C06034. doi: 10.1029/2005JC003298 [9] Gan Jianping, Liu Zhiqiang, Hui C R. 2016. A three-layer alternating spinning circulation in the South China Sea. Journal of Physical Oceanography, 46(8): 2309–2315. doi: 10.1175/JPO-D-16-0044.1 [10] Godfrey, J S. 1989. A Sverdrup model of the depth-integrated flow for the world ocean allowing for island circulations. Geophysical & Astrophysical Fluid Dynamics, 45(1–2): 89–112 [11] Gordon A L, Sprintall J, Van Aken H M, et al. 2010. The Indonesian throughflow during 2004–2006 as observed by the INSTANT program. Dynamics of Atmospheres and Oceans, 50(2): 115–128. doi: 10.1016/j.dynatmoce.2009.12.002 [12] Jing Zhiyou, Qi Yiquan, Du Yan, et al. 2015. Summer upwelling and thermal fronts in the northwestern South China Sea: Observational analysis of two mesoscale mapping surveys. Journal of Geophysical Research: Oceans, 120(3): 1993–2006. doi: 10.1002/.2014JC010601 [13] Li Li, Qu Tangdong. 2006. Thermohaline circulation in the deep South China Sea basin inferred from oxygen distributions. Journal of Geophysical Research: Oceans, 111(C5): C05017. doi: 10.1029/2005JC003164 [14] Metzger E J, Hurlburt H E. 1996. Coupled dynamics of the South China Sea, the Sulu Sea, and the Pacific Ocean. Journal of Geophysical Research: Oceans,, 101(C5): 12331–12352 [15] Nitani H. 1972. Beginning of the Kuroshio. In: Stommel H, Yashida K, eds. Kuroshio: Physical Aspects of the Japan Current. Seattle, WA, USA: University of Washington Press, 129–163 [16] Qu Tangdong. 2000. Upper-layer circulation in the South China Sea. Journal of Physical Oceanography, 30(6): 1450–1460. doi: 10.1175/1520-0485(2000)030<1450:ULCITS>2.0.CO;2 [17] Qu Tangdong, Du Yan, Gan Jianping, et al. 2007. Mean seasonal cycle of isothermal depth in the South China Sea. Journal of Geophysical Research: Oceans, 112(C2): C02020. doi: 10.1029/2006JC003583 [18] Qu Tangdong, Girton J B, Whitehead J A. 2006. Deepwater overflow through Luzon Strait. Journal of Geophysical Research: Oceans, 111(C1): C01002. doi: 10.1029/2005JC003139 [19] Shaw P T, Chao S Y. 1994. Surface circulation in the South China Sea. Deep-Sea Research Part I: Oceanographic Research Papers, 41(11–12): 1663–1683 [20] Shu Yeqiang, Xue Huijie, Wang Dongxiao, et al. 2014. Meridional overturning circulation in the South China Sea envisioned from the high-resolution global reanalysis data GLBa0.08. Journal of Geophysical Research: Oceans, 119(5): 3012–3028. doi: 10.1002/2013JC009583 [21] Song Y T, Chao Yi. 2004. A theoretical study of topographic effects on coastal upwelling and cross-shore exchange. Ocean Modelling, 6(2): 151–176. doi: 10.1016/S1463-5003(02)00064-1 [22] Wang J. 1986. Observation of abyssal flows in the northern South China Sea. Acta Oceanographica Taiwanica, 16: 36–45 [23] Wang Dongxiao, Liu Qinyan, Huang Ruixin, et al. 2006. Interannual variability of the South China Sea throughflow inferred from wind data and an ocean data assimilation product. Geophysical Research Letters, 33(14): L14605. doi: 10.1029/2006GL026316 [24] Xiao Jinggen, Xie Qiang, Liu Changjian, et al. 2013. A diagnostic model of the South China Sea bottom circulation in consideration of tidal mixing, eddy-induced mixing and topography. Haiyang Xuebao (in Chinese), 35(5): 1–13 [25] Xie Lingling, Pallàs-Sanz E, Zheng Quanan, et al. 2017. Diagnosis of 3D vertical circulation in the upwelling and frontal zones east of Hainan Island, China. Journal of Physical Oceanography, 47(4): 755–774. doi: 10.1175/JPO-D-16-0192.1 [26] Xie Qiang, Xiao Jinggen, Wang Dongxiao, et al. 2013. Analysis of deep-layer and bottom circulations in the South China Sea based on eight quasi-global ocean model outputs. Chinese Science Bulletin, 58(32): 4000–4011. doi: 10.1007/s11434-013-5791-5 [27] Xie Lingling, Zhang Shuwen, Zhao Hui. 2012. Overview of studies on Qiongdong upwelling. Journal of Tropical Oceanography, 31(4): 35–41 [28] Xu Fanghua, Oey L Y. 2014. State analysis using the Local Ensemble Transform Kalman Filter (LETKF) and the three-layer circulation structure of the Luzon Strait and the South China Sea. Ocean Dynamics, 64(6): 905–923. doi: 10.1007/s10236-014-0720-y [29] Xu Tengfei, Wei Zexun, Susanto R D, et al. 2021. Observed water exchange between the South China Sea and Java Sea through Karimata Strait. Journal of Geophysical Research: Oceans, 126(2): e2020JC016608. doi: 10.1029/2020JC016608 [30] Yuan Dongliang. 2002. A numerical study of the South China Sea deep circulation and its relation to the Luzon Strait transport. Acta Oceanologica Sinica, 21(2): 187–202 [31] Zhang Zhiwei, Zhao Wei, Tian Jiwei, et al. 2015. Spatial structure and temporal variability of the zonal flow in the Luzon Strait. Journal of Geophysical Research: Oceans, 120(2): 759–776. doi: 10.1002/2014JC010308 [32] Zhao Wei, Zhou Chun, Tian Jiwei, et al. 2014. Deep water circulation in the Luzon Strait. Journal of Geophysical Research: Oceans, 119(2): 790–804. doi: 10.1002/2013JC009587 [33] Zhou Chun, Zhao Wei, Tian Jiwei, et al. 2014. Variability of the deep-water overflow in the Luzon Strait. Journal of Physical Oceanography, 44(11): 2972–2986. doi: 10.1175/JPO-D-14-0113.1 [34] Zhou Chun, Zhao Wei,Tian Jiwei, et al. 2017. Deep Western Boundary Current in the South China Sea. Scientific Reports, 7(1): 9303. doi: 10.1038/s41598-017-09436-2 [35] Zhu Yaohua, Fang Guohong, Wei Zexun, et al. 2016. Seasonal variability of the meridional overturning circulation in the South China Sea and its connection with inter-ocean transport based on SODA2.2.4. Journal of Geophysical Research: Oceans, 121(5): 3090–3105. doi: 10.1002/2015JC011443 [36] Zhu Yaohua, Sun Junchuan, Wang Yonggang, et al. 2017a. Effect of potential vorticity flux on the circulation in the South China Sea. Journal of Geophysical Research: Oceans, 122(8): 6454–6469. doi: 10.1002/2016JC012375 [37] Zhu Yaohua, Sun Junchuan, Wei Zexun, et al. 2017b. A fresh look at the deepwater overflow in the Luzon Strait. Acta Oceanologica Sinica, 36(5): 1–8. doi: 10.1007/s13131-017-1057-4 -


 点击查看大图

计量
- 文章访问数: 935
- HTML全文浏览量: 306
- PDF下载量: 261
- 被引次数: 0

