

Statistics of underwater ambient noise at high sea states arisen from typhoon out zones in the Philippine Sea and South China Sea
-
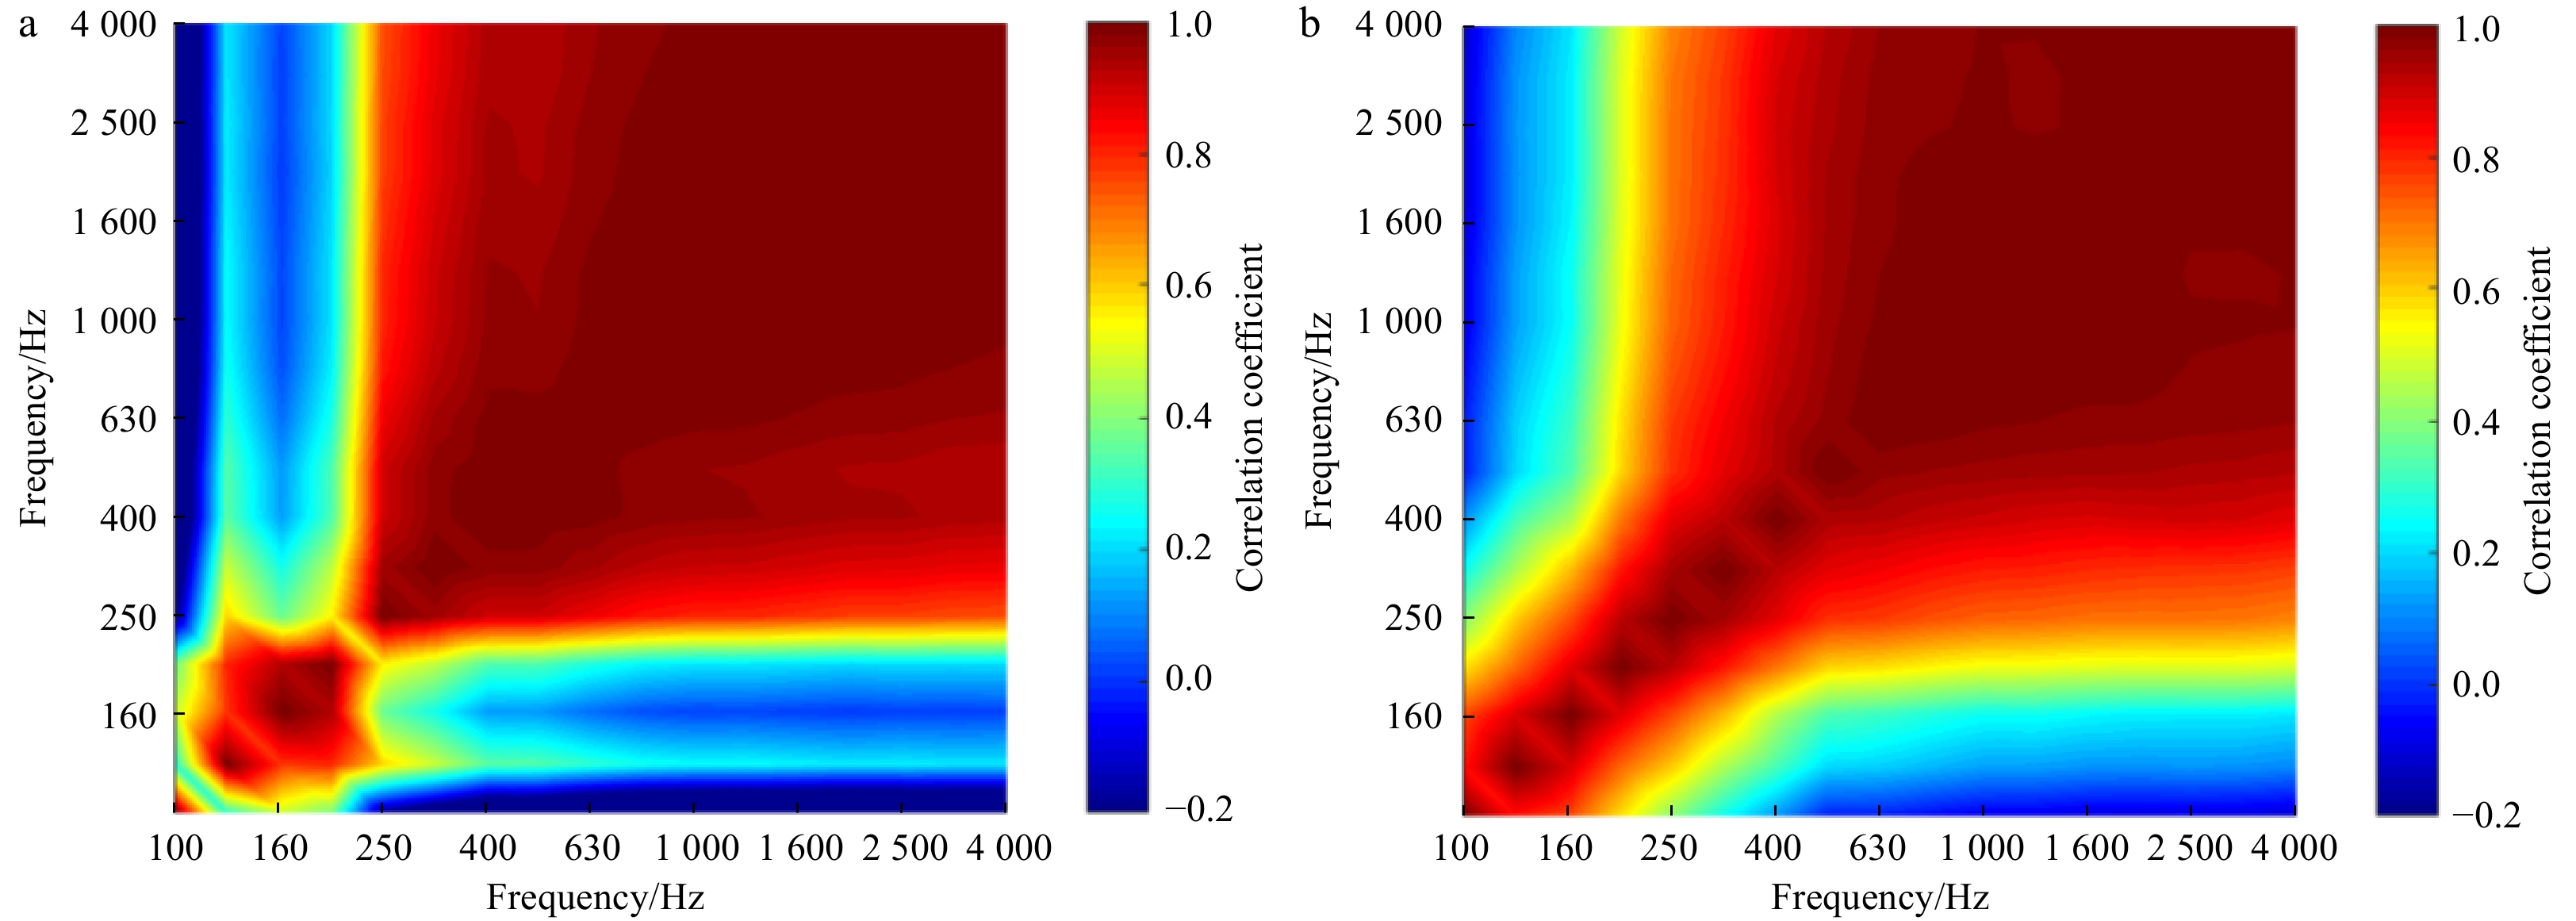
Abstract: Oceanic noise is the background interference in sonar performance prediction and evaluation at high sea states. Statistics of underwater ambient noise during Typhoons Soulik and Nida were analyzed on the basis of experimental measurements conducted in a deep area of the Philippine Sea and the South China Sea. Generated linear regression, frequency correlation matrix (FCM), Burr distribution and Gumbel distribution were described for the analysis of correlation with environmental parameters including wind speed (WS), significant wave height (SWH), and the inter-frequency relationship and probability density function of noise levels (NLs). When the typhoons were quite close to the receivers, the increment of NLs exceeded 10 dB. Whilst ambient noise was completely dominated by wind agitation, NLs were proportional to the cubic and quintic functions of WS and SWH, respectively. The fitted results between NLs and oceanic parameters were different for “before typhoon” and “after typhoon”. The fitted slopes of linear regression showed a linear relationship with the logarithm of frequency. The average observed typhoon-generated NLs were 5 dB lower than the Wenz curve at the same wind force due to the insufficiently developed sea state or the delay between NLs and WS. The cross-correlation coefficient of FCM, which can be utilized in the identification of noise sources in different bands, exceeded 0.8 at frequencies higher than 250 Hz. Furthermore, standard deviation increased with frequency. The kurtosis was equal to 3 at >400 Hz approximately. The characteristics of NLs showed good agreement with the results of FCM.
-
Key words:
- statistics /
- underwater acoustics /
- cruise-measured ambient noise /
- typhoon /
- Philippine Sea /
- South China Sea /
- deep ocean
-
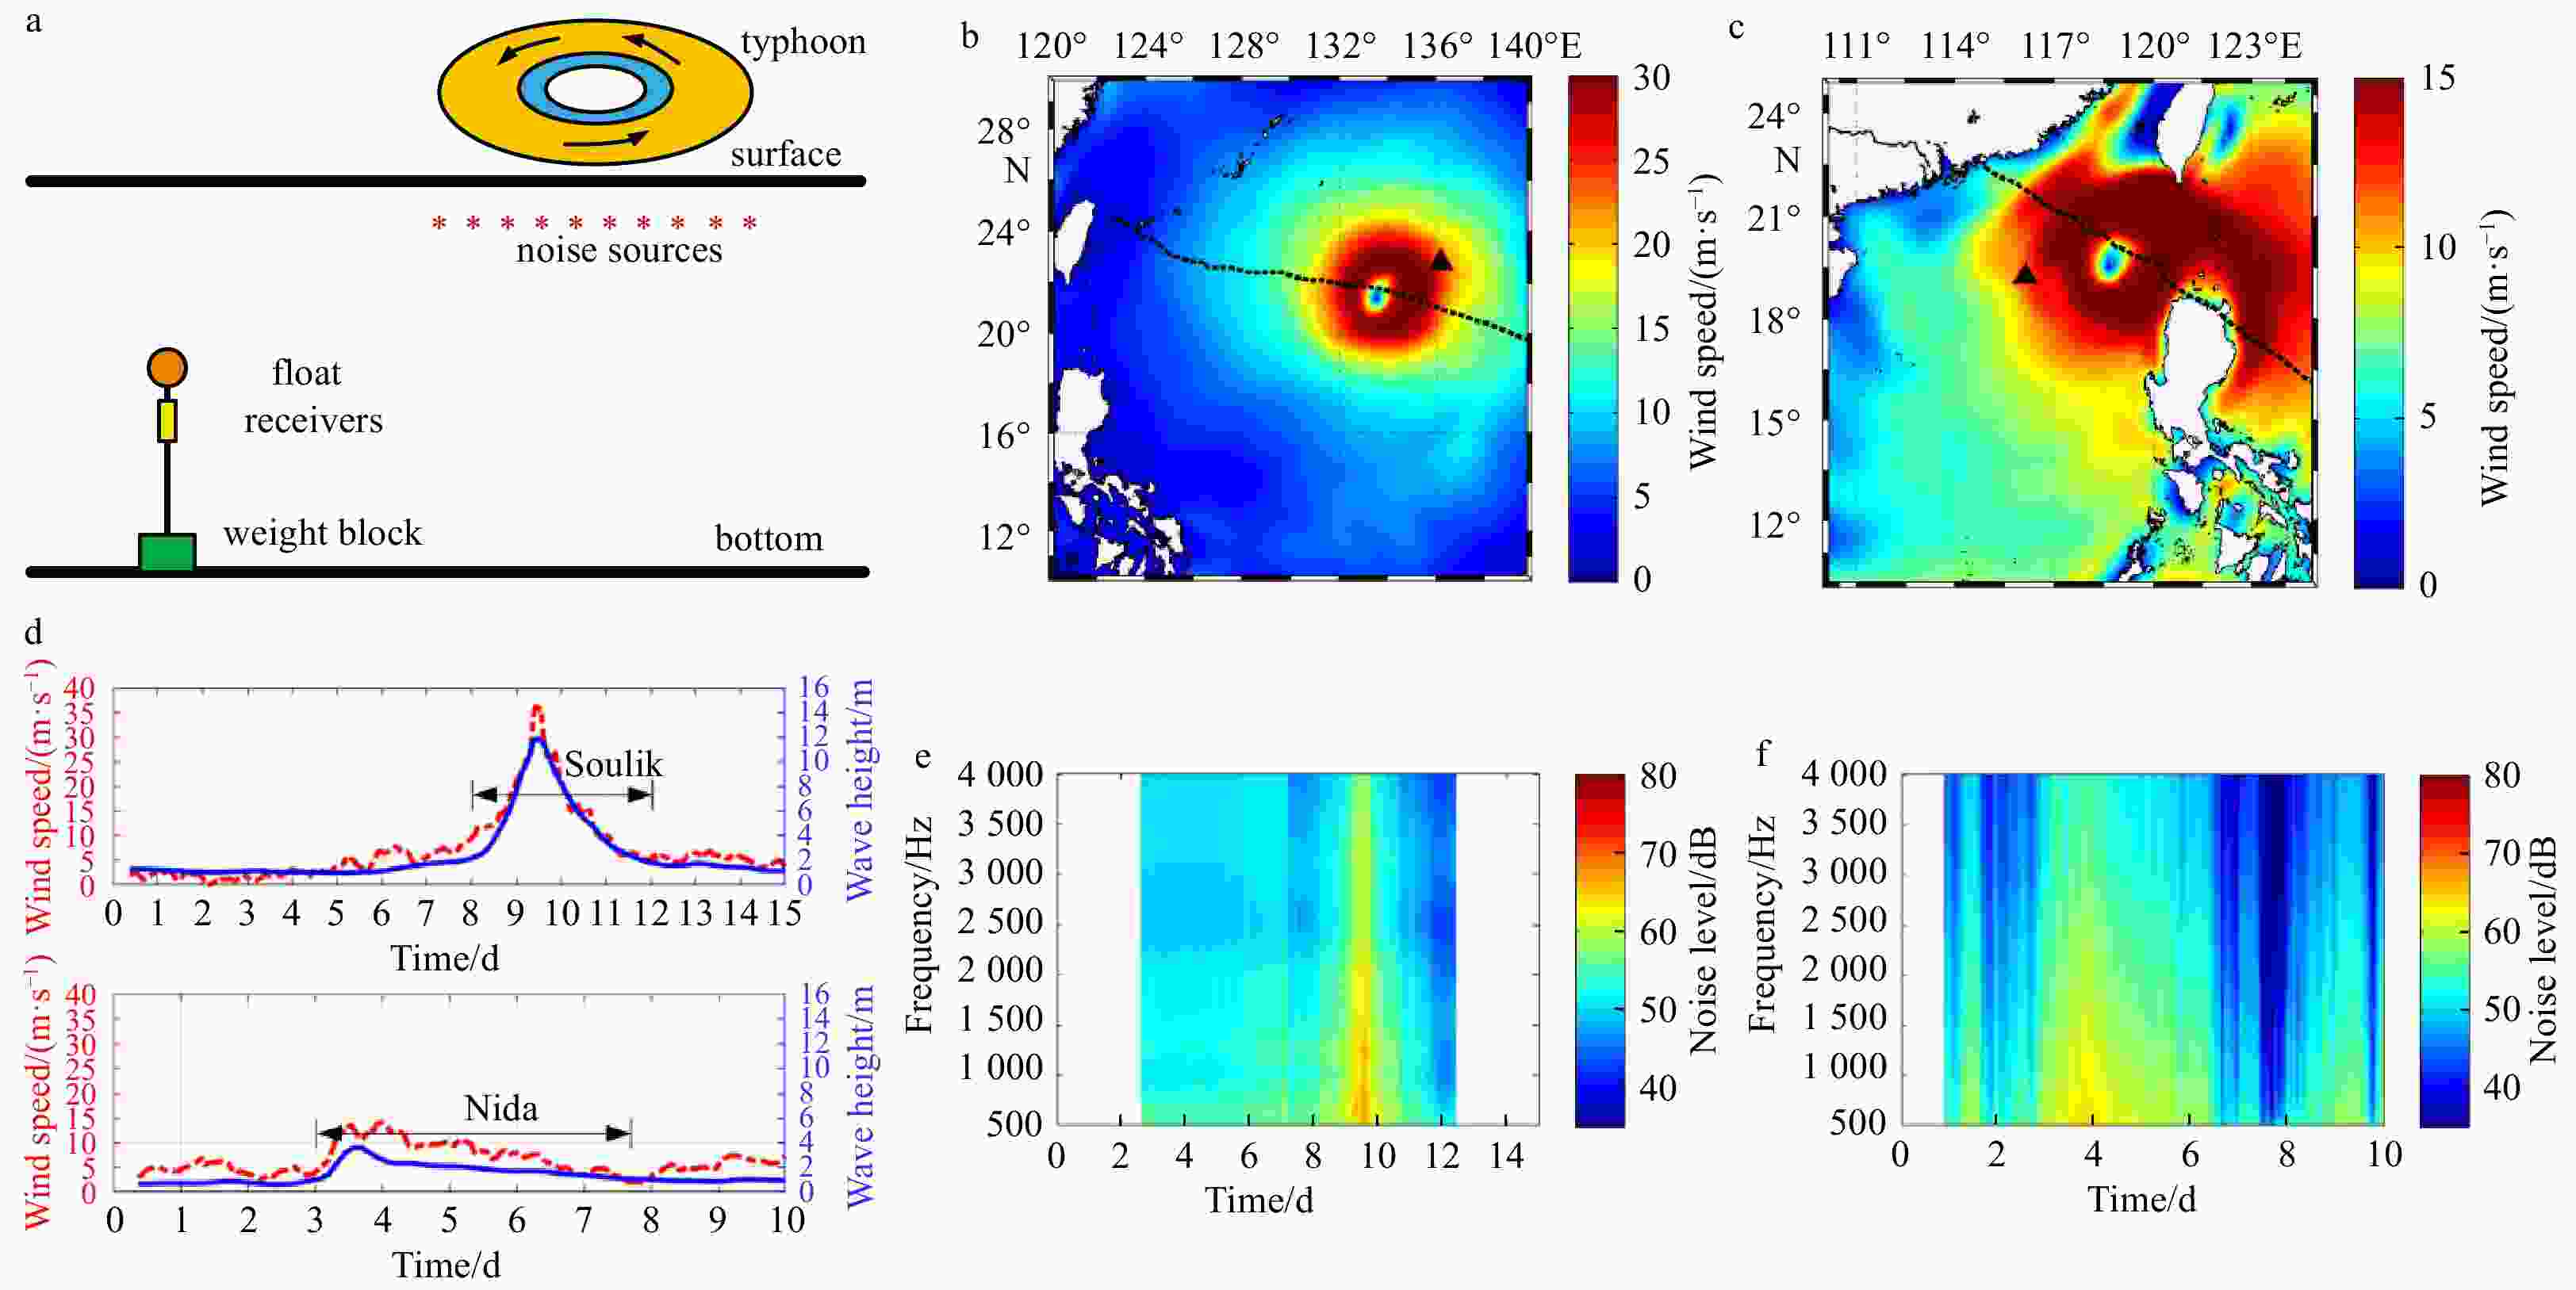
Figure 1. Experimental measurement and received noise level (NL). a. Schematic of experiment; b. wind field and trace of Typhoon Soulik; c. wind field and trace of Typhoon Nida; d. ocean meteorological parameters; e. NL, in WP2013; f. NL, in SCS2016. The black triangle denotes receiver position.

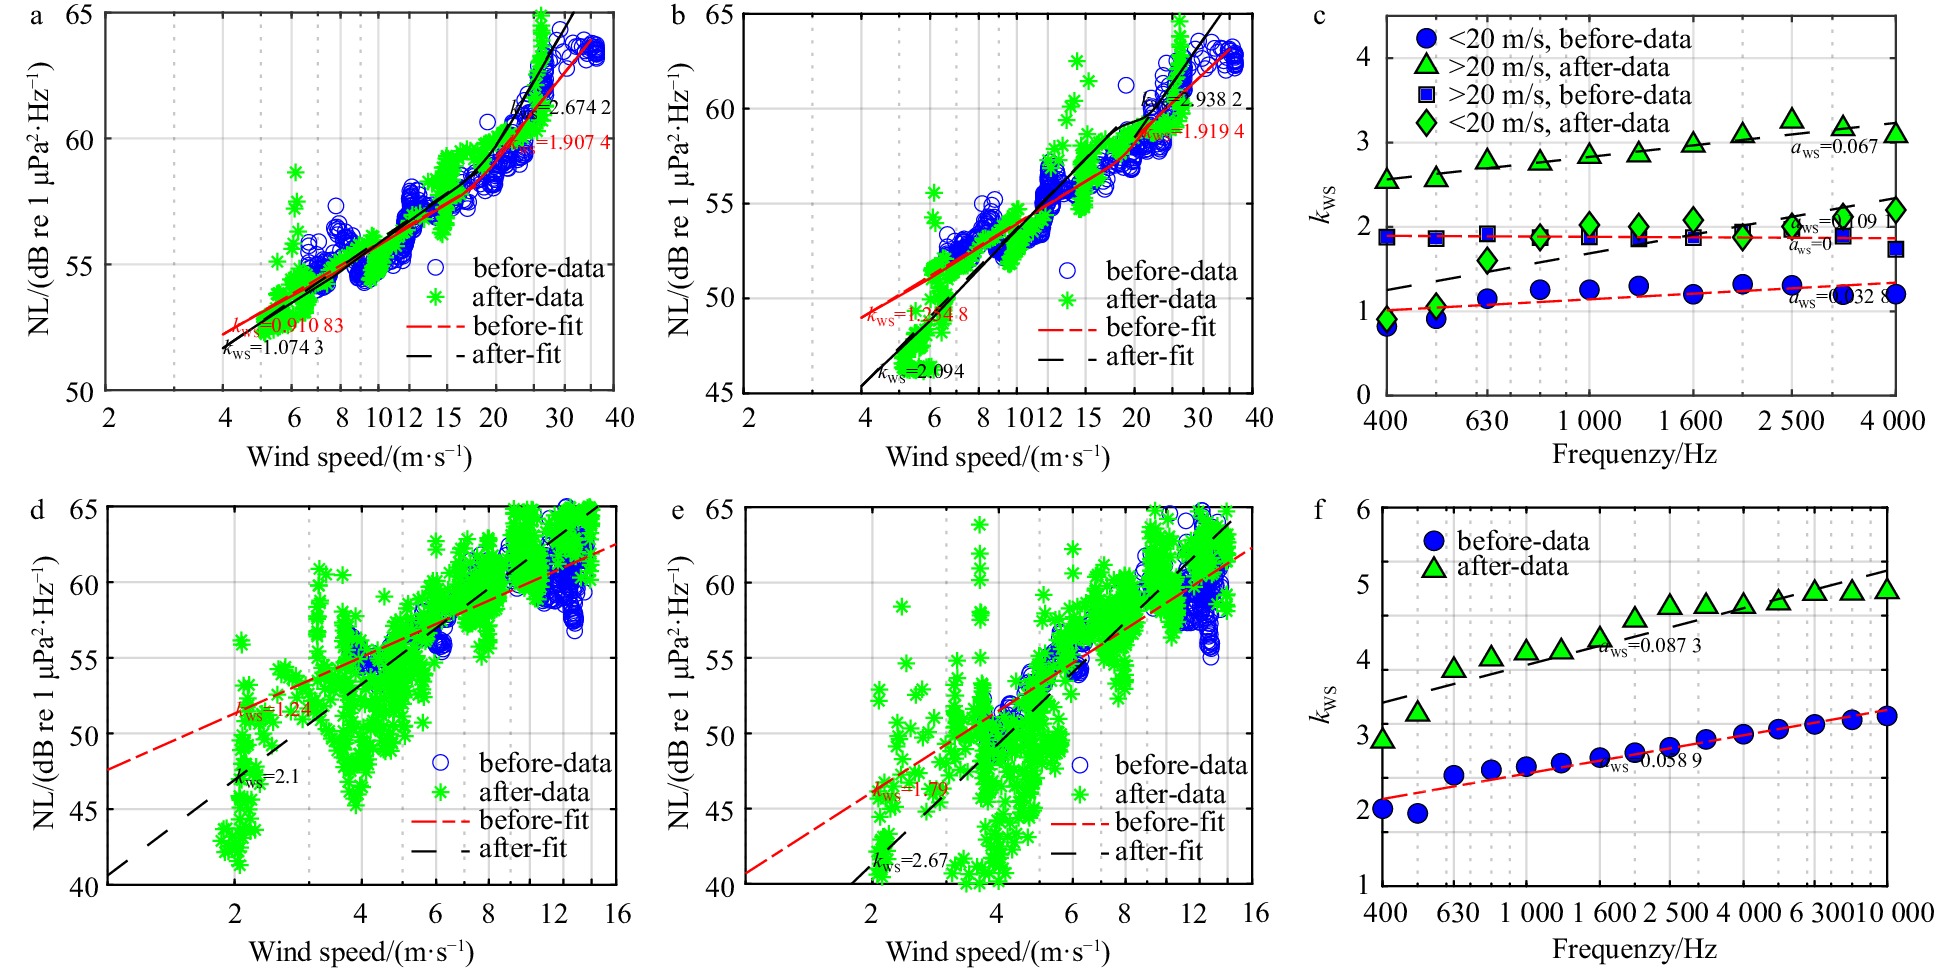
Figure 2. Relationship between noise levels (NLs) and local wind speed (WS). a. 500 Hz in WP2013; b. 1 000 Hz in WP2013; c. frequency dependence in WP2013; d. 500 Hz in SCS2016; e. 1 000 Hz in SCS2016; f. frequency dependence in SCS2016.

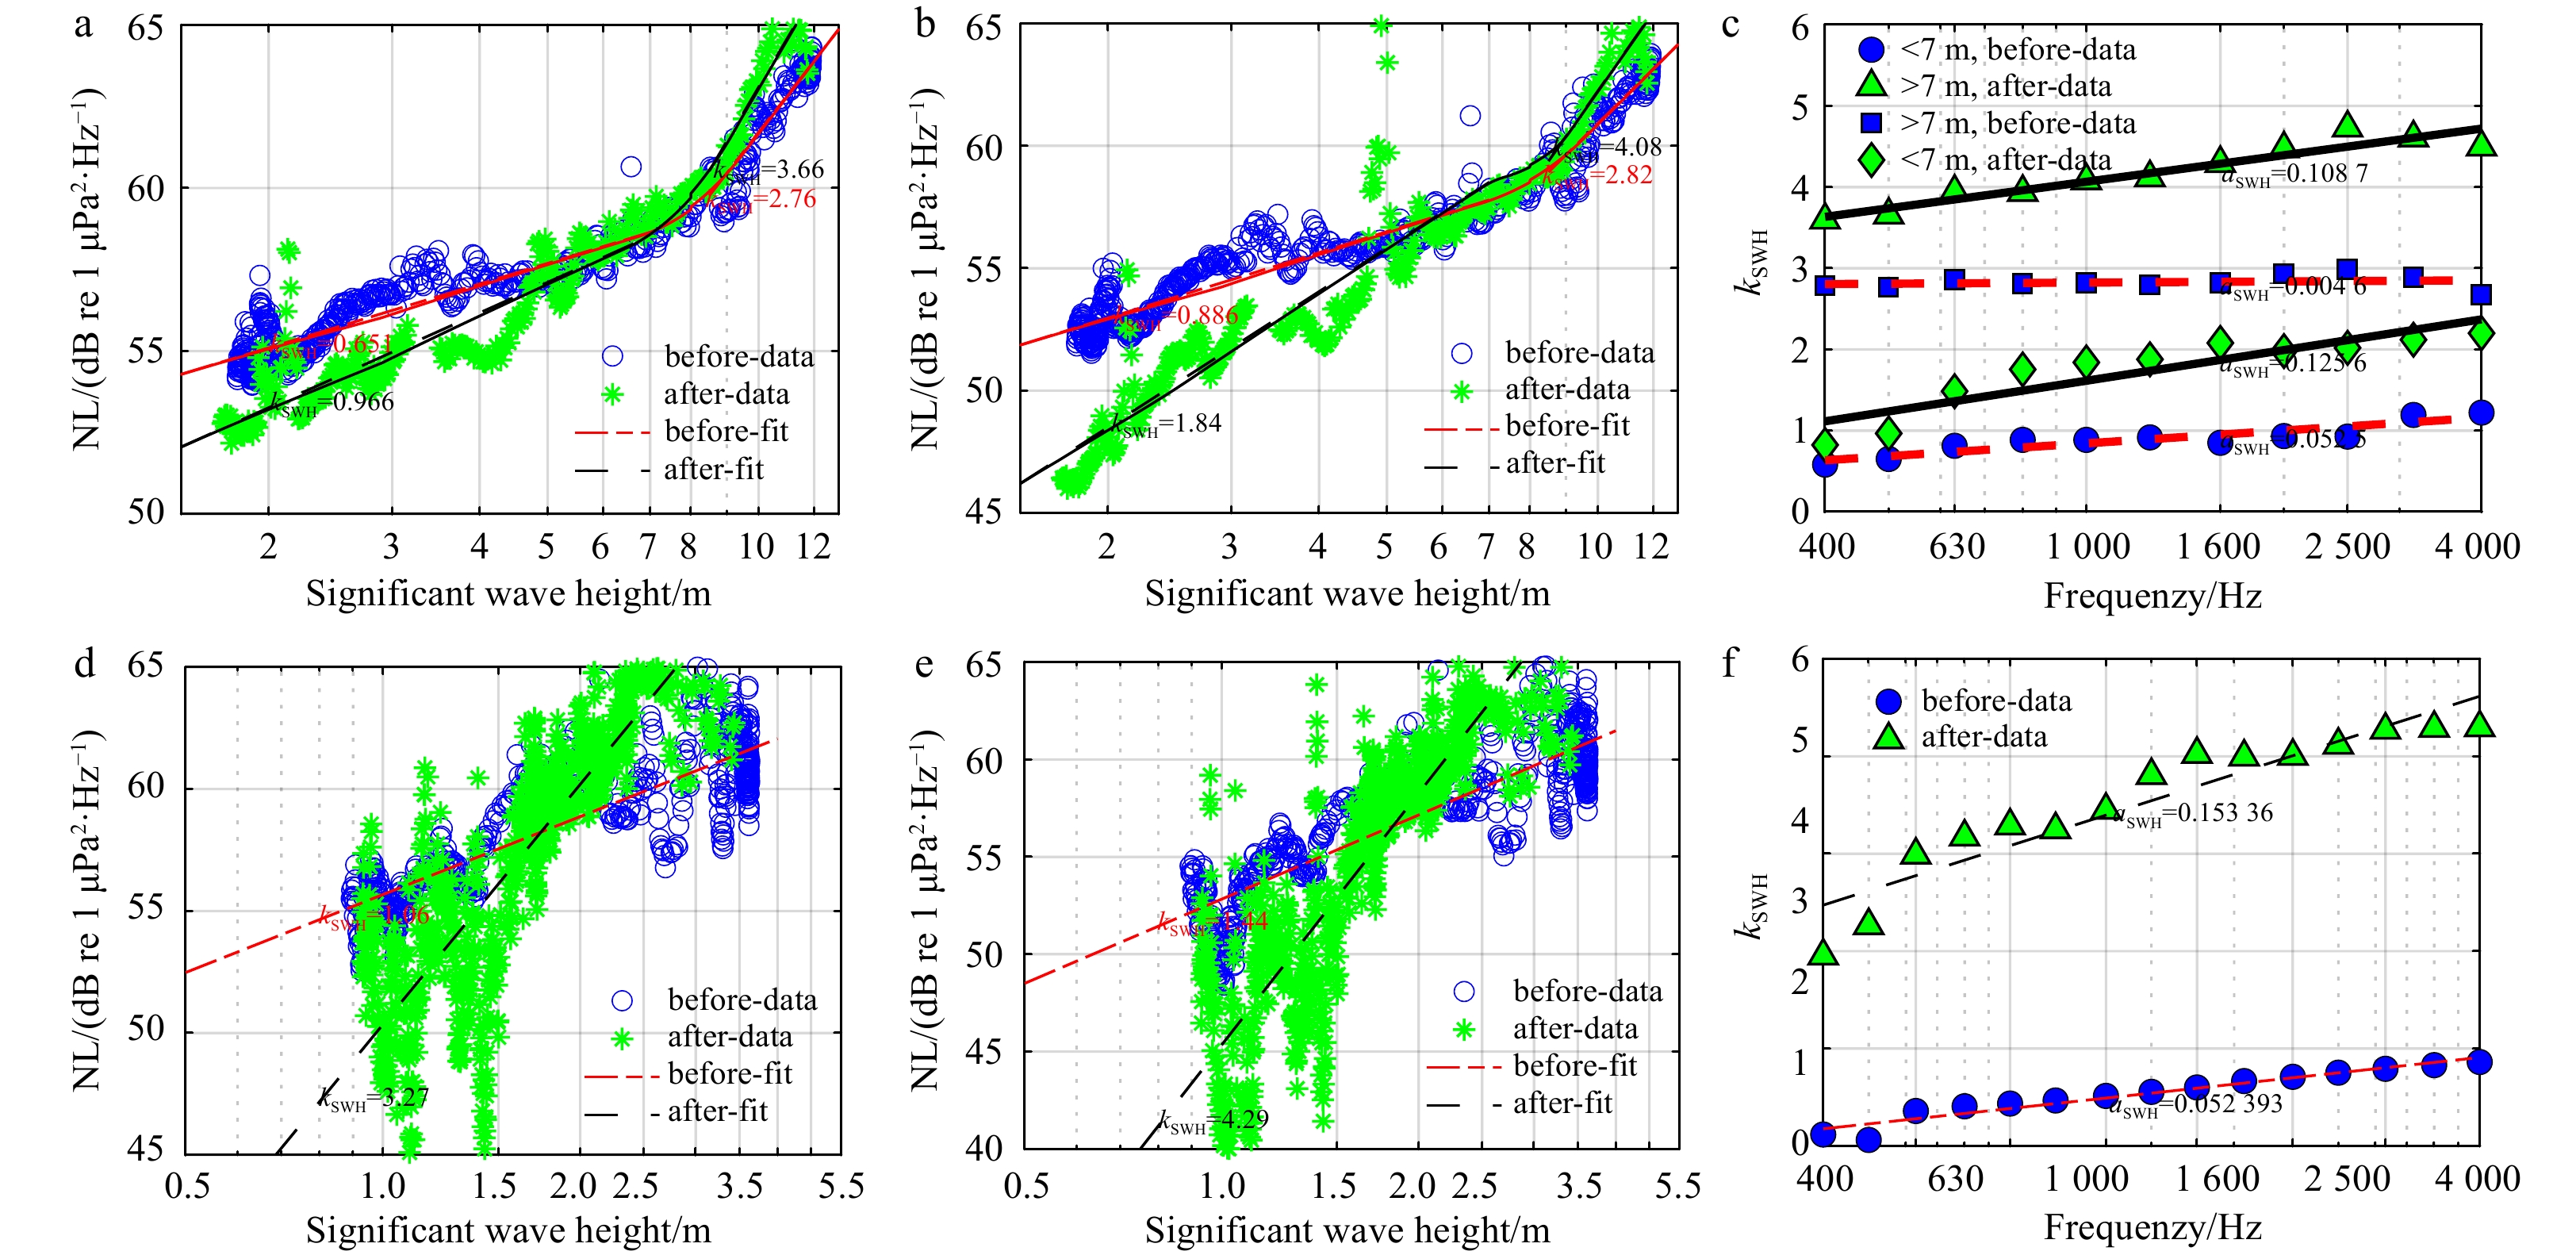
Figure 3. Relationship between noise levels (NLs) and local significant wave height (SWH). a. 500 Hz in WP2013; b. 1 000 Hz in WP2013; c. frequency dependence in WP2013; d. 500 Hz in SCS2016; e. 1 000 Hz in SCS2016; f. frequency dependence in SCS2016.
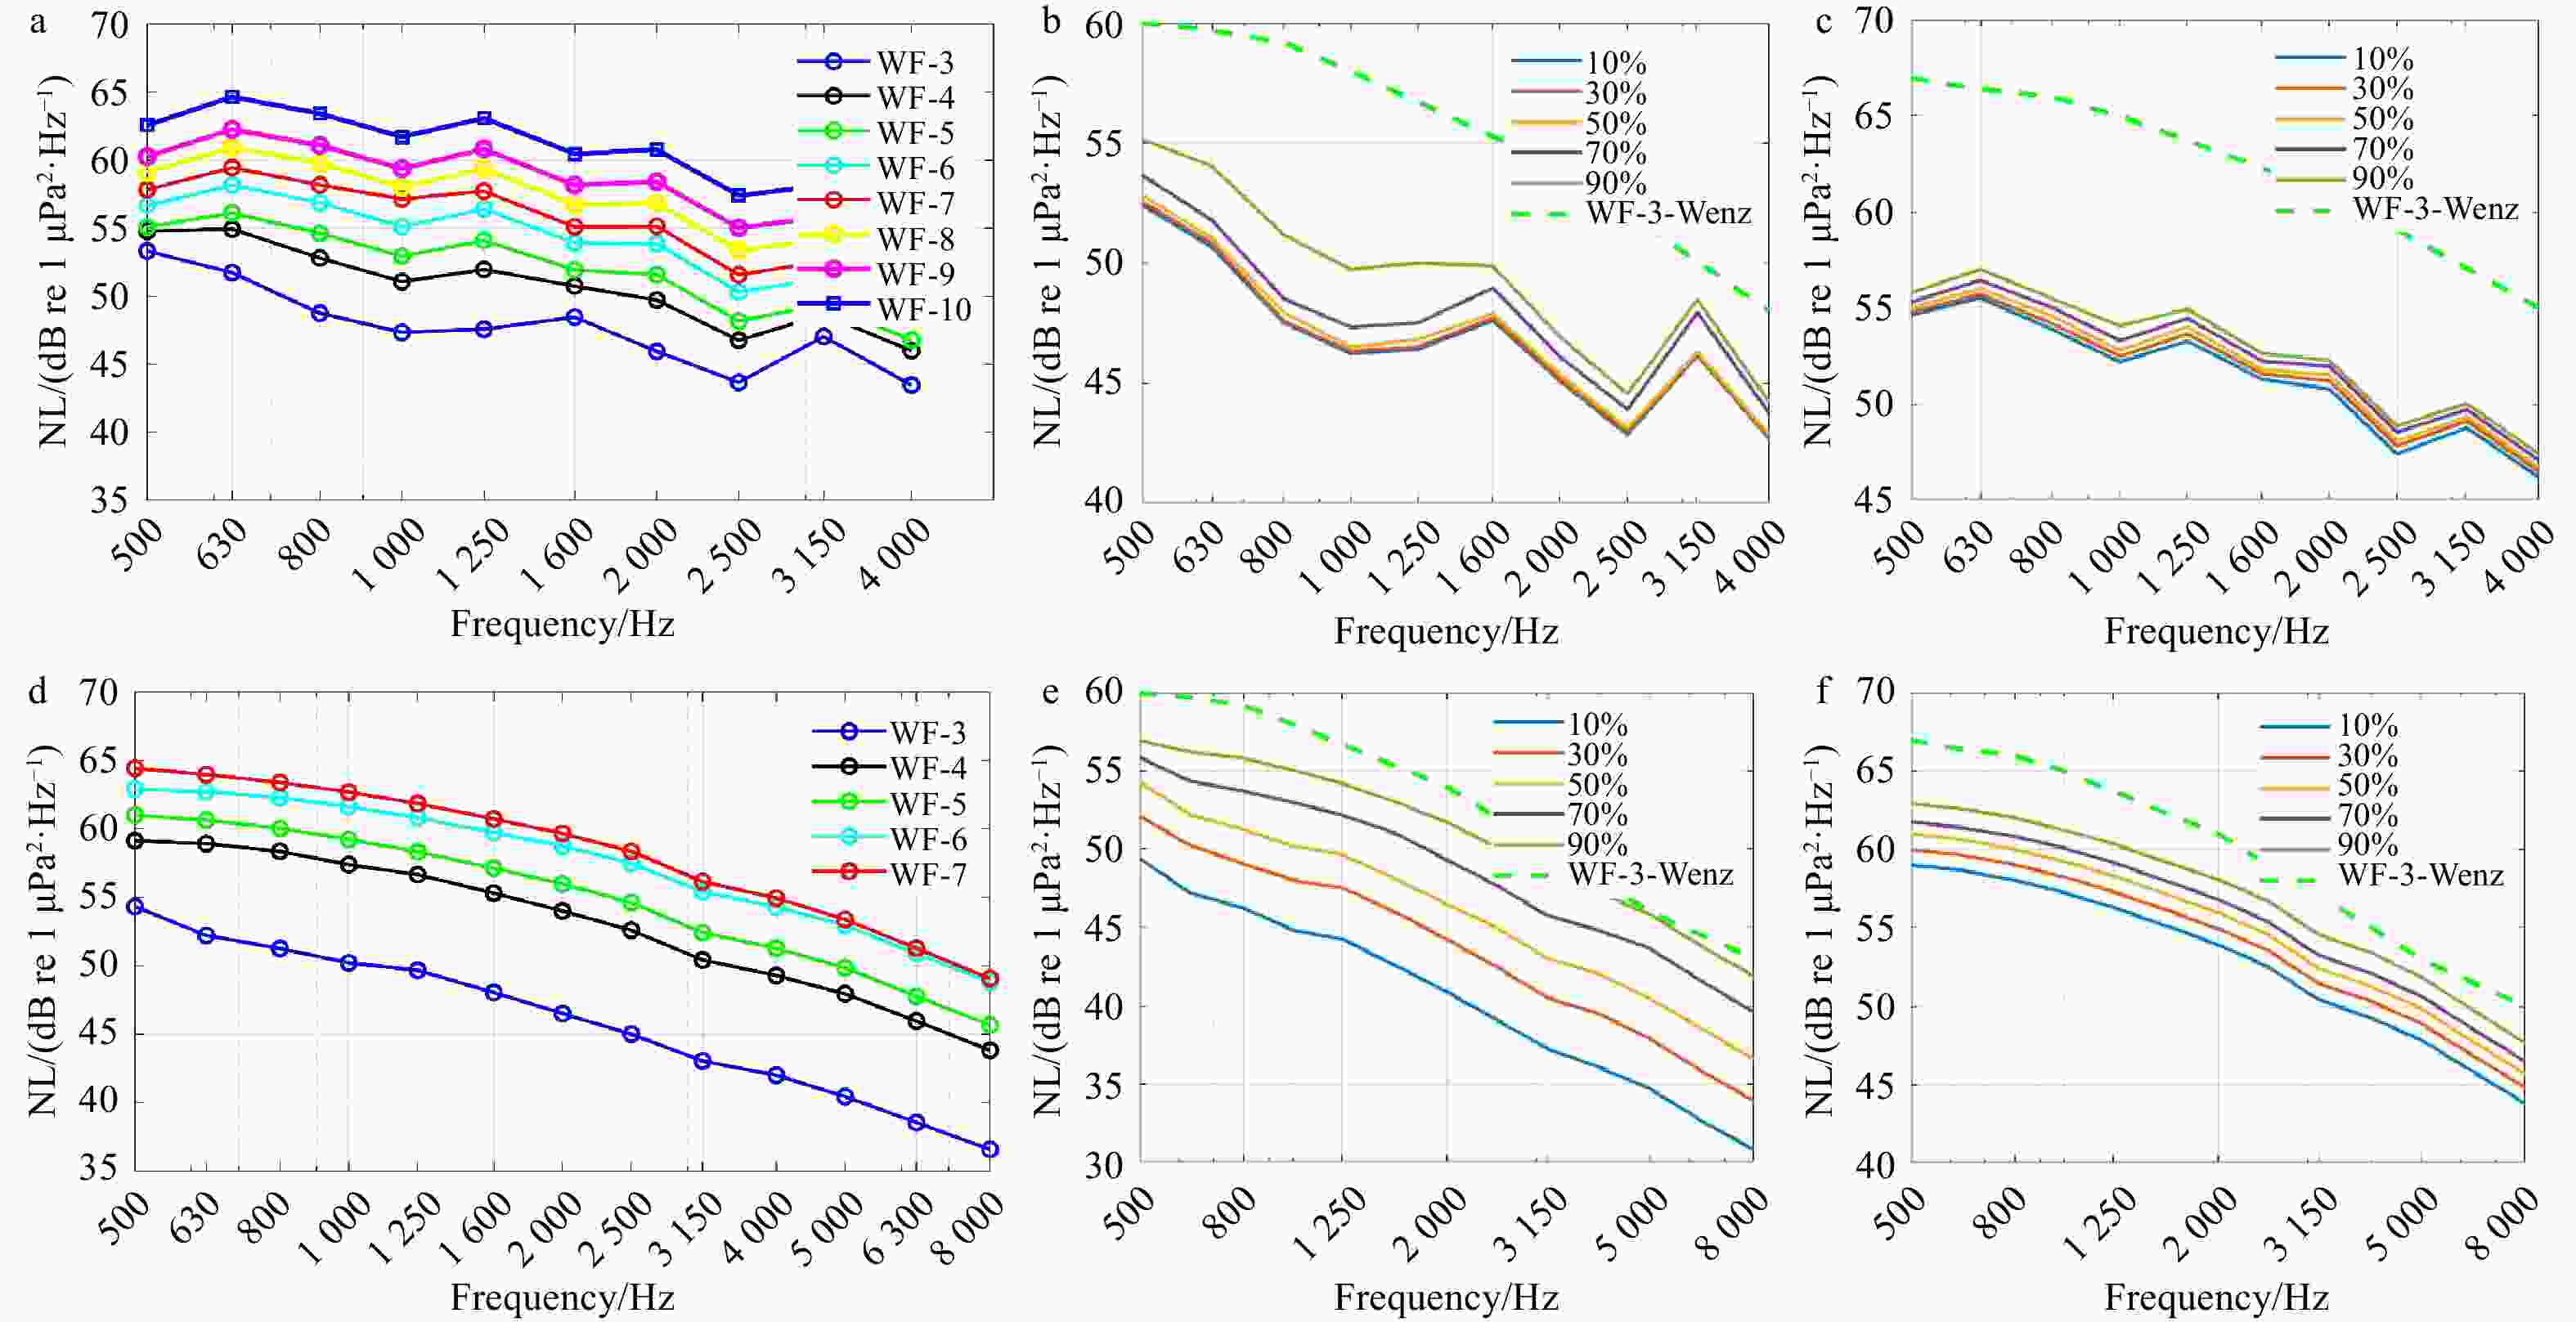
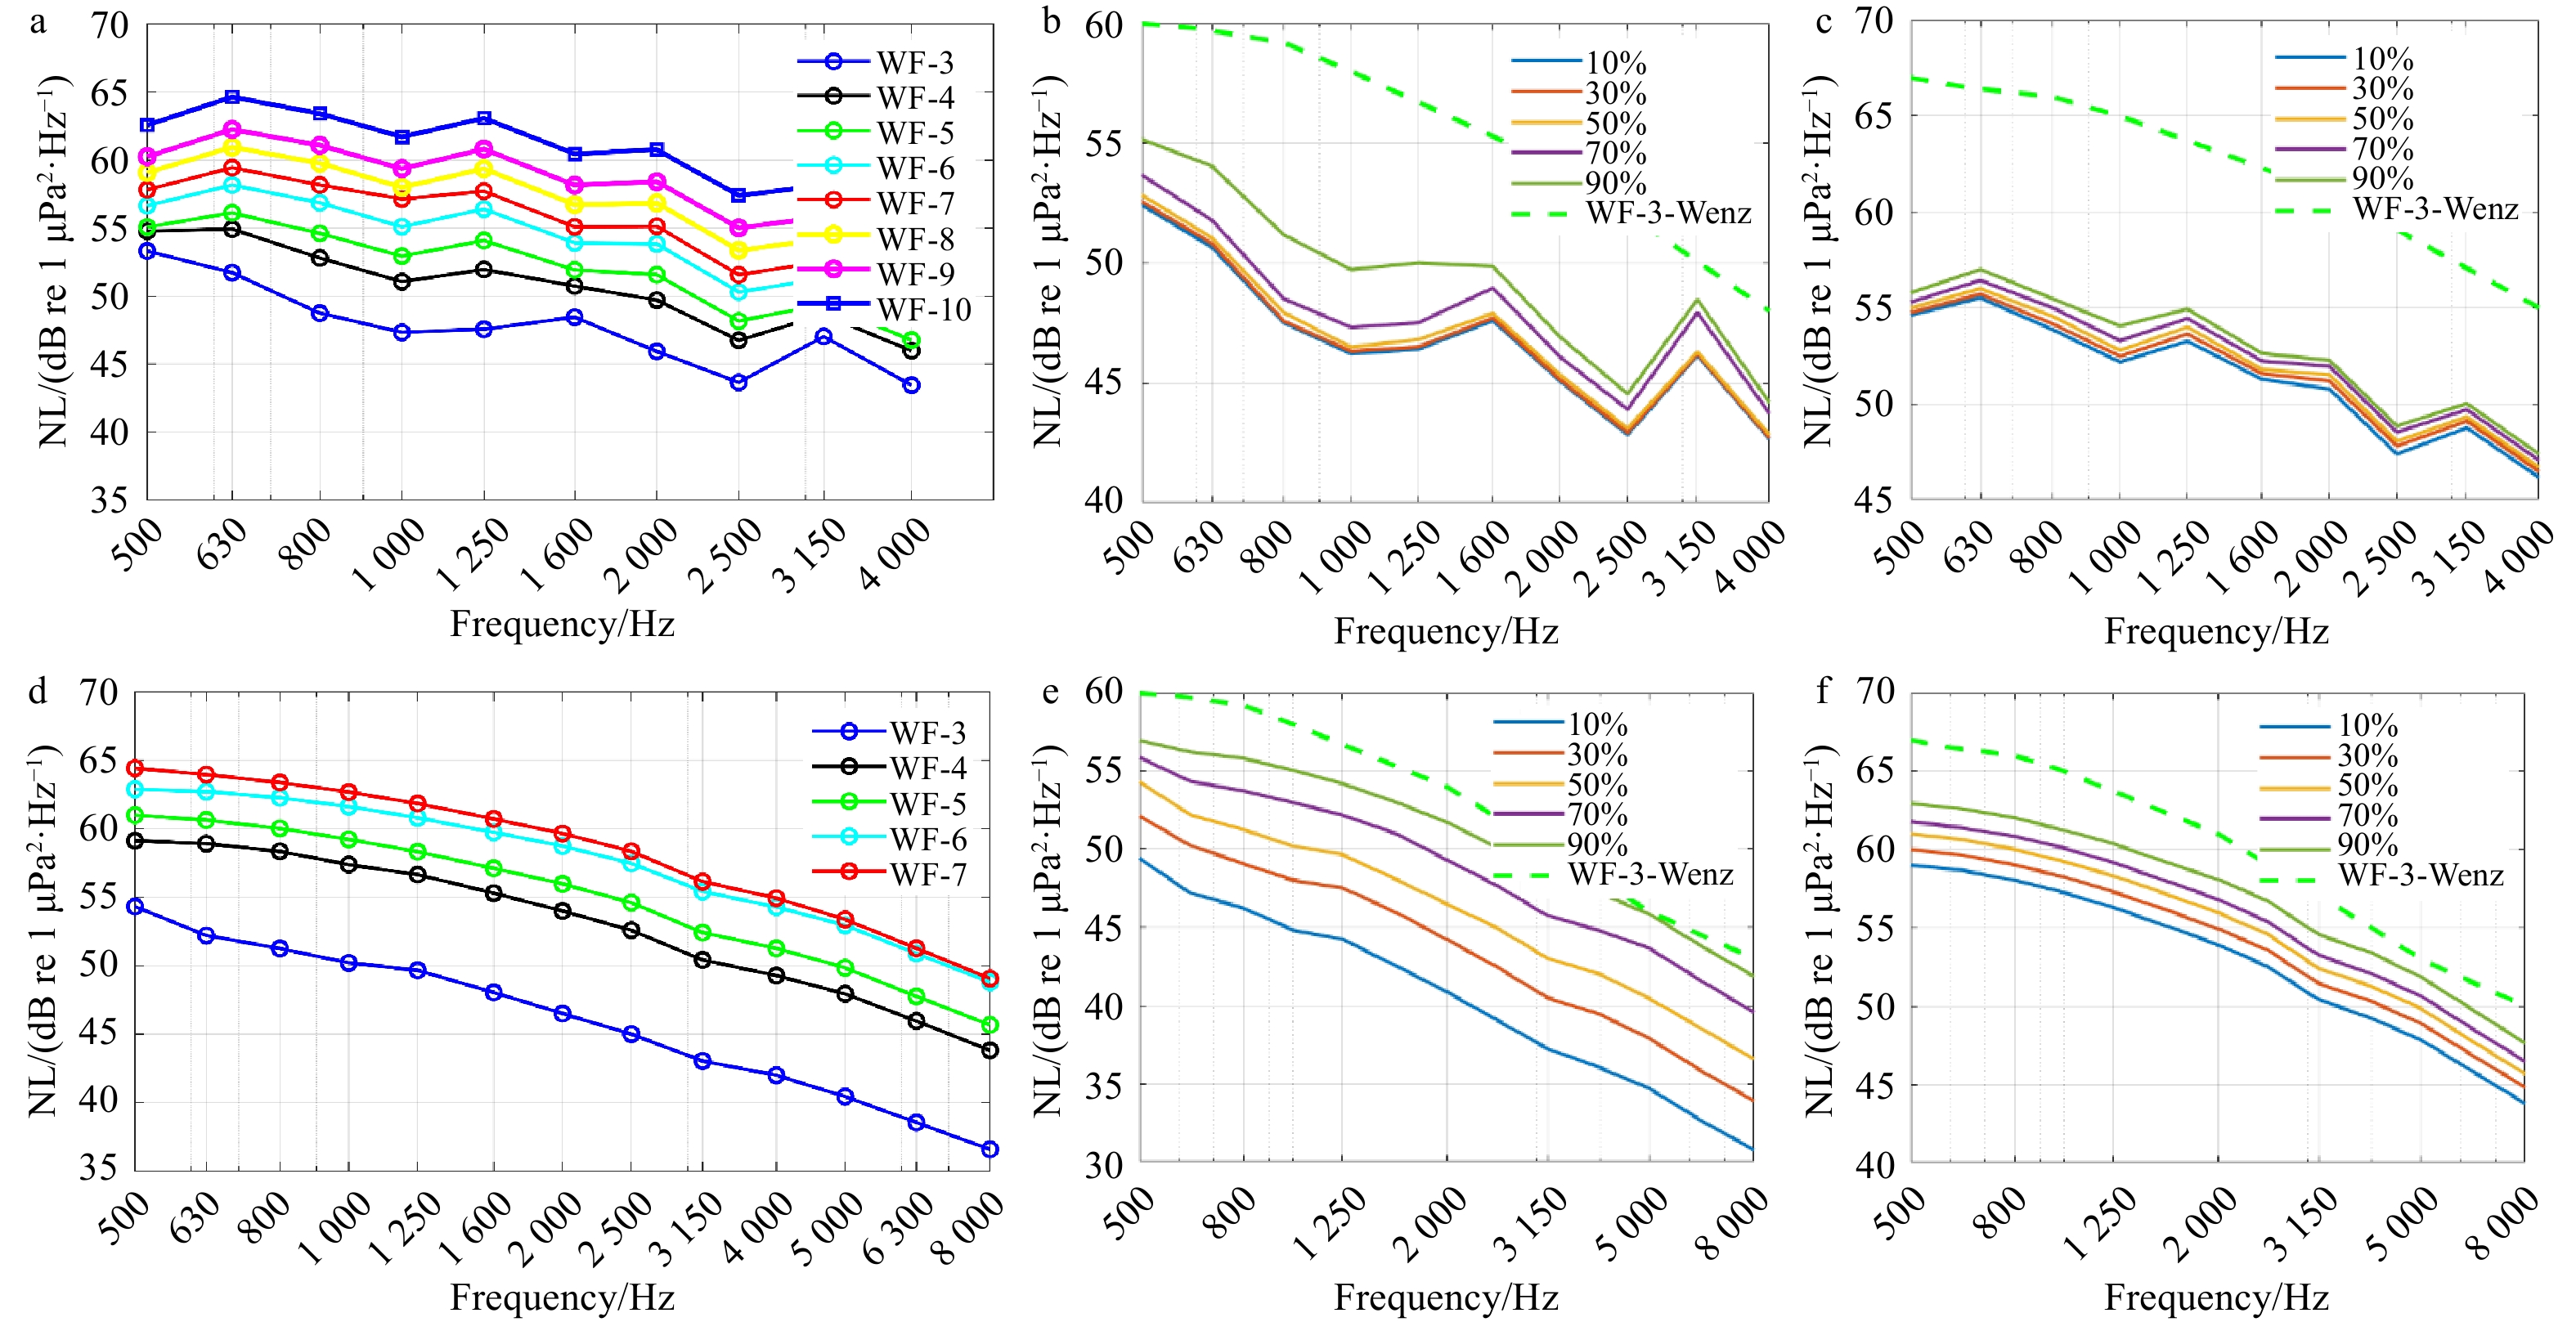
Figure 4. Experimental noise levels (NLs) at different wind force scales and comparison with Wenz curve. a. NL in WP2013; b. NL at WF-3 in WP2013; c. WF-5, WP2013; d. NL in SCS2016; e. WF-3, in SCS2016; f. WF-5, in SCS2016.
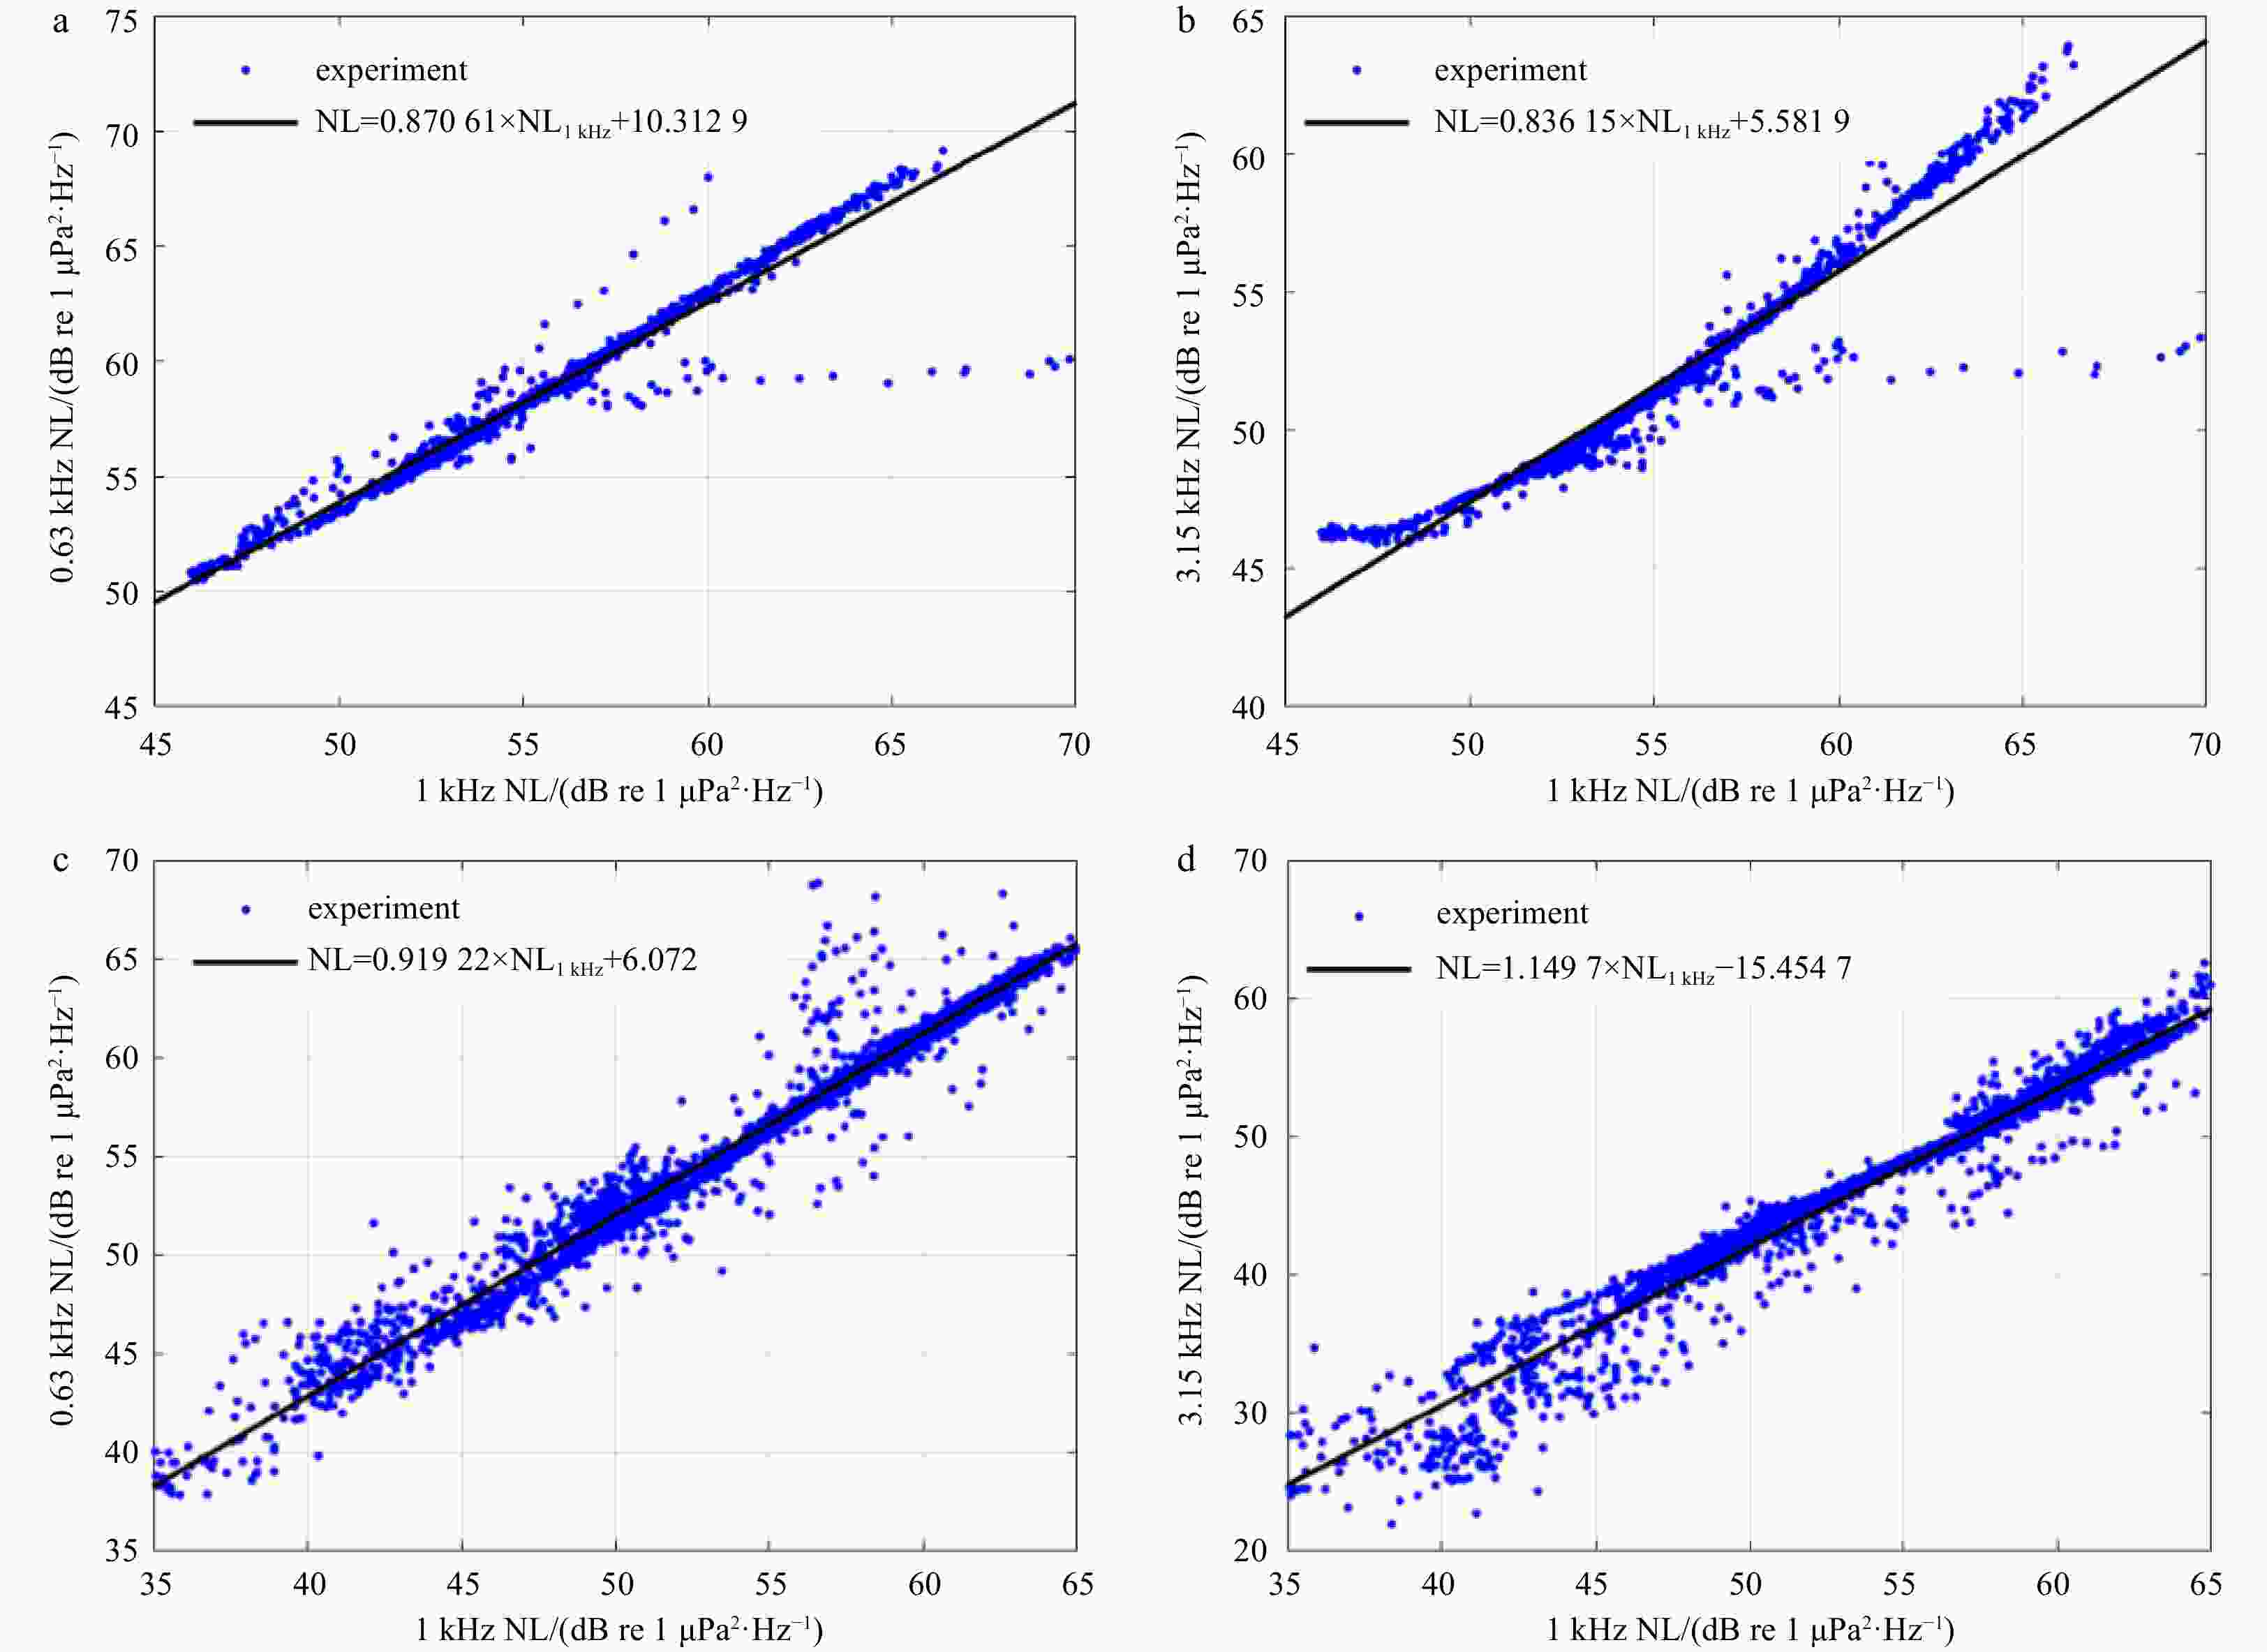
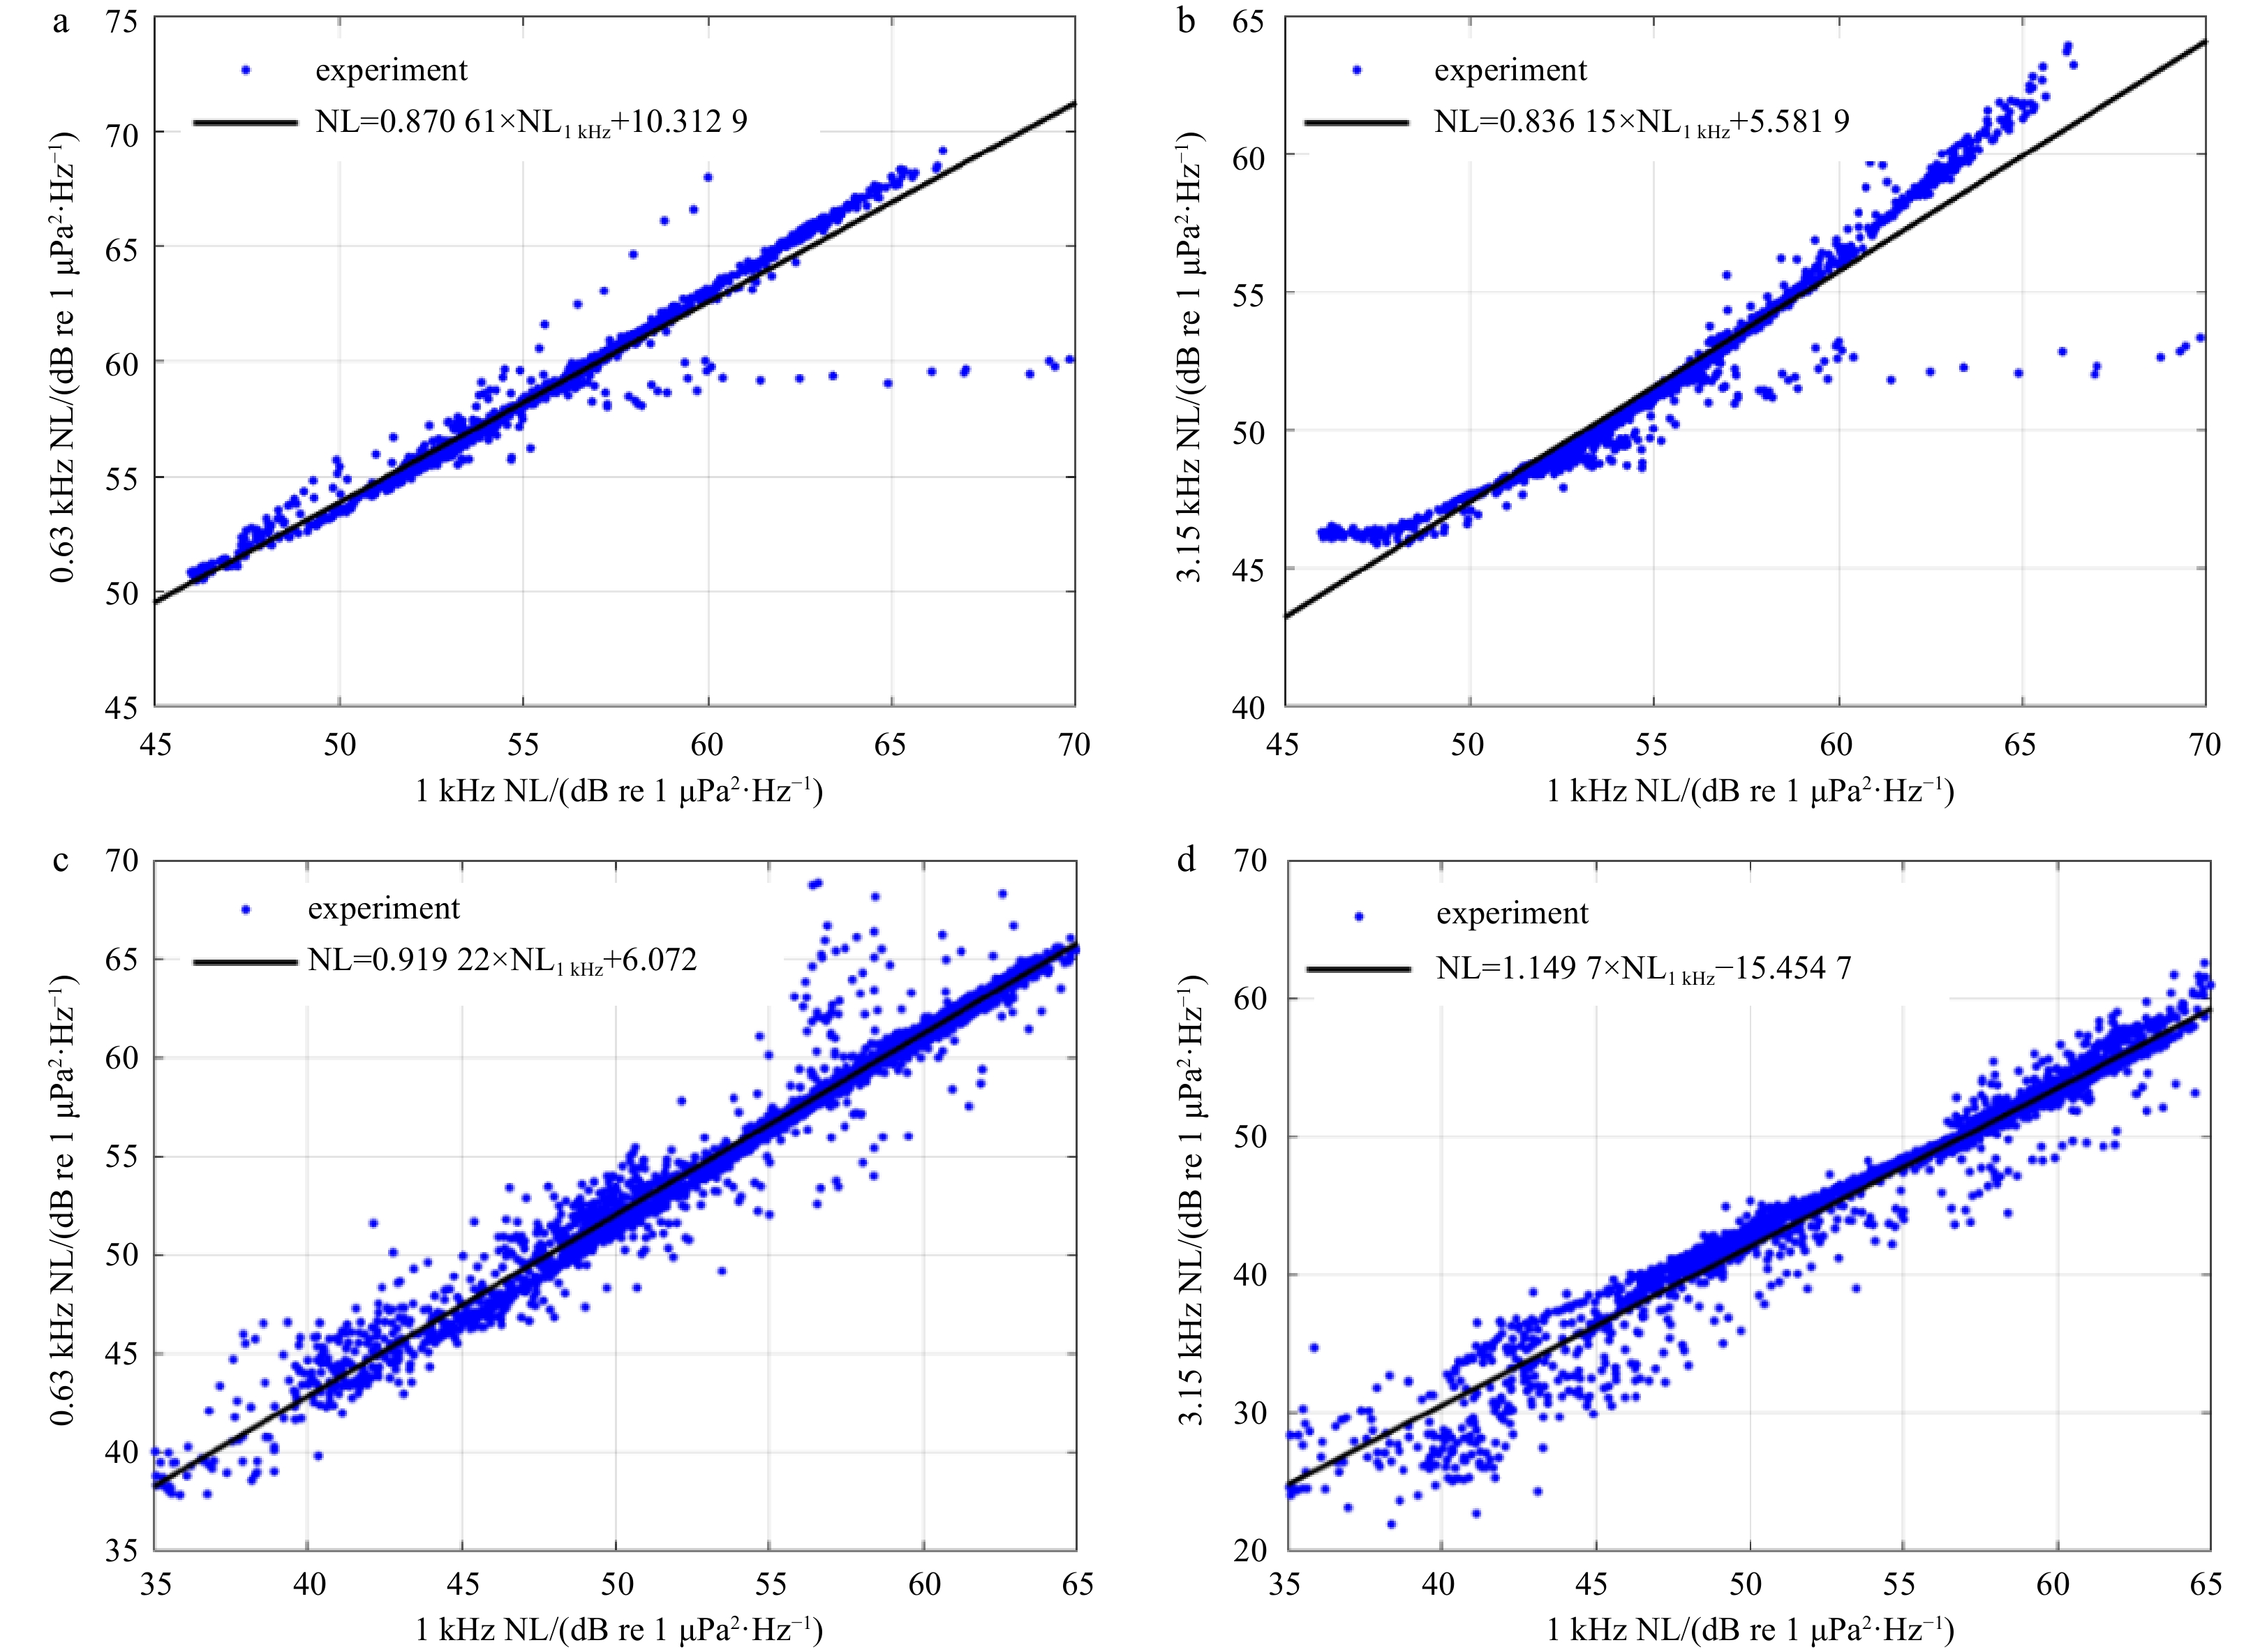
Figure 6. Fitting results between noise levels (NLs) and NL at 1 kHz during typhoon periods in experiments. a. NL at 630 Hz in WP2013; b. 3 150 Hz, WP2013; c. 630 Hz, SCS2016; d. 3 150 Hz, SCS2016.

Figure 7. Correlation coefficient of noise levels during typhoon period in experiments. a. WP2013; b. SCS2016.

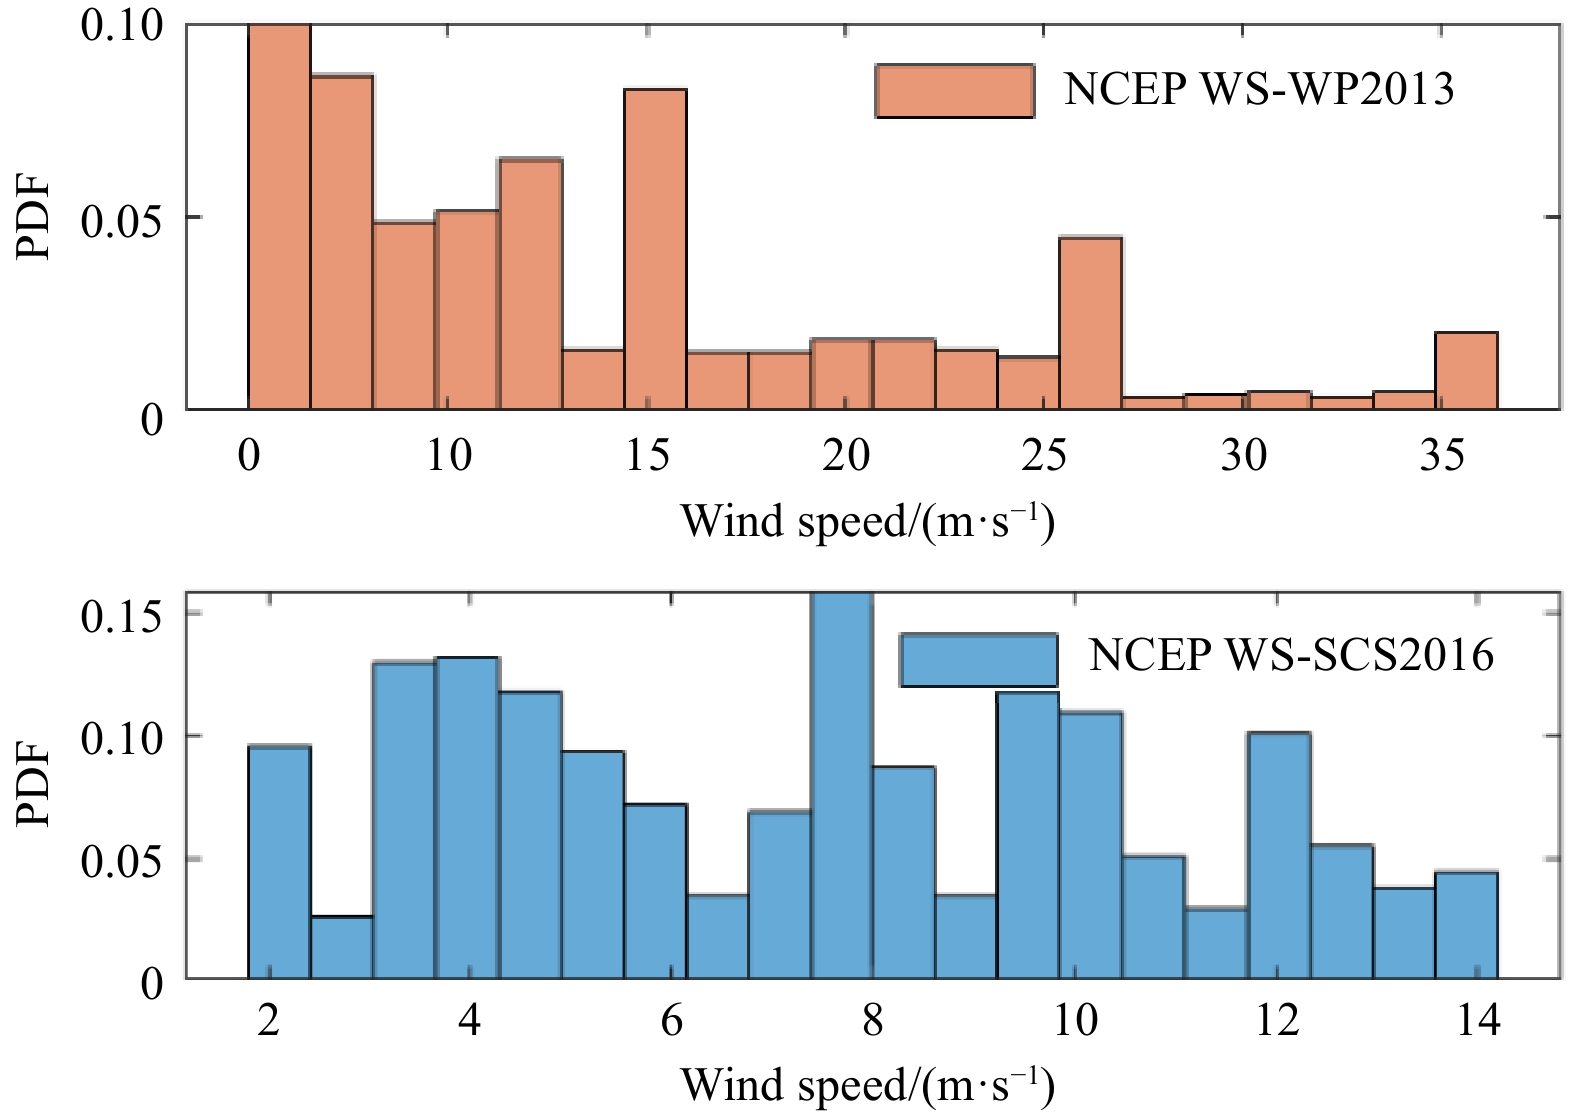
Figure 8. Histogram of National Centers for Environmental Prediction (NCEP) wind speed (WS) during typhoon period in experiments of WP2013 and SCS2016. PDF: probability density function.

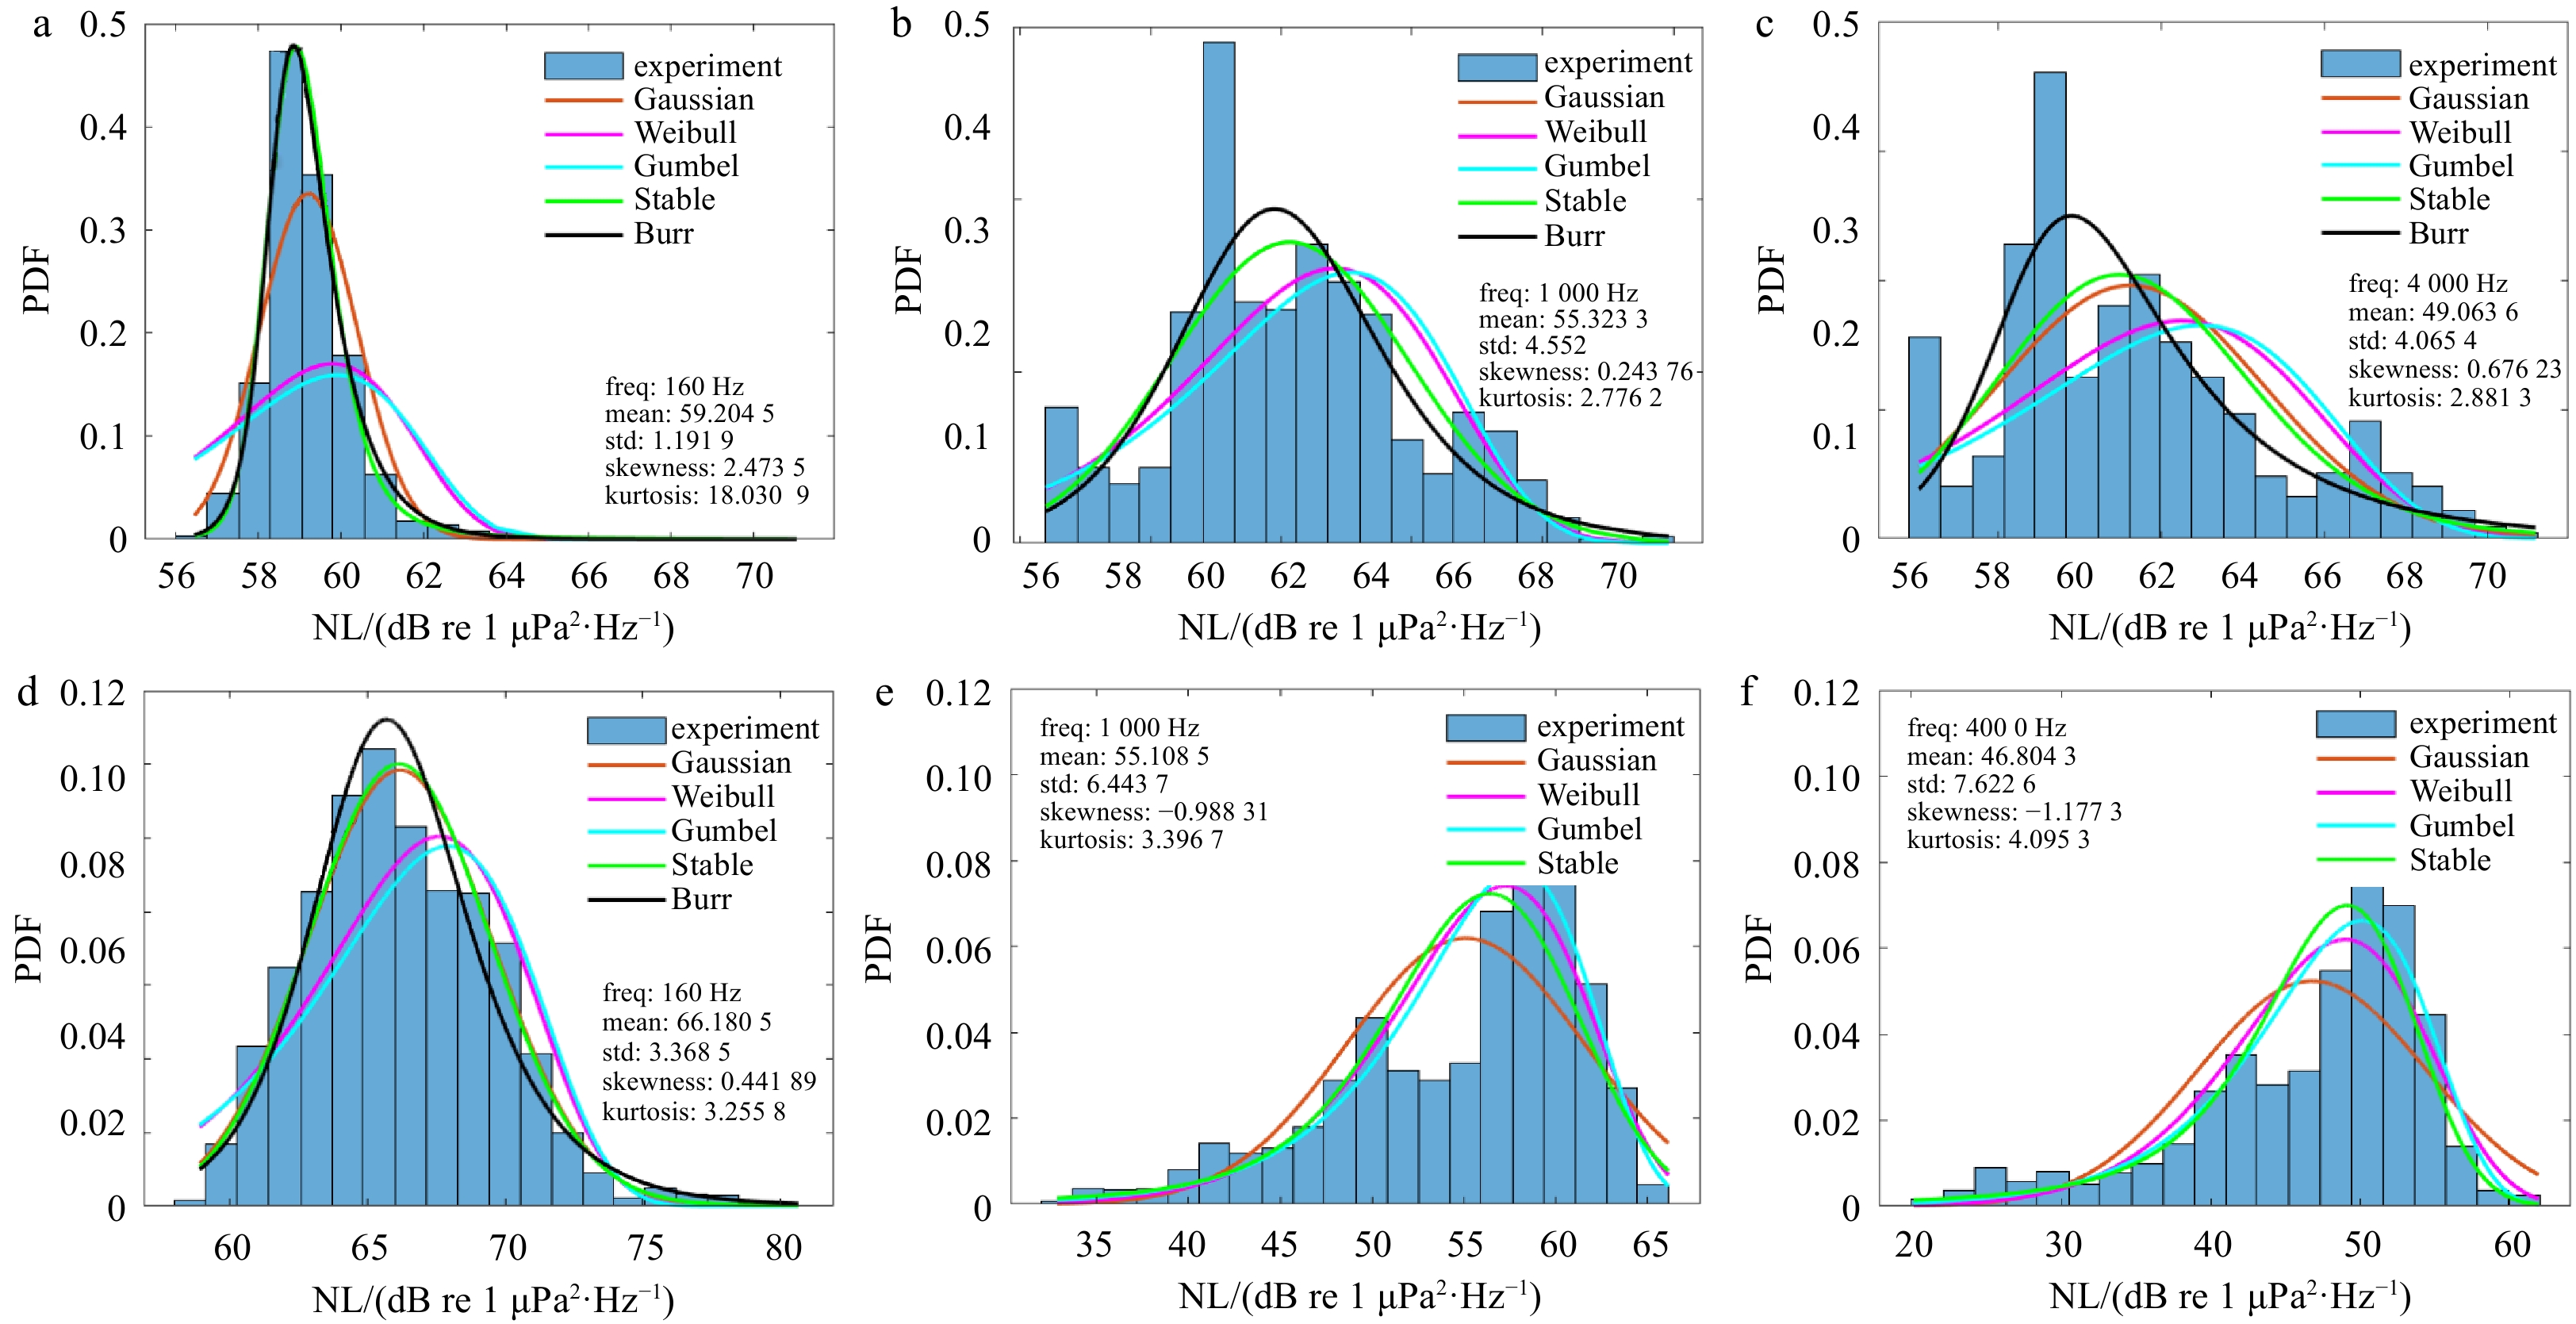
Figure 9. Probability density function (PDF) of ambient noise levels (NLs) during typhoon period in experiments of WP2013 and SCS2016. a. 160 Hz, WP2013; b. 1 000 Hz, WP2013; c. 4 000 Hz, WP2013; d. 160 Hz, SCS2016; e. 1 000 Hz, SCS2016; f. 4 000 Hz, SCS2016.
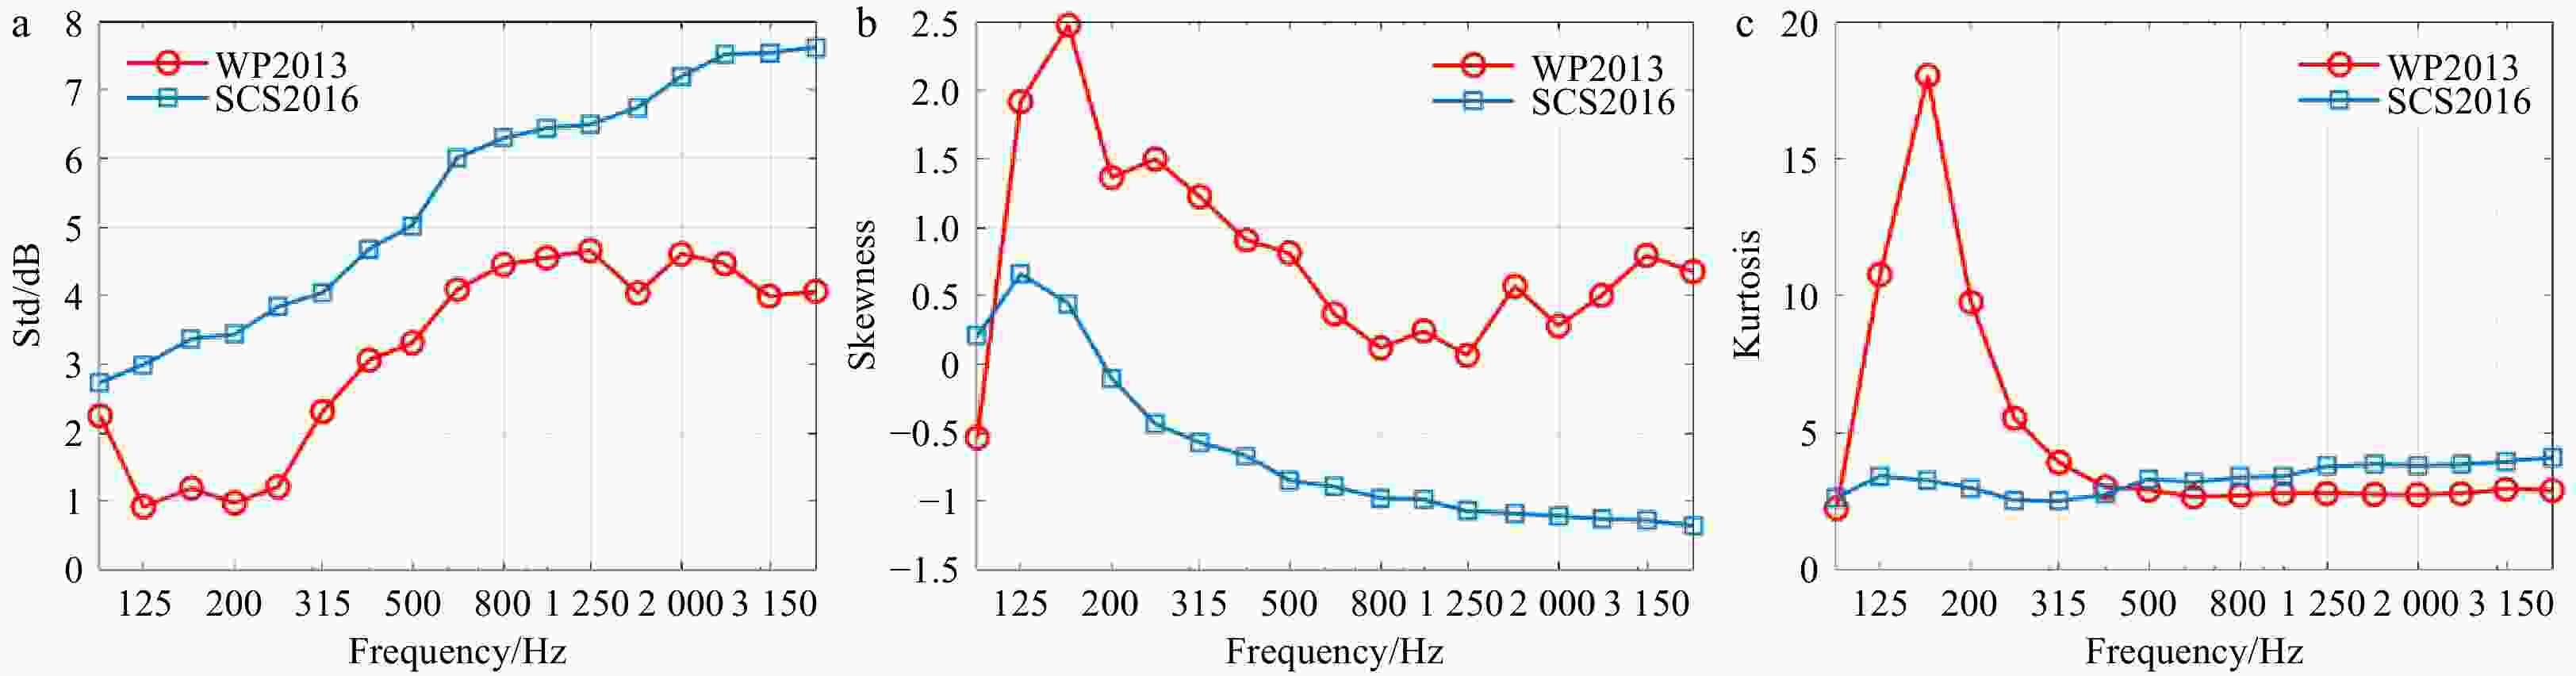
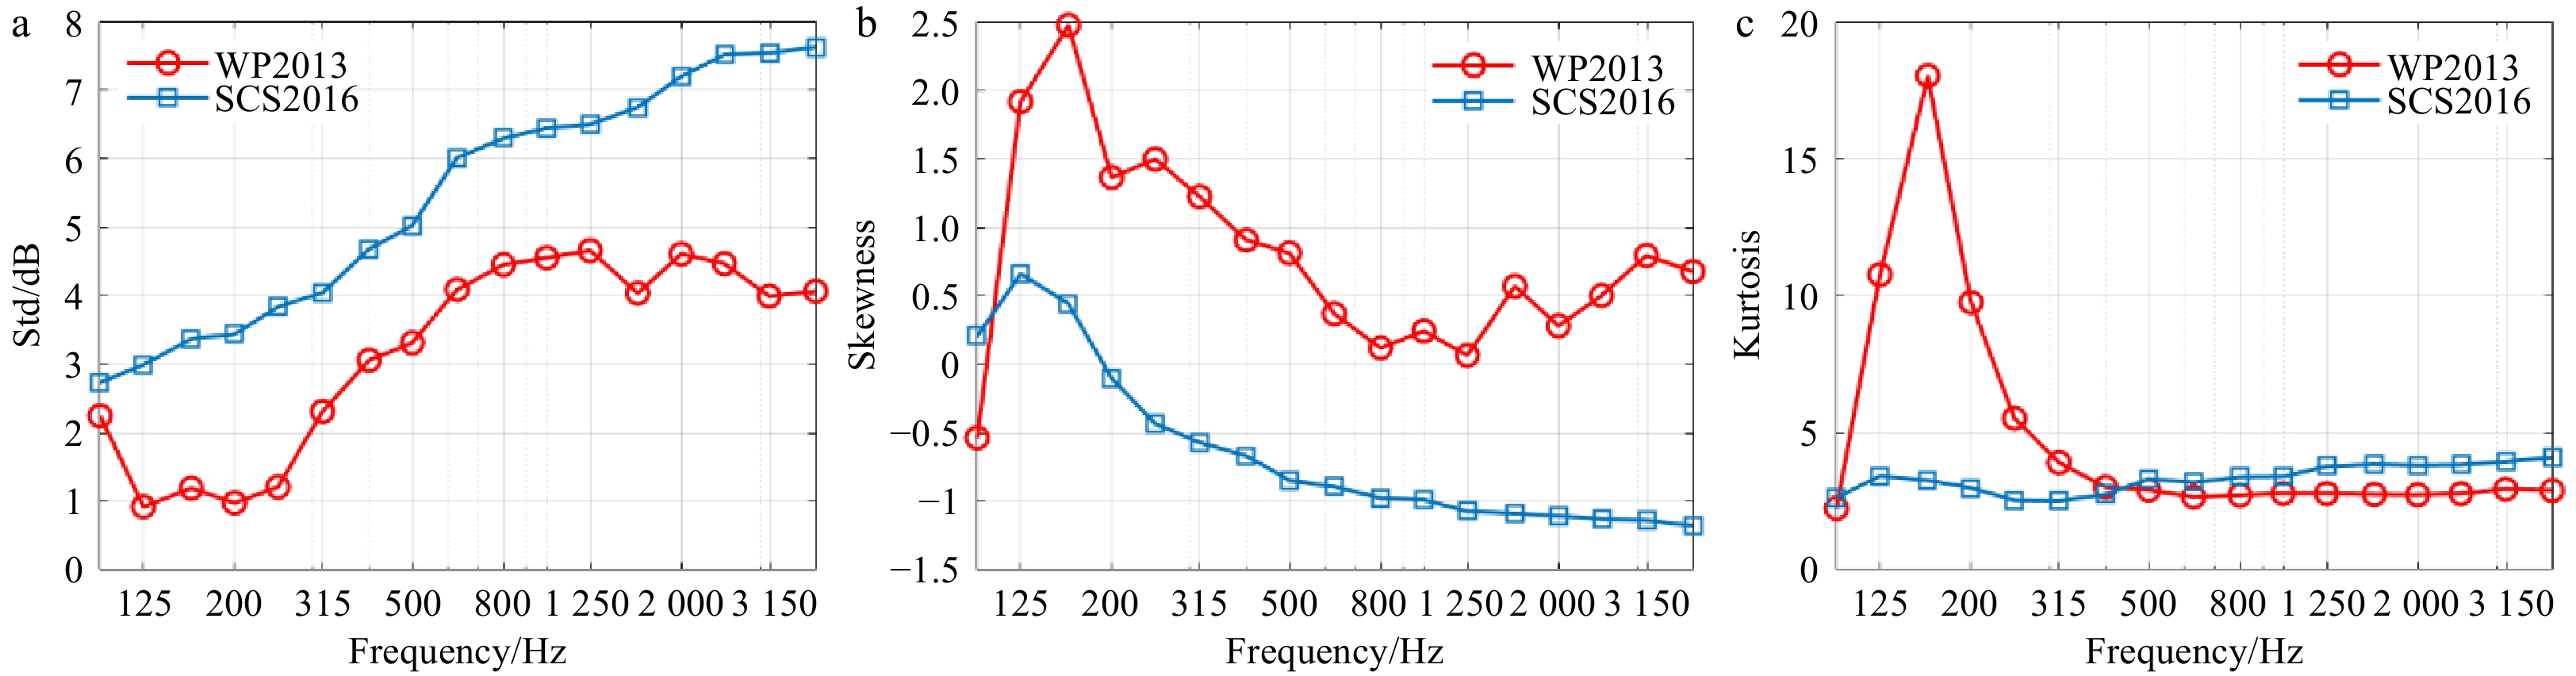
Figure 10. Comparison of statistic results of ambient noise levels during typhoon period in experiments of WP2013 and SCS2016. a. Standard deviation (std); b. skewness; c. kurtosis.

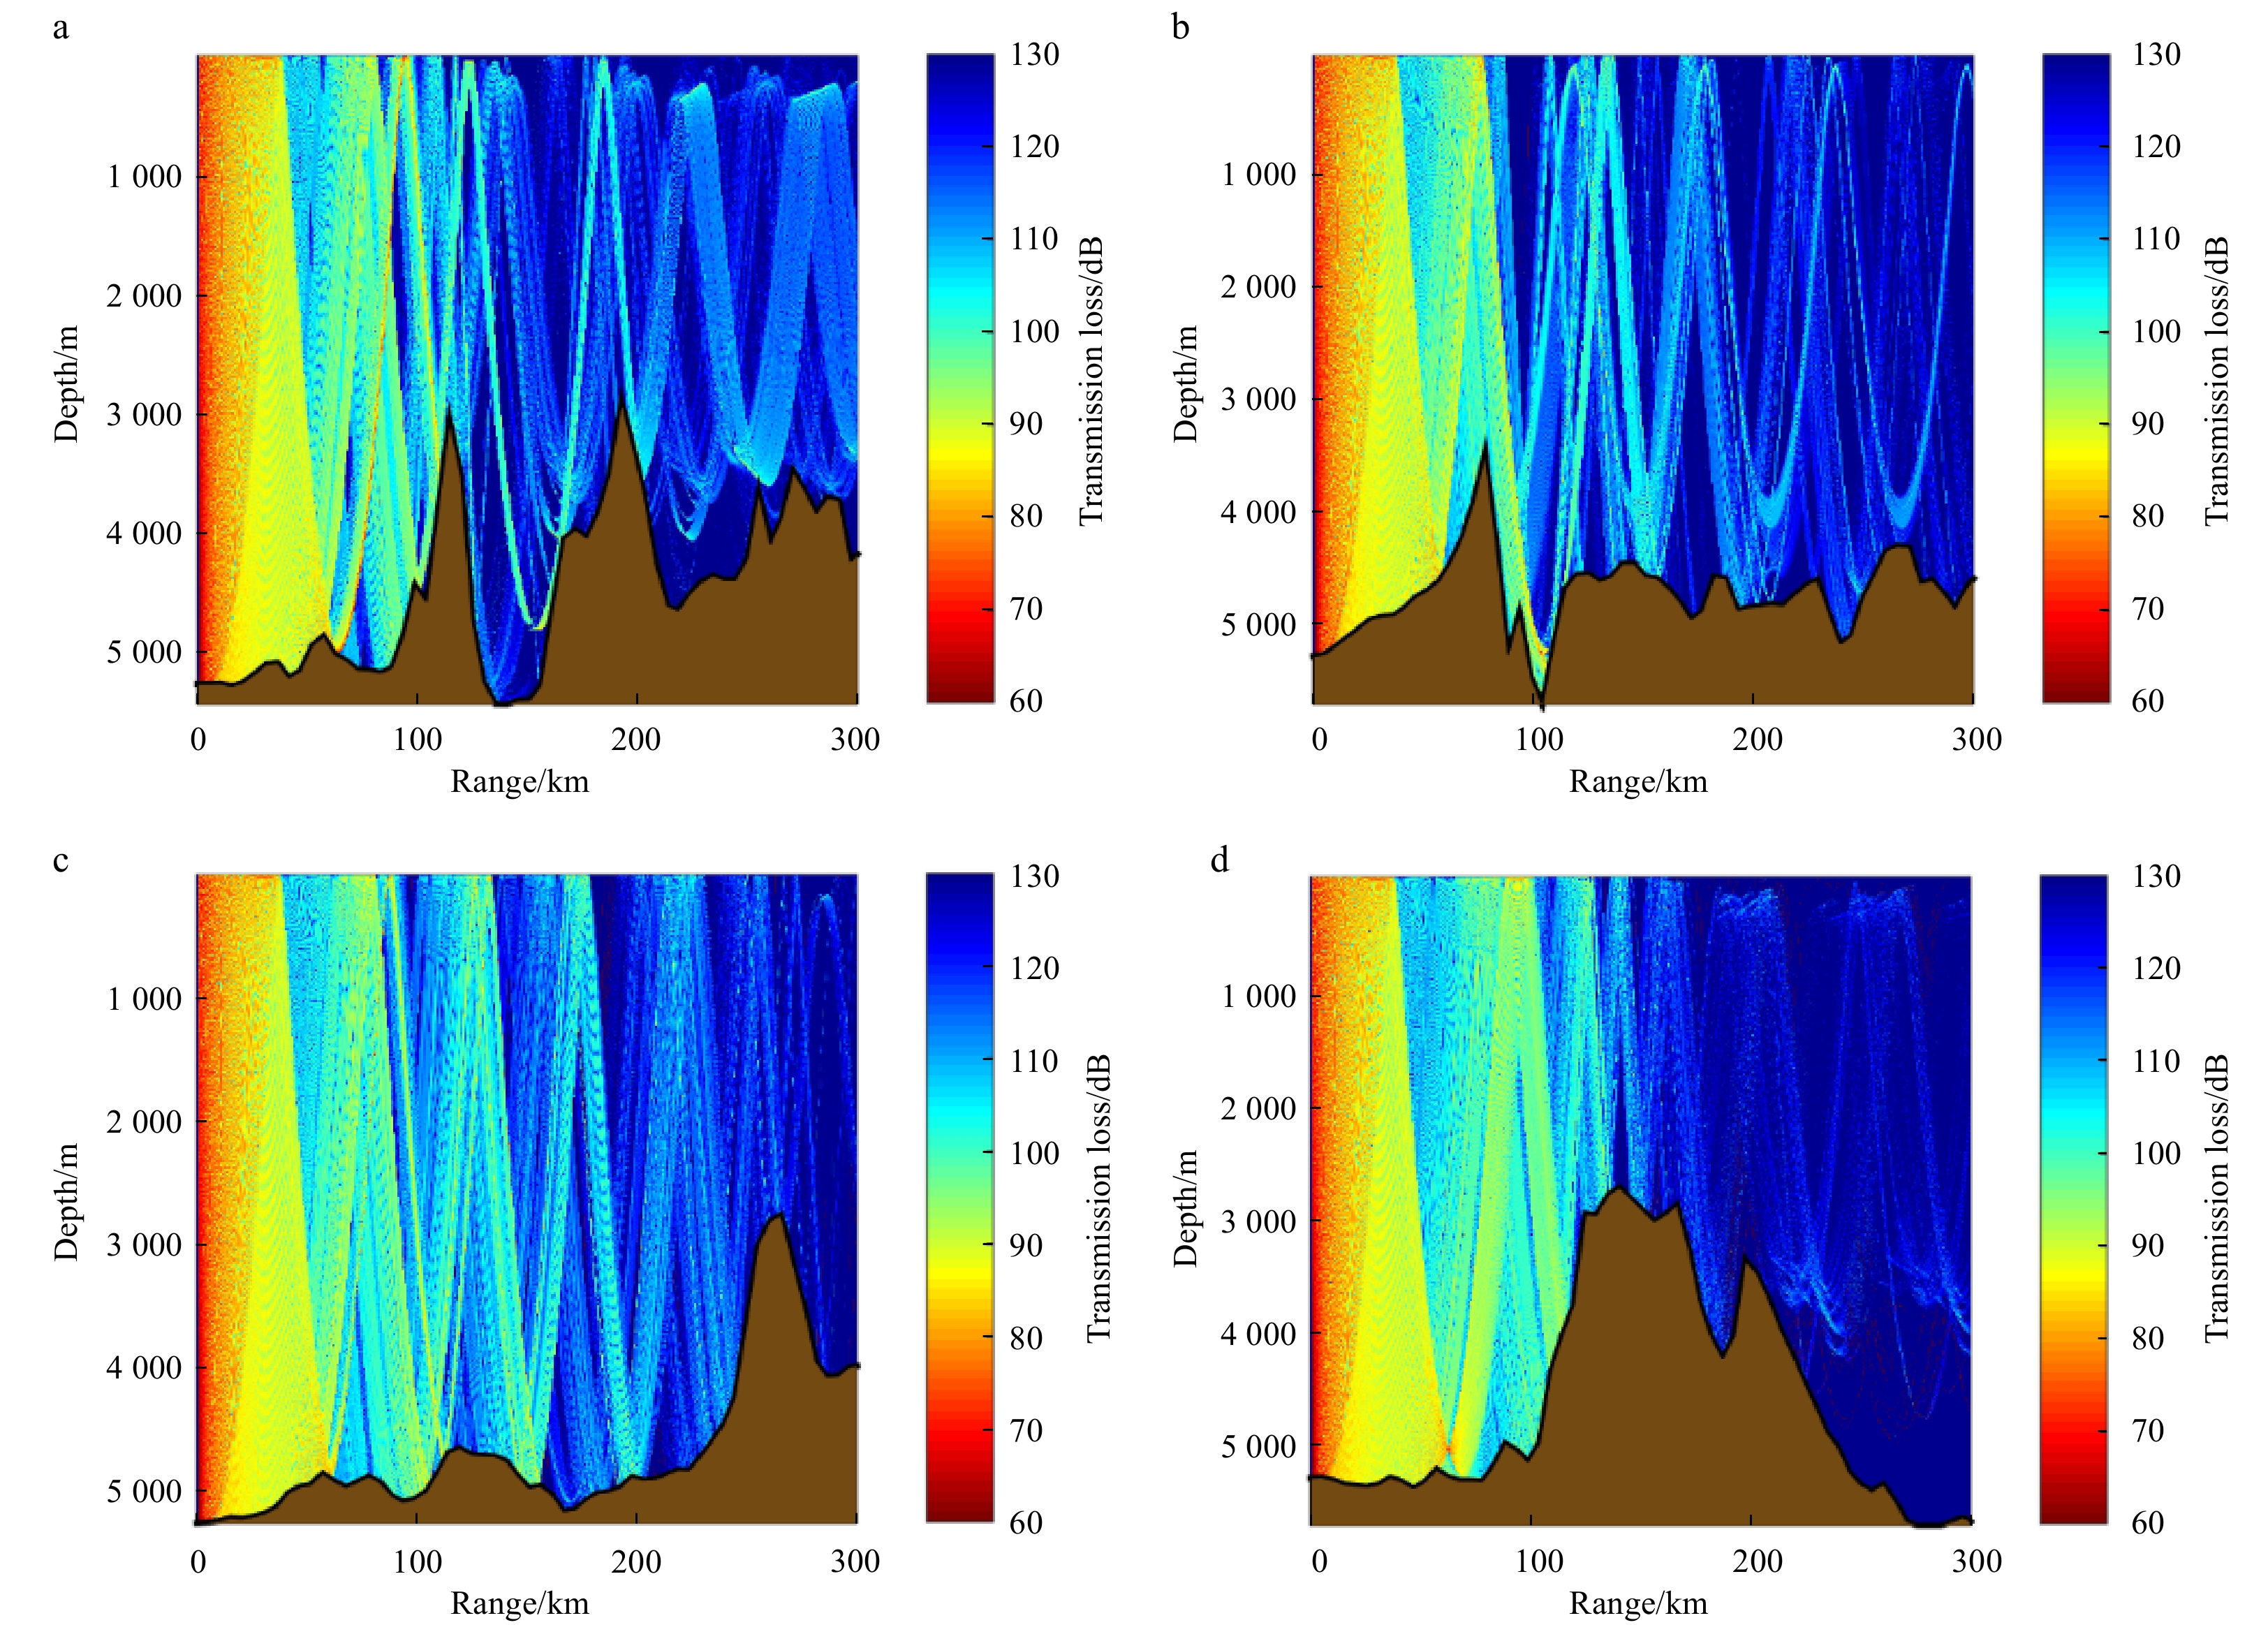
Figure 12. Transmission loss simulation results at azimuth angles 0° (a), 90° (b), 180° (c) and 270° (d) at 500 Hz in WP2013.
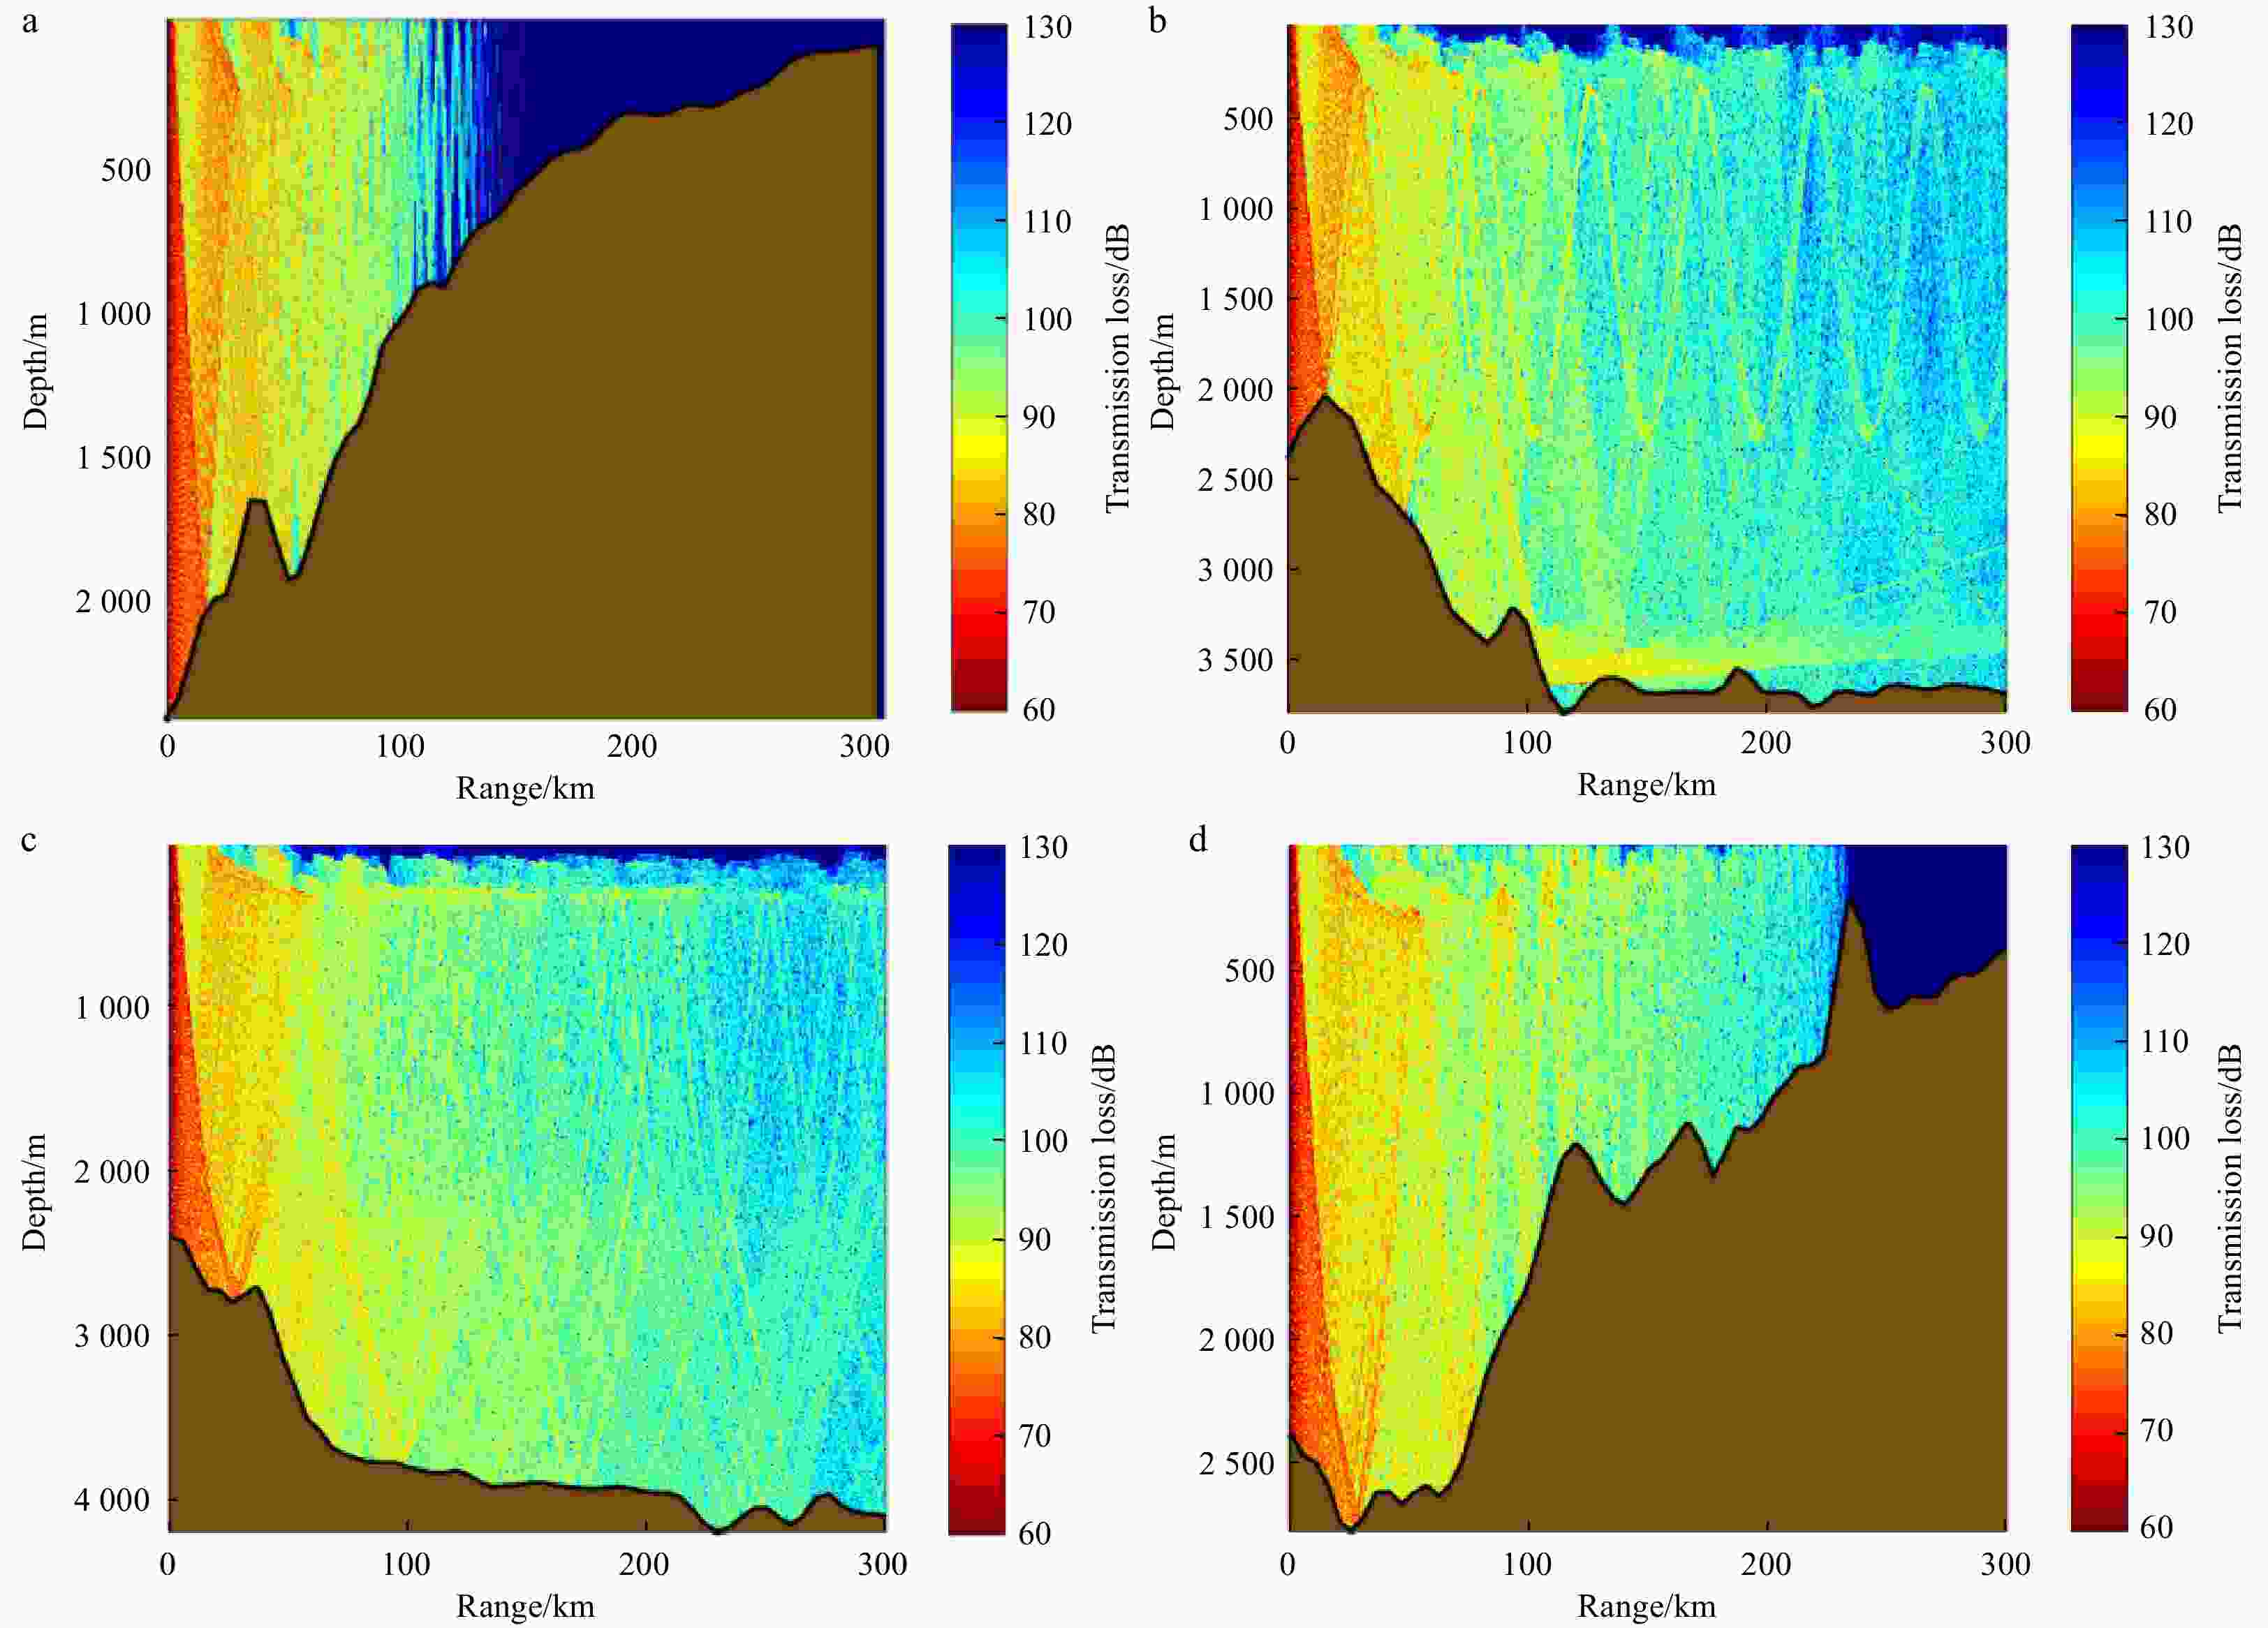
Figure 13. Transmission loss simulation results at azimuth angles 0° (a), 90° (b), 180° (c) and 270° (d) at 500 Hz in SCS2016.
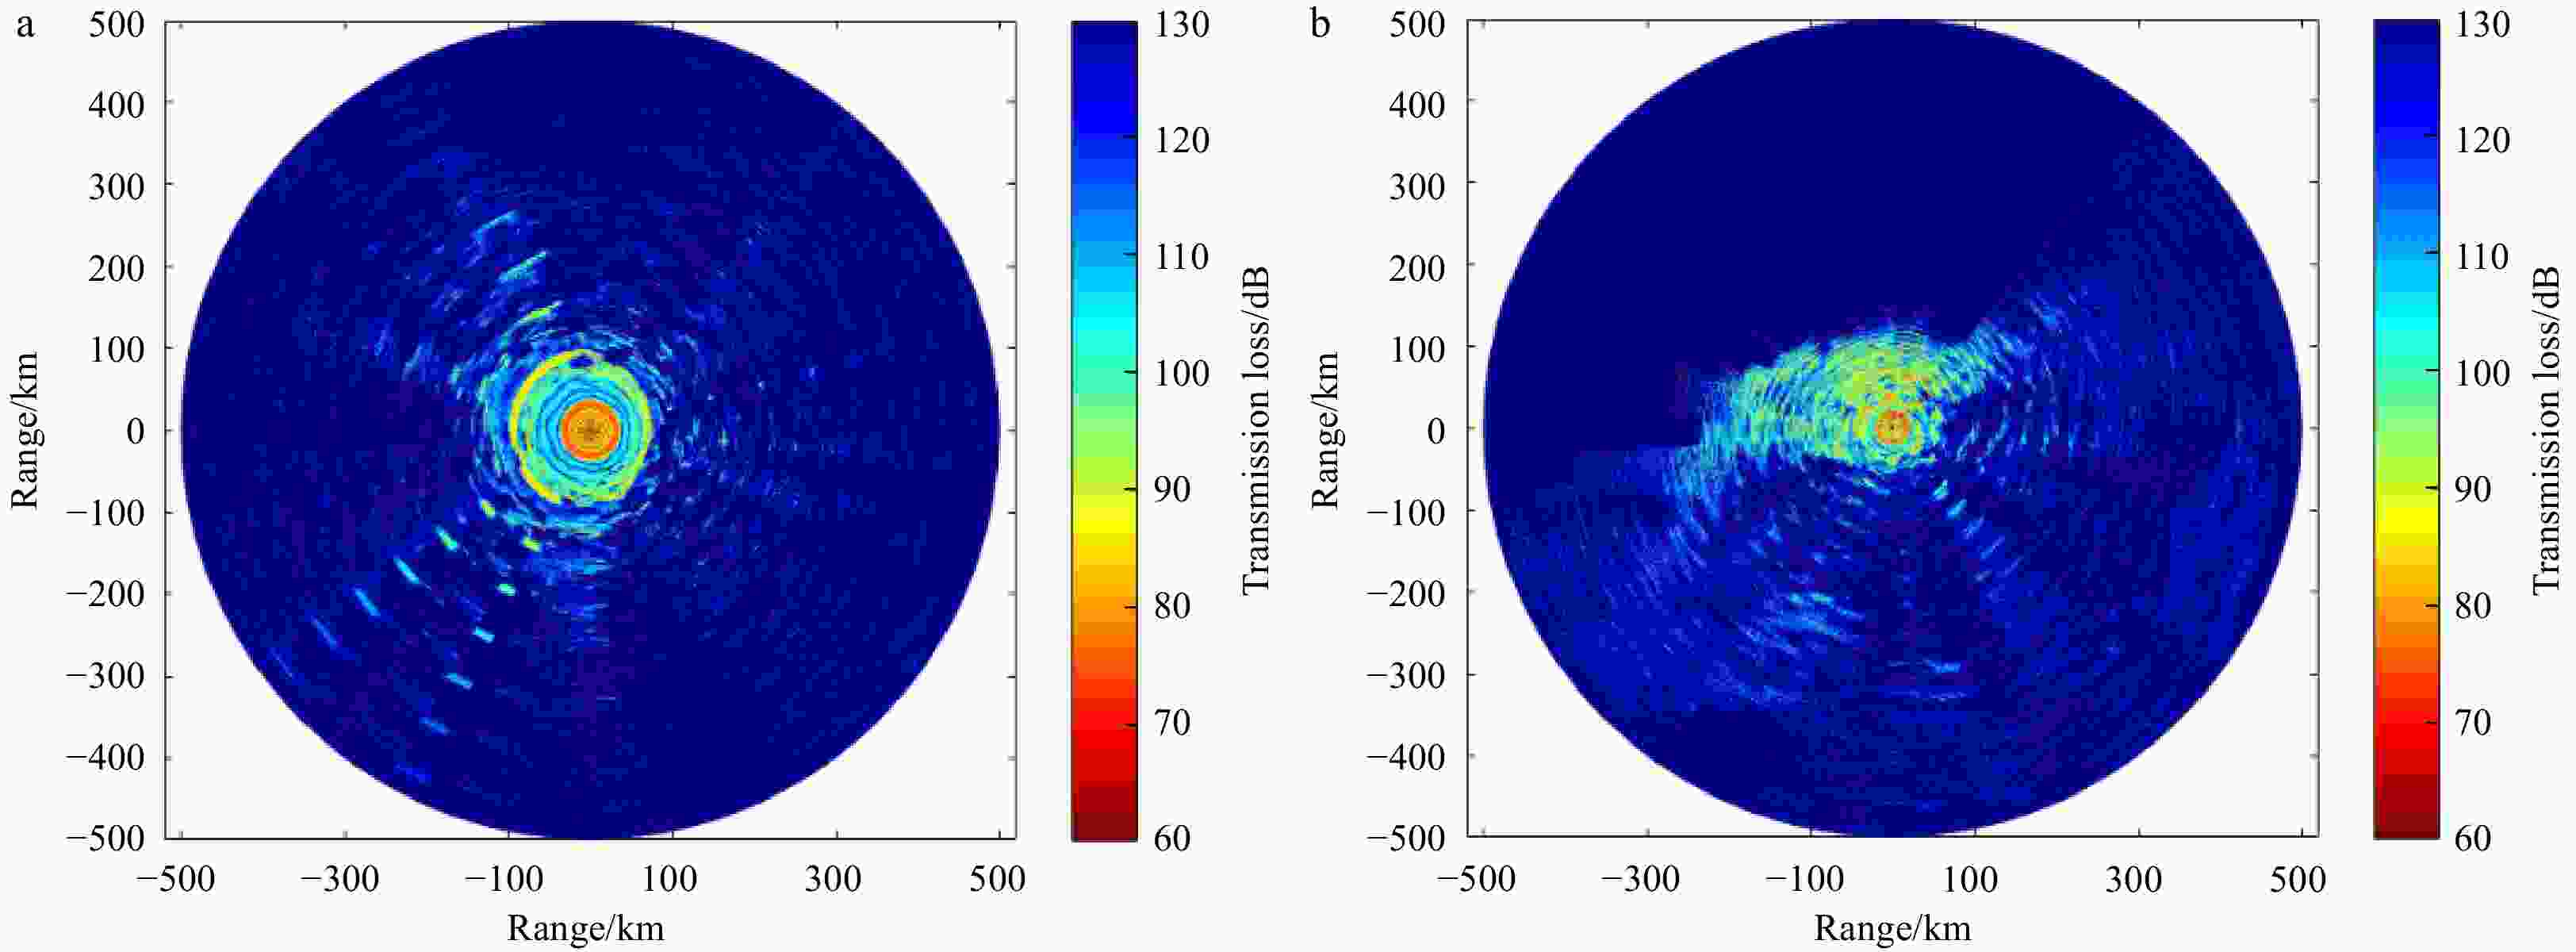
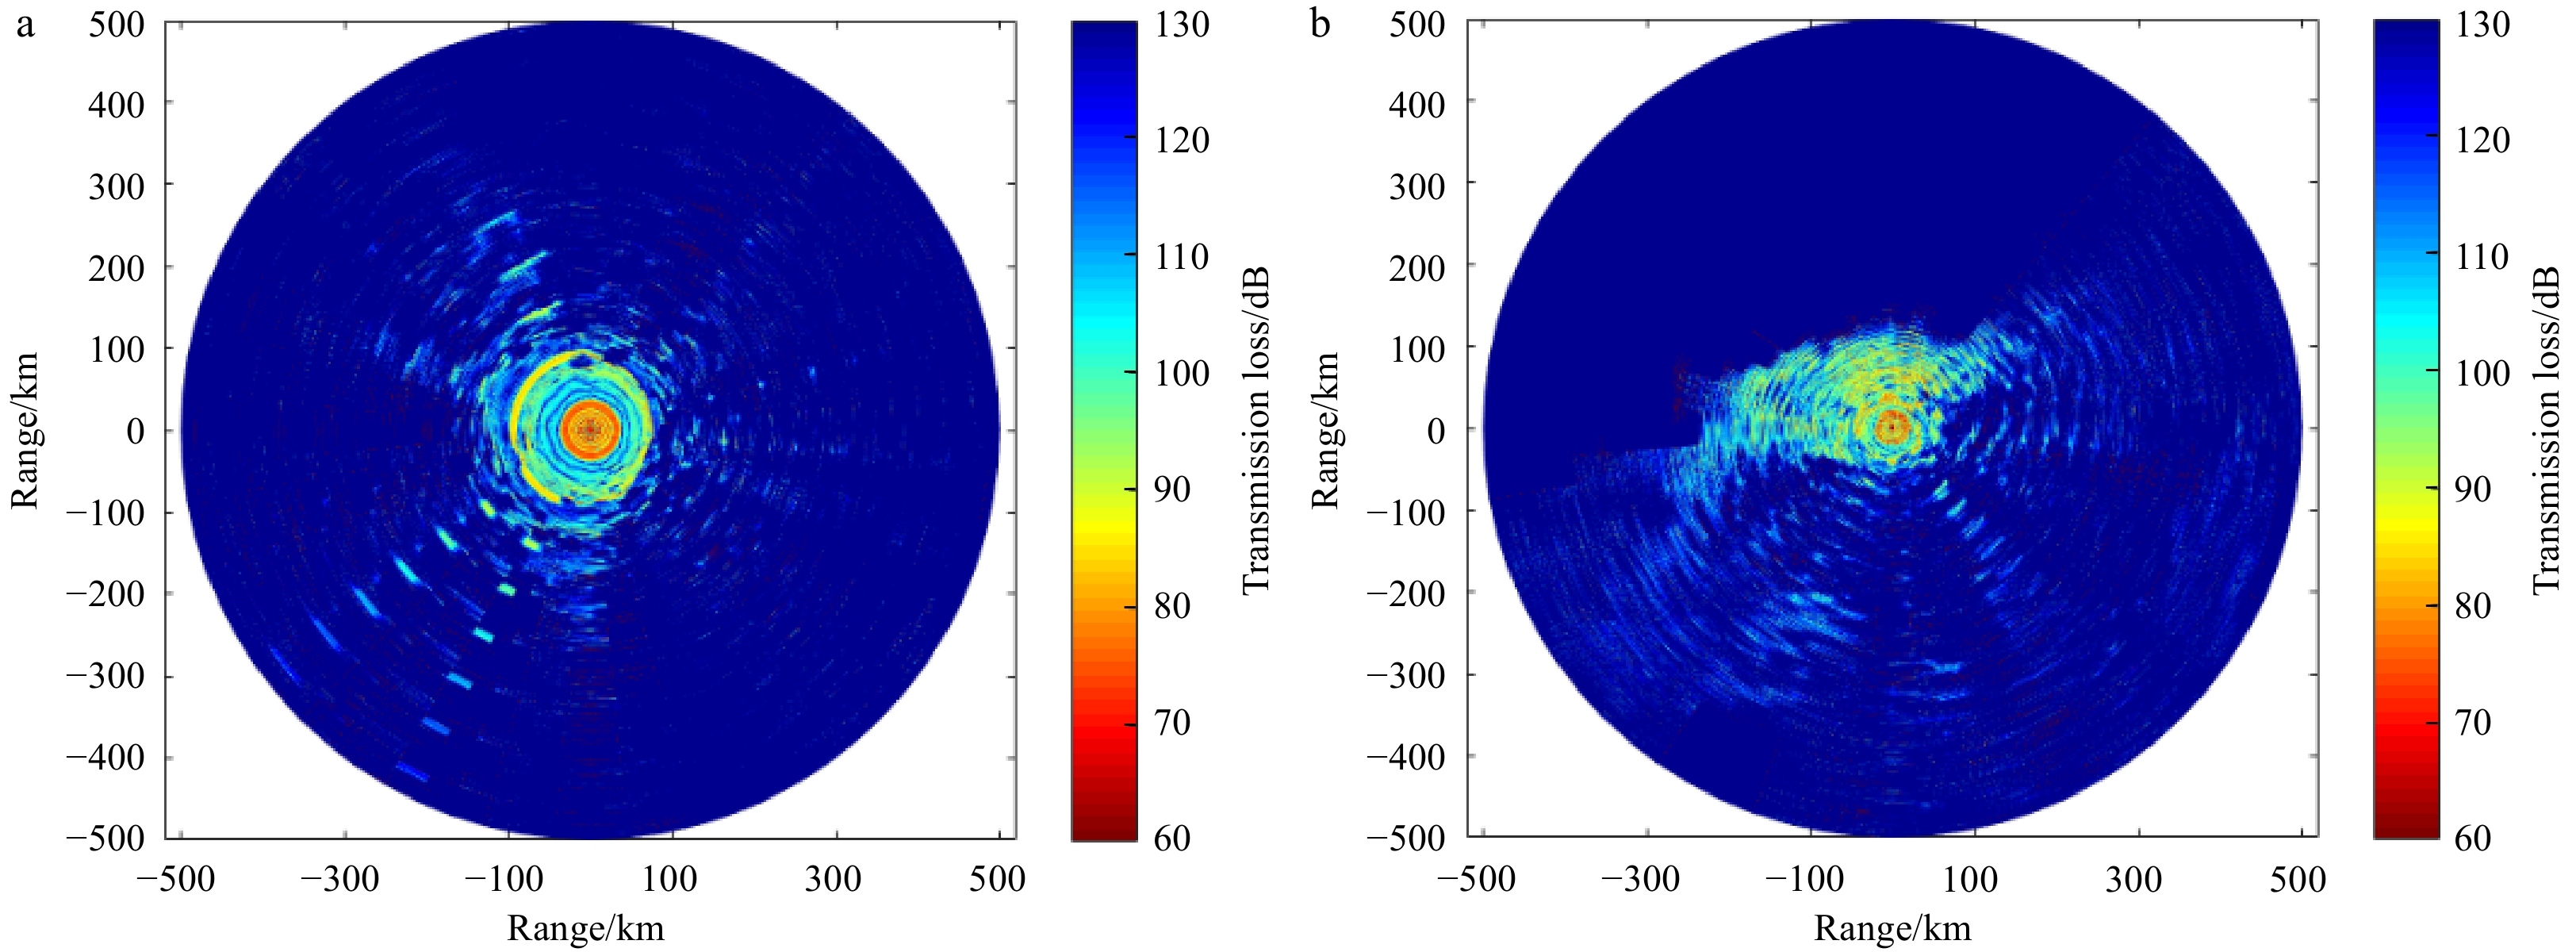
Figure 14. Simulation results of N×2D transmission loss (TL) with ray approach. a. N×2D-TL, WP2013; b. N×2D -TL, SCS2016.
Table 1. Power-fitting results between noise levels and wind speed
Frequency/Hz WP2013 SCS2016 <20 m/s >20 m/s <20 m/s before after before after before after 400 0.82 0.91 1.88 2.54 1.31 2.84 500 0.91 1.07 1.91 2.67 1.24 2.10 630 1.15 1.60 1.92 2.77 1.53 2.50 800 1.26 1.88 1.87 2.76 1.58 2.60 1 000 1.25 2.02 1.88 2.83 1.60 2.66 1 250 1.30 2.00 1.86 2.85 1.64 2.67 1 600 1.20 2.08 1.87 2.97 1.69 2.78 2 000 1.32 1.88 1.94 3.08 1.73 2.96 2 500 1.31 2.00 1.97 3.25 1.78 3.08 3 150 1.19 2.12 1.89 3.16 1.87 3.09 4 000 1.20 2.20 1.74 3.08 1.90 3.09 5 000 − − − − 1.95 3.12 6 300 − − − − 2.01 3.21 8 000 − − − − 2.04 3.22 Note: − denotes null on account of a limited sample rate.  下载: 导出CSV
Table 2. Power-fitting results between noise levels and local significant wave height
Frequency/Hz WP2013 SCS2016 <8.5 m >8.5 m <8.5 m before after before after before after 400 0.58 2.78 0.82 3.59 1.12 2.95 500 0.65 2.76 0.97 3.66 1.06 3.27 630 0.81 2.86 1.49 3.94 1.36 3.98 800 0.89 2.81 1.75 3.94 1.41 4.17 1 000 0.89 2.82 1.84 4.08 1.44 4.29 1 250 0.92 2.79 1.88 4.12 1.47 4.25 1 600 0.85 2.82 2.08 4.29 1.51 4.45 2 000 0.93 2.93 1.98 4.47 1.56 4.80 2 500 0.93 2.98 2.02 4.73 1.60 5.02 3 150 1.19 2.89 2.12 4.61 1.67 4.99 4 000 1.22 2.67 2.20 4.49 1.71 5.00 5 000 − − − − 1.75 5.12 6 300 − − − − 1.79 5.27 8 000 − − − − 1.83 5.29 Note: − denotes null on account of a limited sample rate.
下载: 导出CSV
Table 3. Fitting results between noise levels and noise level at 1 kHz during typhoon periods
Frequency/Hz WP2013 SCS2016 Slope Intercept Slope Intercept 400 0.62 21.15 0.66 21.13 500 0.68 19.48 0.75 16.63 630 0.87 10.31 0.92 6.07 800 0.95 4.15 0.97 2.39 1 000 1.00 0.00 1.00 0.00 1 250 0.99 1.15 1.00 −1.10 1 600 0.86 6.86 1.04 −4.52 2 000 0.99 −0.58 1.11 −9.56 2 500 0.95 −1.87 1.15 −13.20 3 150 0.84 5.58 1.15 −15.45 4 000 0.86 1.72 1.16 −17.29 5 000 − − 1.19 −20.16 6 300 − − 1.21 −23.63 8 000 − − 1.22 −25.90 Note: − denotes null for frequencies higher than 4 kHz on account of sample rate in WP2013.
下载: 导出CSV
-
[1] Ashokan M, Latha G, Raguraman G. 2018. Ocean ambient noise off Chennai due to very severe cyclonic storm Vardah. Applied Acoustics, 140: 256–262. doi: 10.1016/j.apacoust.2018.06.008 [2] Asolkar P, Das A, Gajre S, et al. 2016. Tropical littoral ambient noise probability density function model based on sea surface temperature. The Journal of the Acoustical Society of America, 140(5): EL452–EL457. doi: 10.1121/1.4967524 [3] Asolkar P, Das A, Gajre S, et al. 2017. Comprehensive correlation of ocean ambient noise with sea surface parameters. Ocean Engineering, 138: 170–178. doi: 10.1016/j.oceaneng.2017.04.033 [4] Brooks L A, Gerstoft P. 2009. Green’s function approximation from cross-correlations of 20–100 Hz noise during a tropical storm. The Journal of the Acoustical Society of America, 125(2): 723–734. doi: 10.1121/1.3056563 [5] Cauchy P, Heywood K J, Merchant N D, et al. 2018. Wind speed measured from underwater gliders using passive acoustics. Journal of Atmospheric and Oceanic Technology, 35(12): 2305–2321. doi: 10.1175/JTECH-D-17-0209.1 [6] Chan H C, Chen Chifang. 2012. Underwater acoustic sensing applied to estimation of typhoon wind speed. International Journal of Remote Sensing, 33(23): 7398–7412. doi: 10.1080/01431161.2012.685984 [7] Chapman N R, Cornish J W. 1993. Wind dependence of deep ocean ambient noise at low frequencies. The Journal of the Acoustical Society of America, 93(2): 782–789. doi: 10.1121/1.405440 [8] D’Asaro E A, Black P G, Centurioni L R, et al. 2014. Impact of typhoons on the ocean in the Pacific. Bulletin of the American Meteorological Society, 95(9): 1405–1418. doi: 10.1175/BAMS-D-12-00104.1 [9] Farmer D M, Lemon D D. 1984. The influence of bubbles on ambient noise in the ocean at high wind speeds. Journal of Physical Oceanography, 14(11): 1762–1778. doi: 10.1175/1520-0485(1984)014<1762:TIOBOA>2.0.CO;2 [10] Farrell D M, Dall’Osto D R, Dahl P H. 2017. The background noise environment during the 2013 target and REverberation eXperiment. IEEE Journal of Oceanic Engineering, 42(4): 1088–1093. doi: 10.1109/JOE.2017.2721158 [11] Farrokhrooz M, Wage K E, Dzieciuch M A, et al. 2017. Vertical line array measurements of ambient noise in the North Pacific. The Journal of the Acoustical Society of America, 141(3): 1571–1581. doi: 10.1121/1.4976706 [12] Galindo-Romero M, Gavrilov A, Duncan A J. 2017. Fluctuations of the peak pressure level of man-made impulsive sound signals propagating in the ocean. The Journal of the Acoustical Society of America, 141(2): 661–668. doi: 10.1121/1.4974878 [13] Gaul R D, Knobles D P, Shooter J A, et al. 2007. Ambient noise analysis of deep-ocean measurements in the Northeast Pacific. IEEE Journal of Oceanic Engineering, 32(2): 497–512. doi: 10.1109/JOE.2007.891885 [14] Gerstoft P, Bromirski P D. 2016. “Weather bomb” induced seismic signals. Science, 353(6302): 869–870. doi: 10.1126/science.aag1616 [15] Jullien S, Marchesiello P, Menkes C E, et al. 2014. Ocean feedback to tropical cyclones: climatology and processes. Climate Dynamics, 43(9−10): 2831–2854. doi: 10.1007/s00382-014-2096-6 [16] Li Fenghua, Xu Dong, Wang Jingyan, et al. 2018. Observations of wind-generated noise by the tropical cyclone. The Journal of the Acoustical Society of America, 143(6): 3312–3324. doi: 10.1121/1.5039838 [17] Lin Jianmin, Lin Jian, Xu Min. 2017. Microseisms generated by super typhoon megi in the western Pacific Ocean. Journal of Geophysical Research, 122(12): 9518–9529. doi: 10.1002/2017JC013310 [18] Ma B B, Nystuen J A, Lien R C. 2005. Prediction of underwater sound levels from rain and wind. The Journal of the Acoustical Society of America, 117(6): 3555–3565. doi: 10.1121/1.1910283 [19] Ma B, Yang Y J. 2009. Detection and classification of typhoons using underwater acoustic sensors in the western Pacific Ocean. The Journal of the Acoustical Society of America, 125(4): 2619 [20] Marrett R, Chapman N R. 1990. Low-frequency ambient-noise measurements in the South Fiji Basin. IEEE Journal of Oceanic Engineering, 15(4): 311–315. doi: 10.1109/48.103526 [21] Newcomb J J, Wright A J, Kuczaj S, et al. 2004. Underwater ambient noise and sperm whale click detection during extreme wind speed conditions. AIP Conference Proceedings, 728(1): 296–303 [22] Nichols S M, Bradley D L. 2019. Use of noise correlation matrices to interpret ocean ambient noise. The Journal of the Acoustical Society of America, 145(4): 2337–2349. doi: 10.1121/1.5096846 [23] Porter M B. 2011. The BELLHOP manual and user’s guide: preliminary draft. La Jolla: Heat, Light, and Sound Research, Inc. [24] Pun I F, Chang Y T, Lin I I, et al. 2011. Typhoon-ocean interaction in the western North Pacific: part 2. Oceanography, 24(4): 32–41. doi: 10.5670/oceanog.2011.92 [25] Reeder D B, Sheffield E S, Mach S M. 2011. Wind-generated ambient noise in a topographically isolated basin: a pre-industrial era proxy. The Journal of the Acoustical Society of America, 129(1): 64–73. doi: 10.1121/1.3514379 [26] Sanjana M C, Latha G, Thirunavukkarasu A. 2014. Ambient noise during rough weather and cyclones in the shallow Bay of Bengal. Chinese Journal of Oceanology and Limnology, 32(4): 921–932. doi: 10.1007/s00343-014-2238-2 [27] Širović A, Wiggins S M, Oleson E M. 2013. Ocean noise in the tropical and subtropical Pacific Ocean. The Journal of the Acoustical Society of America, 134(4): 2681–2689. doi: 10.1121/1.4820884 [28] Song Guoli, Guo Xinyi, Ma Li. 2019. α stable distribution model in ocean ambient noise. Acta Acustica, 44(2): 177–188 [29] Wang Jingyan, Li Fenghua. 2015. Preliminary study on underwater ambient noise generated by typhoons. Chinese Physics Letters, 32(4): 044301. doi: 10.1088/0256-307X/32/4/044301 [30] Wen Hongtao, Yang Yanming, Wang Ning, et al. 2016. Effects of typhoon “KAI-TAK” on deep ocean ambient noise in the South China Sea. Acta Acustica, 41(6): 804–812 [31] Wilson J D, Makris N C. 2006. Ocean acoustic hurricane classification. The Journal of the Acoustical Society of America, 119(1): 168–181. doi: 10.1121/1.2130961 [32] Wilson J D, Makris N C. 2008. Quantifying hurricane destructive power, wind speed, and air-sea material exchange with natural undersea sound. Geophysical Research Letters, 35(10): L10603 [33] Xu Delun, Wang Liping. 2011. Analysis of Ocean Random Data: Principles, Methods and Applications (in Chinese). Beijing: Higher Education Press [34] Yang Qiulong, Yang Kunde, Cao Ran, et al. 2018a. Spatial vertical directionality and correlation of low-frequency ambient noise in deep ocean direct-arrival zones. Sensors, 18(2): 319. doi: 10.3390/s18020319 [35] Yang Qiulong, Yang Kunde, Duan Shunli. 2018b. A method for noise source levels inversion with underwater ambient noise generated by typhoon in Deep Ocean. Journal of Theoretical and Computational Acoustics, 26(2): 1850007. doi: 10.1142/S259172851850007X [36] Yang Ming, Zhang Wei, Yu Hui, et al. 2014. An overview of the China Meteorological Administration tropical cyclone database. Journal of Atmospheric and Oceanic Technology, 31(2): 287–301. doi: 10.1175/JTECH-D-12-00119.1 [37] Zhao Zhongxiang, D’Asaro E A, Nystuen J A. 2014. The sound of tropical cyclones. Journal of Physical Oceanography, 44(10): 2763–2778. doi: 10.1175/JPO-D-14-0040.1 -


 点击查看大图

计量
- 文章访问数: 785
- HTML全文浏览量: 246
- PDF下载量: 31
- 被引次数: 0

