

Characteristics of water masses and bio-optical properties of the Bering Sea shelf during 2007–2009
-
Abstract: The hydrographic and bio-optical properties of the Bering Sea shelf were analyzed based on in-situ measurements obtained during four cruises from 2007 to 2009. According to the temperature and salinity of the seawater, the spring water masses on the Bering Sea shelf were classified as the Alaskan Coast Water, Bering Sea Shelf Water, Anadyr Water, Spring Mixed Layer Water, Remnant Winter Water, and Winter Water, each of which had varying chlorophyll a concentrations. Among them, the highest chlorophyll a concentration occurred in the nutrient-rich Anadyr Water ((7.57±6.16) mg/m3 in spring). The spectrum-dependent diffuse attenuation coefficient (Kd(λ)) of the water column for downwelling irradiance was also calculated, exhibiting a decrease at 412–555 nm and then an increase within the range of 0.17–0.48 m–1 in spring. Furthermore, a strong correlation between the chlorophyll a concentration and the attenuation coefficient was found at visible wavelengths on the Bering Sea shelf. Spatially, the chlorophyll a concentration was higher on the northern shelf ((5.18±3.78) mg/m3) than on the southern shelf ((3.64±2.51) mg/m3), which was consistent with the distribution of the attenuation coefficient. Seasonally, the consumption of nutrients by blooms resulted in minimum chlorophyll a concentration ((0.78±0.51) mg/m3) and attenuation coefficient values in summer. In terms of the vertical structure, both the attenuation coefficient and the chlorophyll a concentration tended to reach maximum values at the same depth, and the depth of the maximum values increased as the surface temperature increased in summer. Moreover, an empirical model was fitted with a power function based on the correlation between the chlorophyll a concentration and the attenuation coefficient at 412–555 nm. In addition, a spectral model was constructed according to the relationship between the attenuation coefficients at 490 nm and at other wavelengths, which provides a method for estimating the bio-optical properties of the Bering Sea shelf.
-
Key words:
- diffuse attenuation coefficient /
- water mass /
- Bering Sea shelf /
- chlorophyll a /
- empirical model
-
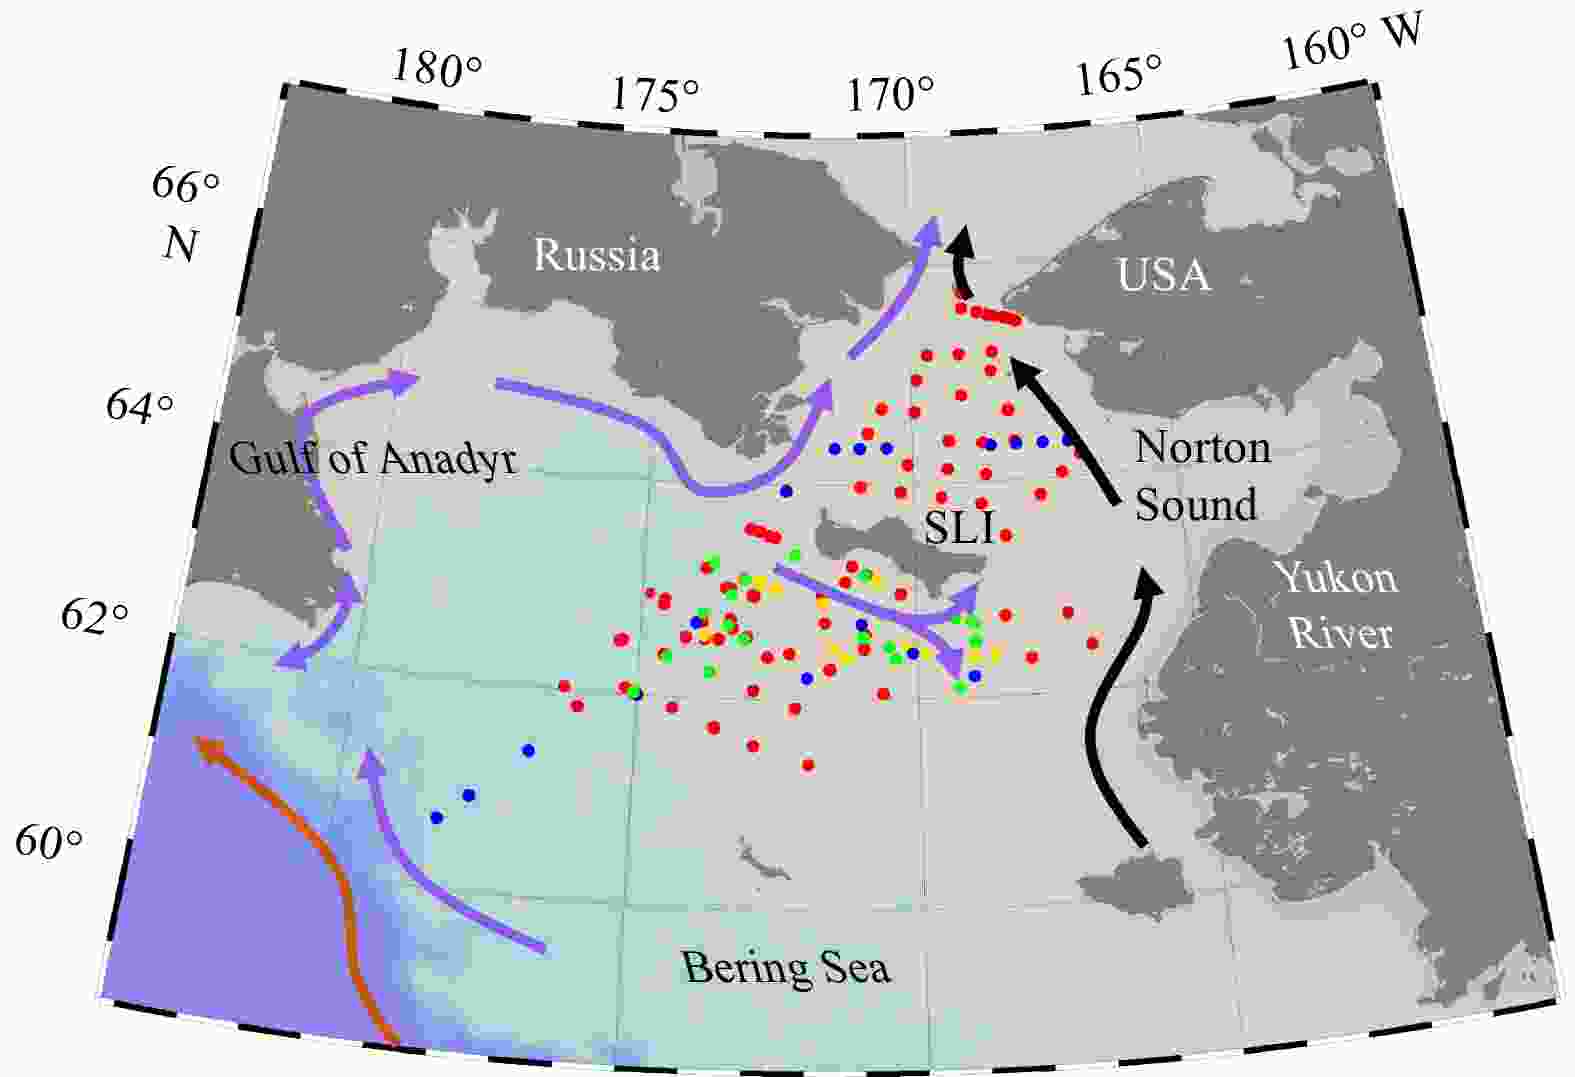
Figure 1. Map showing the stations and typical flow pathways on the Bering Sea shelf. The red, yellow, green, and blue points show the stations during the Healy-0702, Healy-0801, Healy-0901, and CHINARE-0803 cruises, respectively. The mean flow pathways are color coded: brown denotes the Bering Slope Current; black denotes the Alaskan Coastal Current; and purple denotes the pathways of the Bering Sea shelf and Anadyr waters. SLI: St.Lawrence Island.

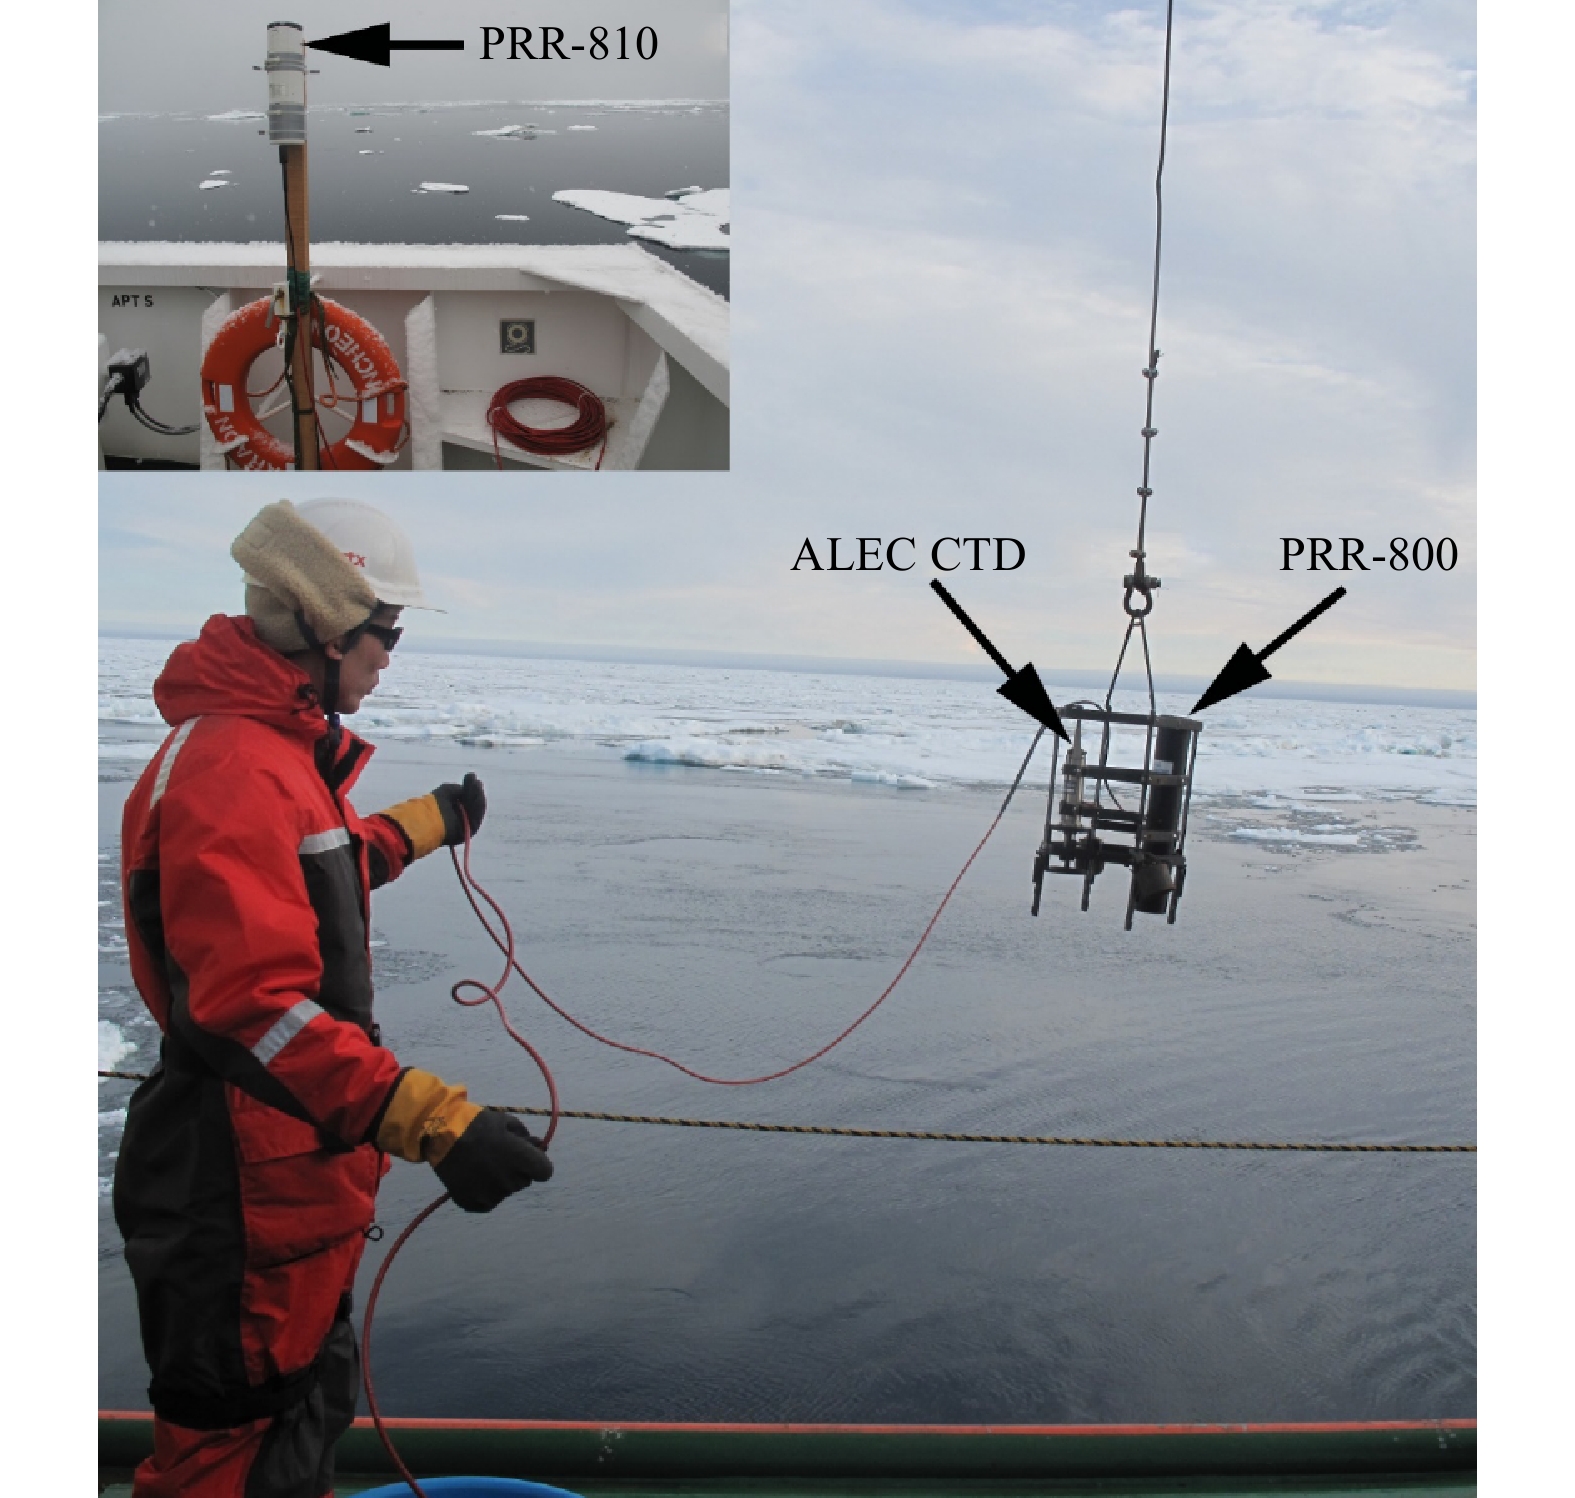
Figure 2. In situ instrument on the site. The PRR-800 and ALEC CTD were fixed on the black bracket, while the PRR-810 was placed on the solar oriented deck.

Figure 4. Distributions of the temperature (a, c) and salinity (b, d) along Transects A1 and A2 in spring, respectively. The transects are shown in the lower left corner.
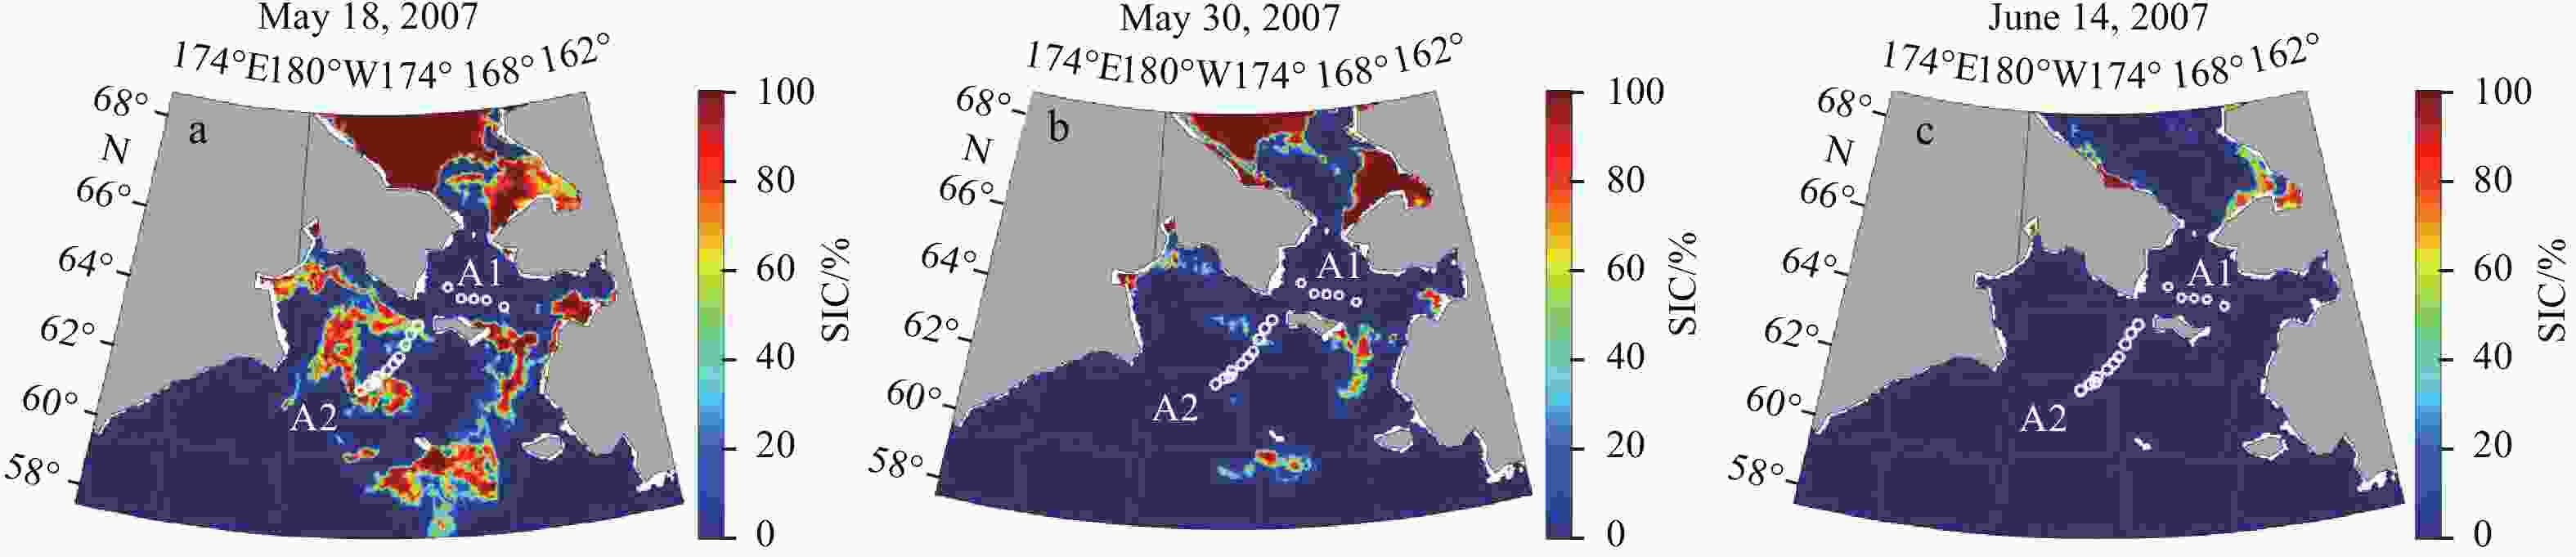
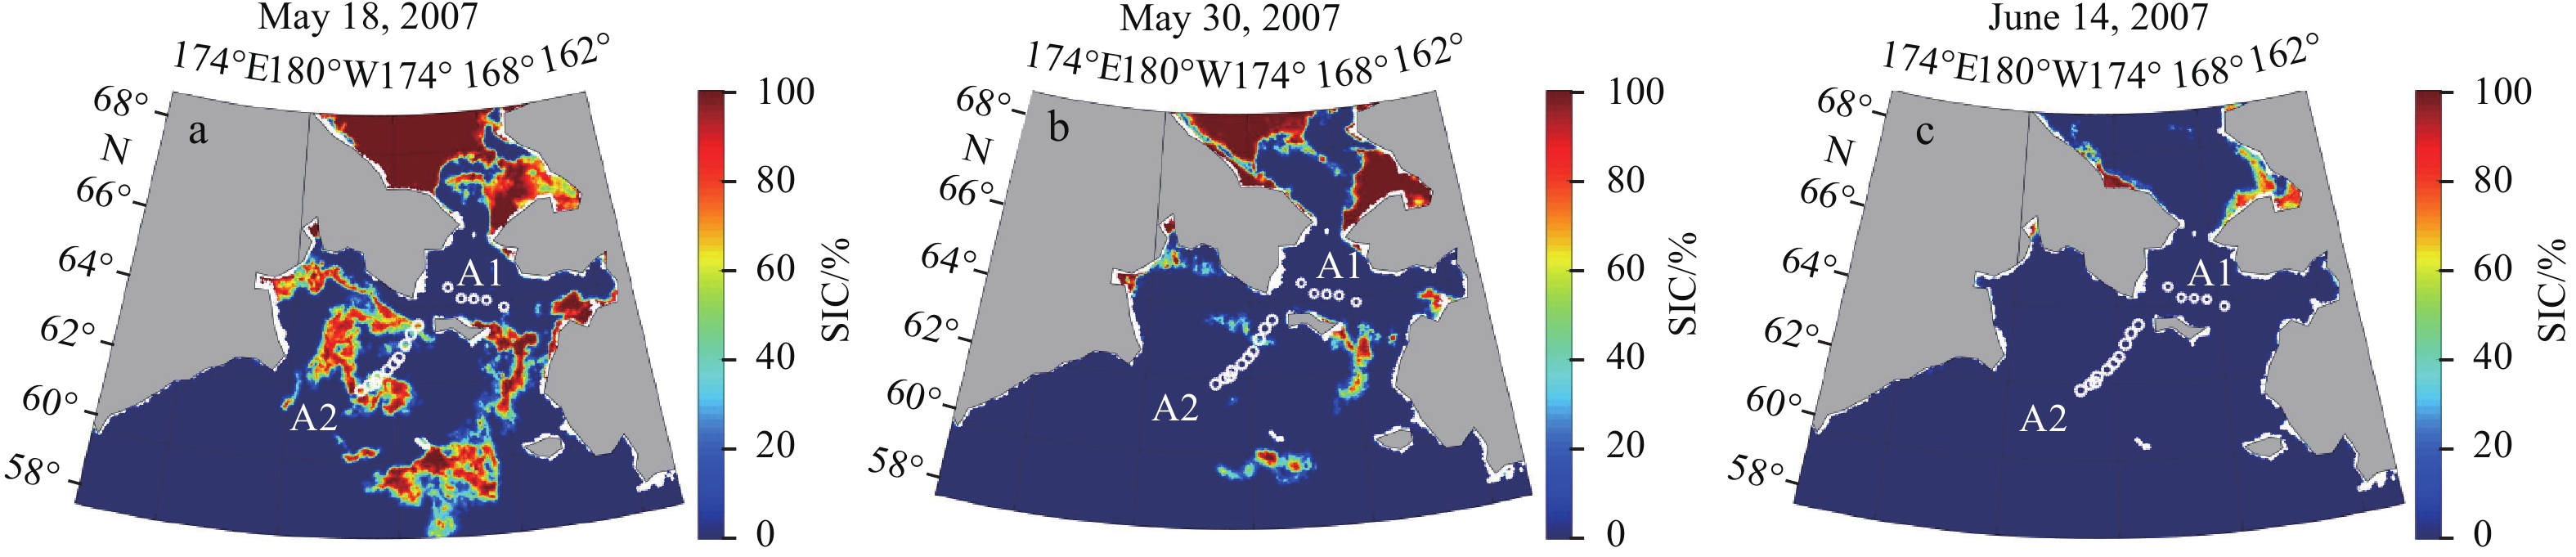
Figure 5. SIC patterns during the observation period of Cruise Healy-0702. The white circles are the stations composing Transects A1 and A2.

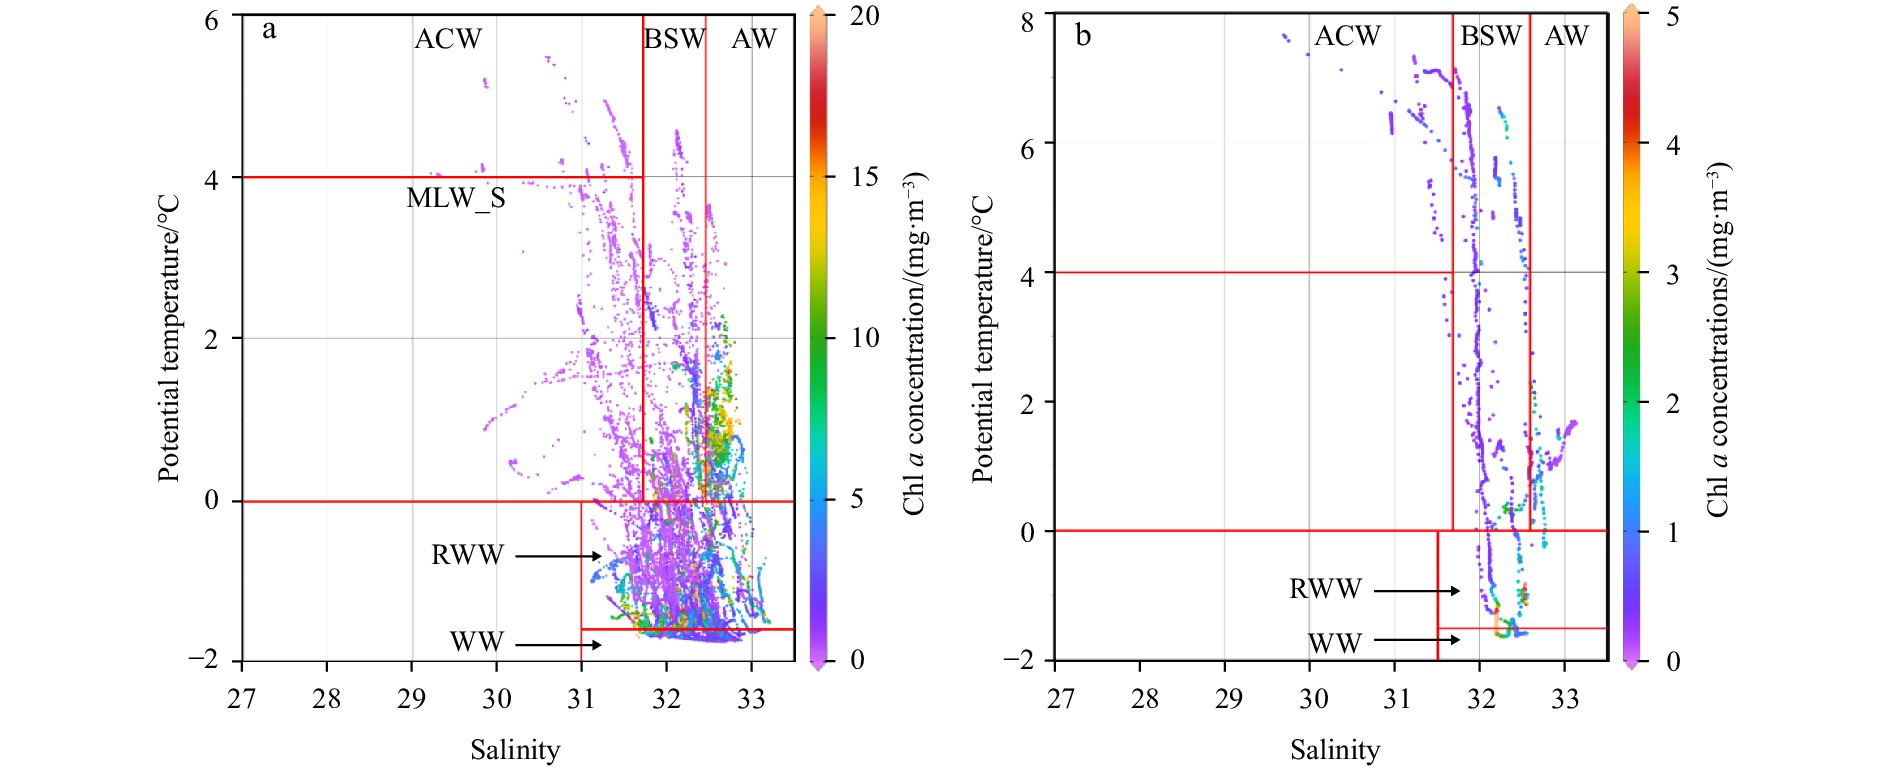
Figure 6. Temperature-salinity-chlorophyll a concentration plots for spring (a) and summer (b).

Figure 7. Typical profiles of the chlorophyll a concentration in an ice-covered area (a), open water (b), and the shallow water (c) in northern Bering Sea shelf. The dashed lines are the relevant boundaries of the pycnocline. The SIC is labeled on the graphs.
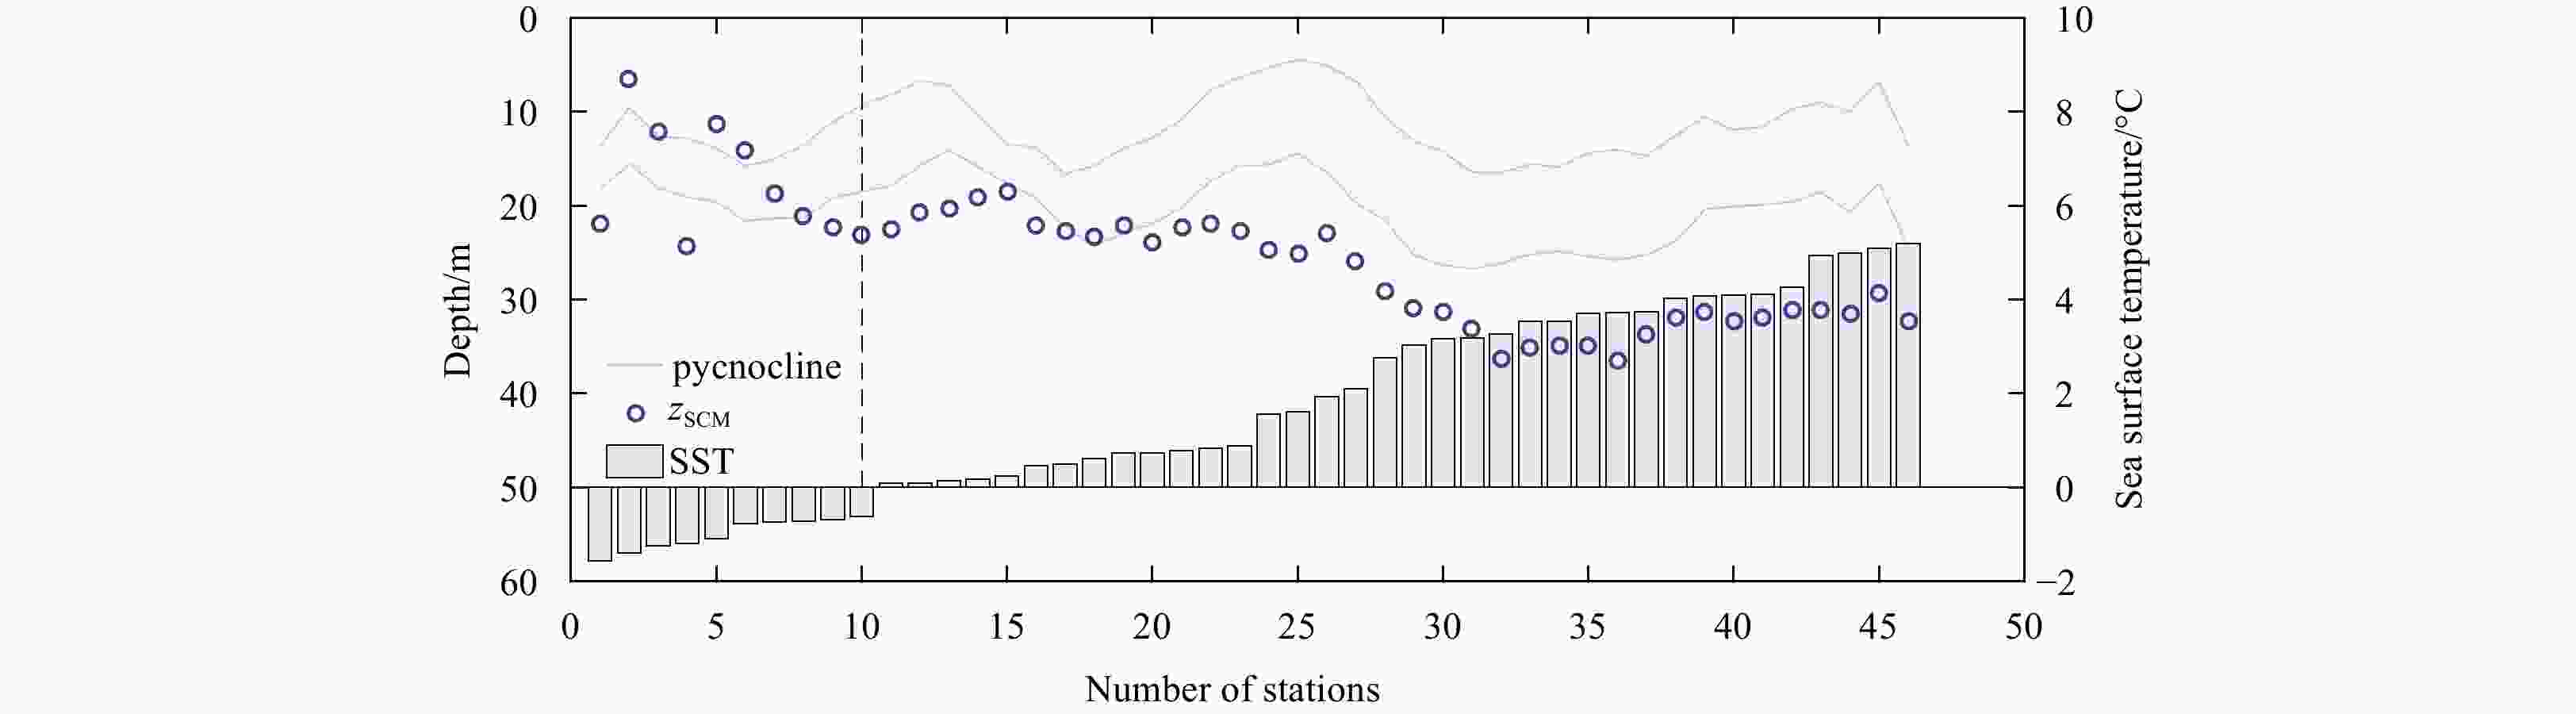
Figure 8. Variations in the
$ {z}_{\mathrm{S}\mathrm{C}\mathrm{M}} $ with SST and pycnocline. The gray shaded area is the pycnocline, and the circles represent the$ {z}_{\mathrm{S}\mathrm{C}\mathrm{M}} $ , and the background histogram indicates the SST.
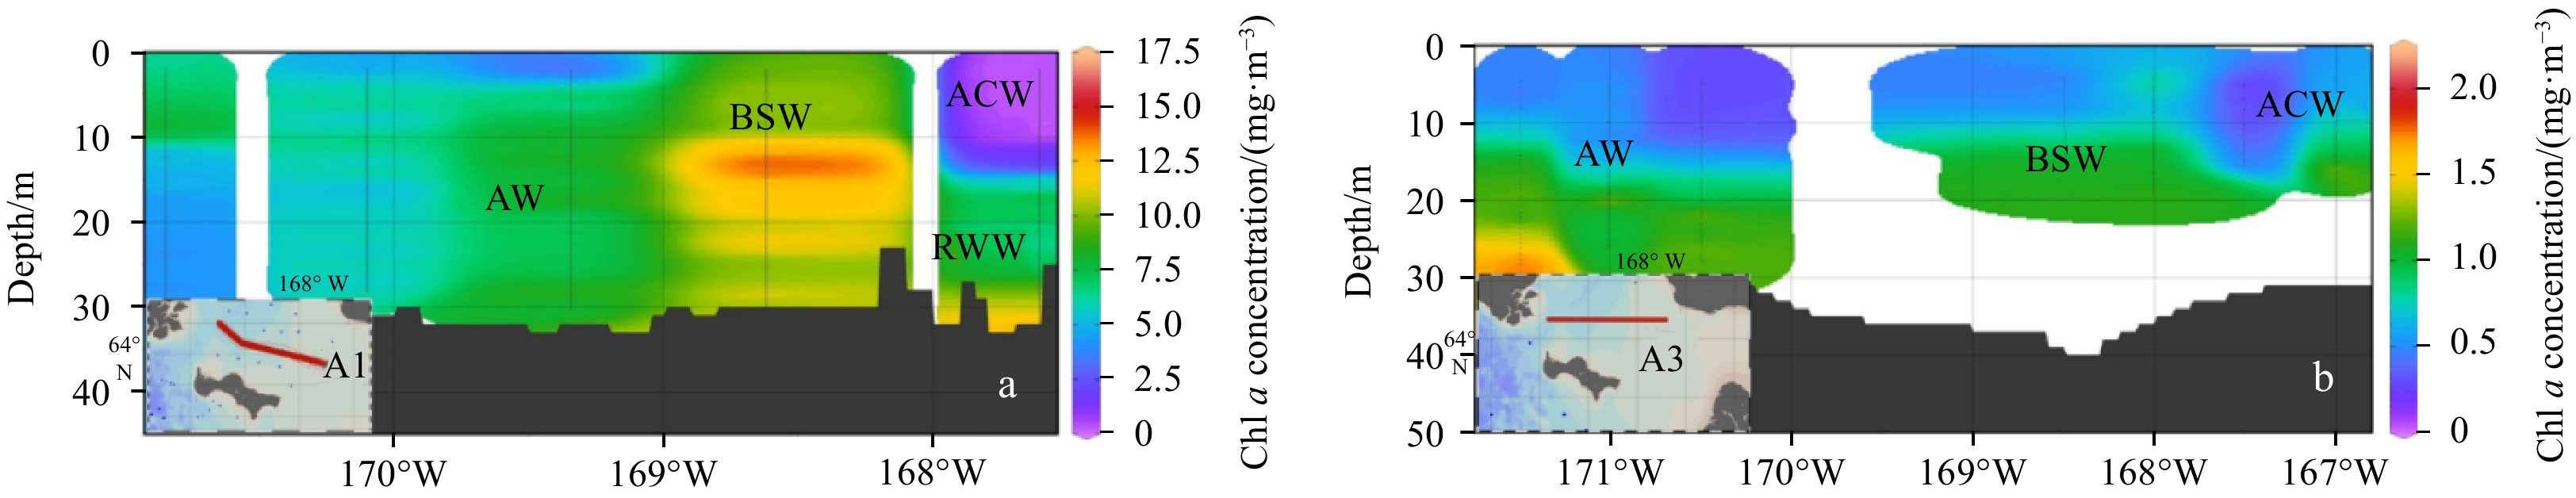
Figure 9. Distributions of chlorophyll a concentration in spring (a) and summer (b) along Transects A1 and A3. The transects are shown in the lower left corner.
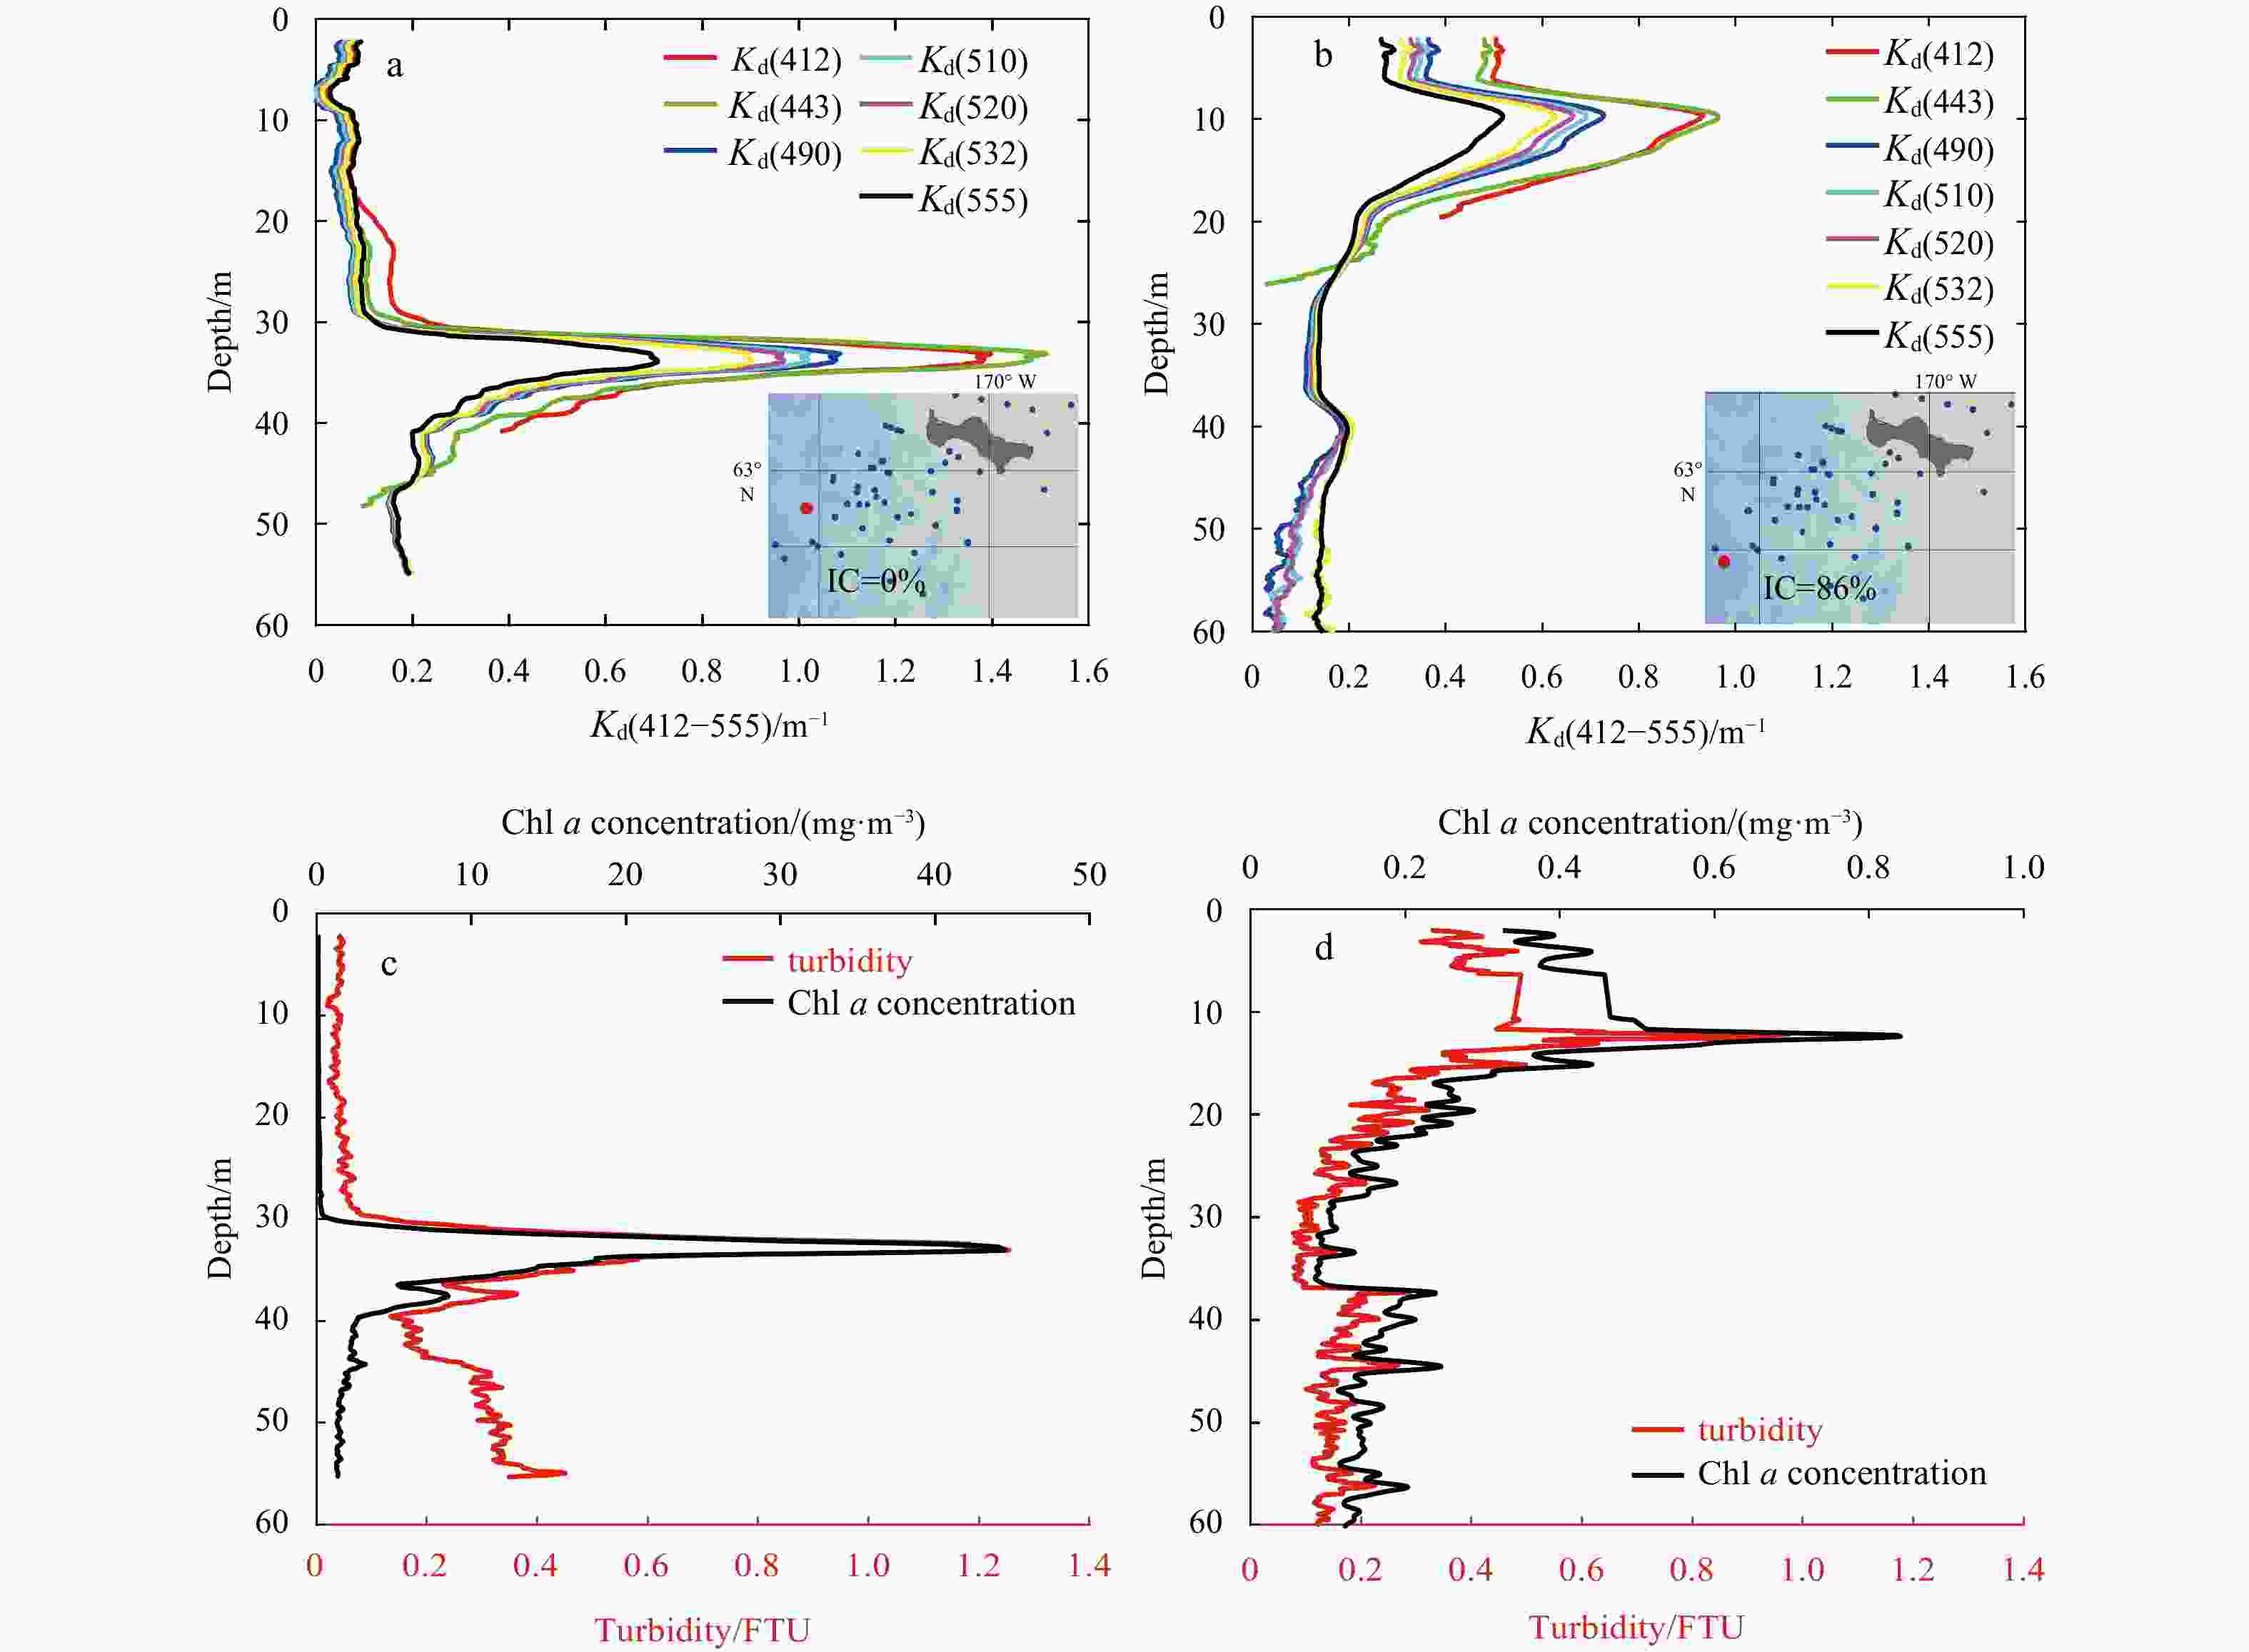
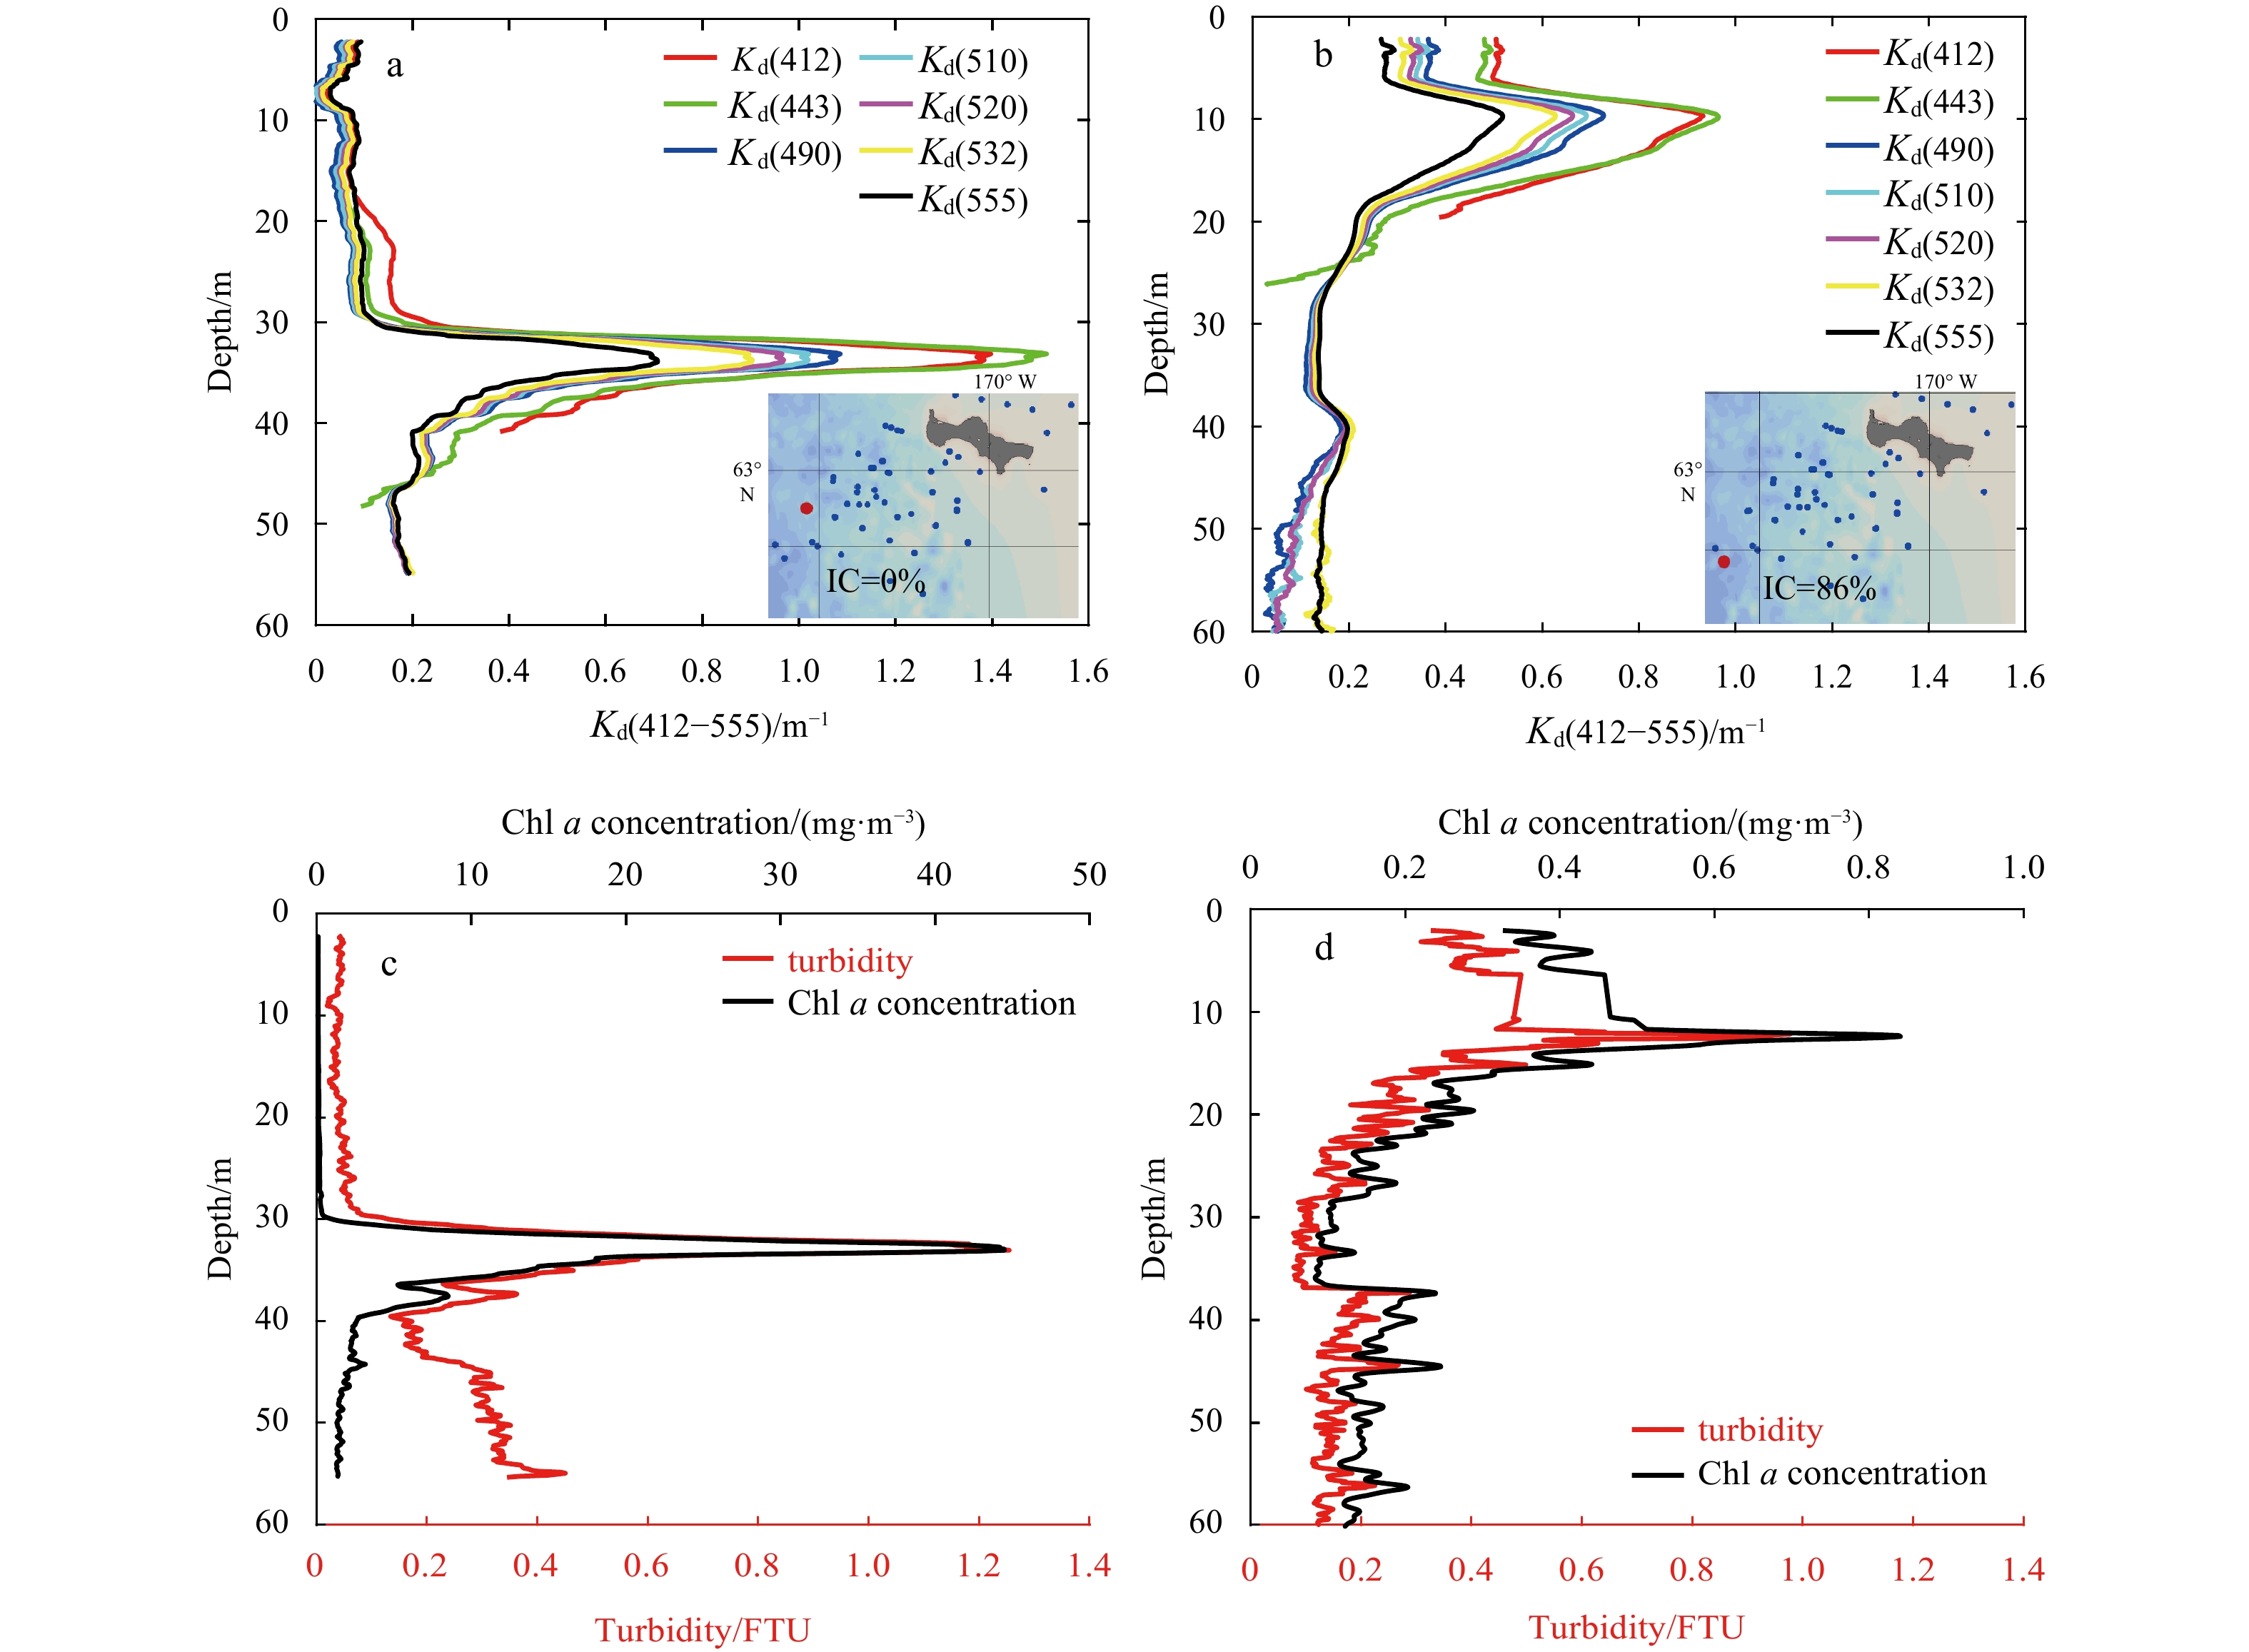
Figure 10. Typical spring profiles of the
${{ K}}_{\mathrm{d}}(z,\lambda )$ at 412–555 nm in the open water (a) and ice covered (b) areas; chlorophyll a concentration and turbidity in the open water (c) and ice covered (d) areas in the southern Bering Sea shelf. The SIC and the stations (red dots) are shown in the lower right corner of a and b.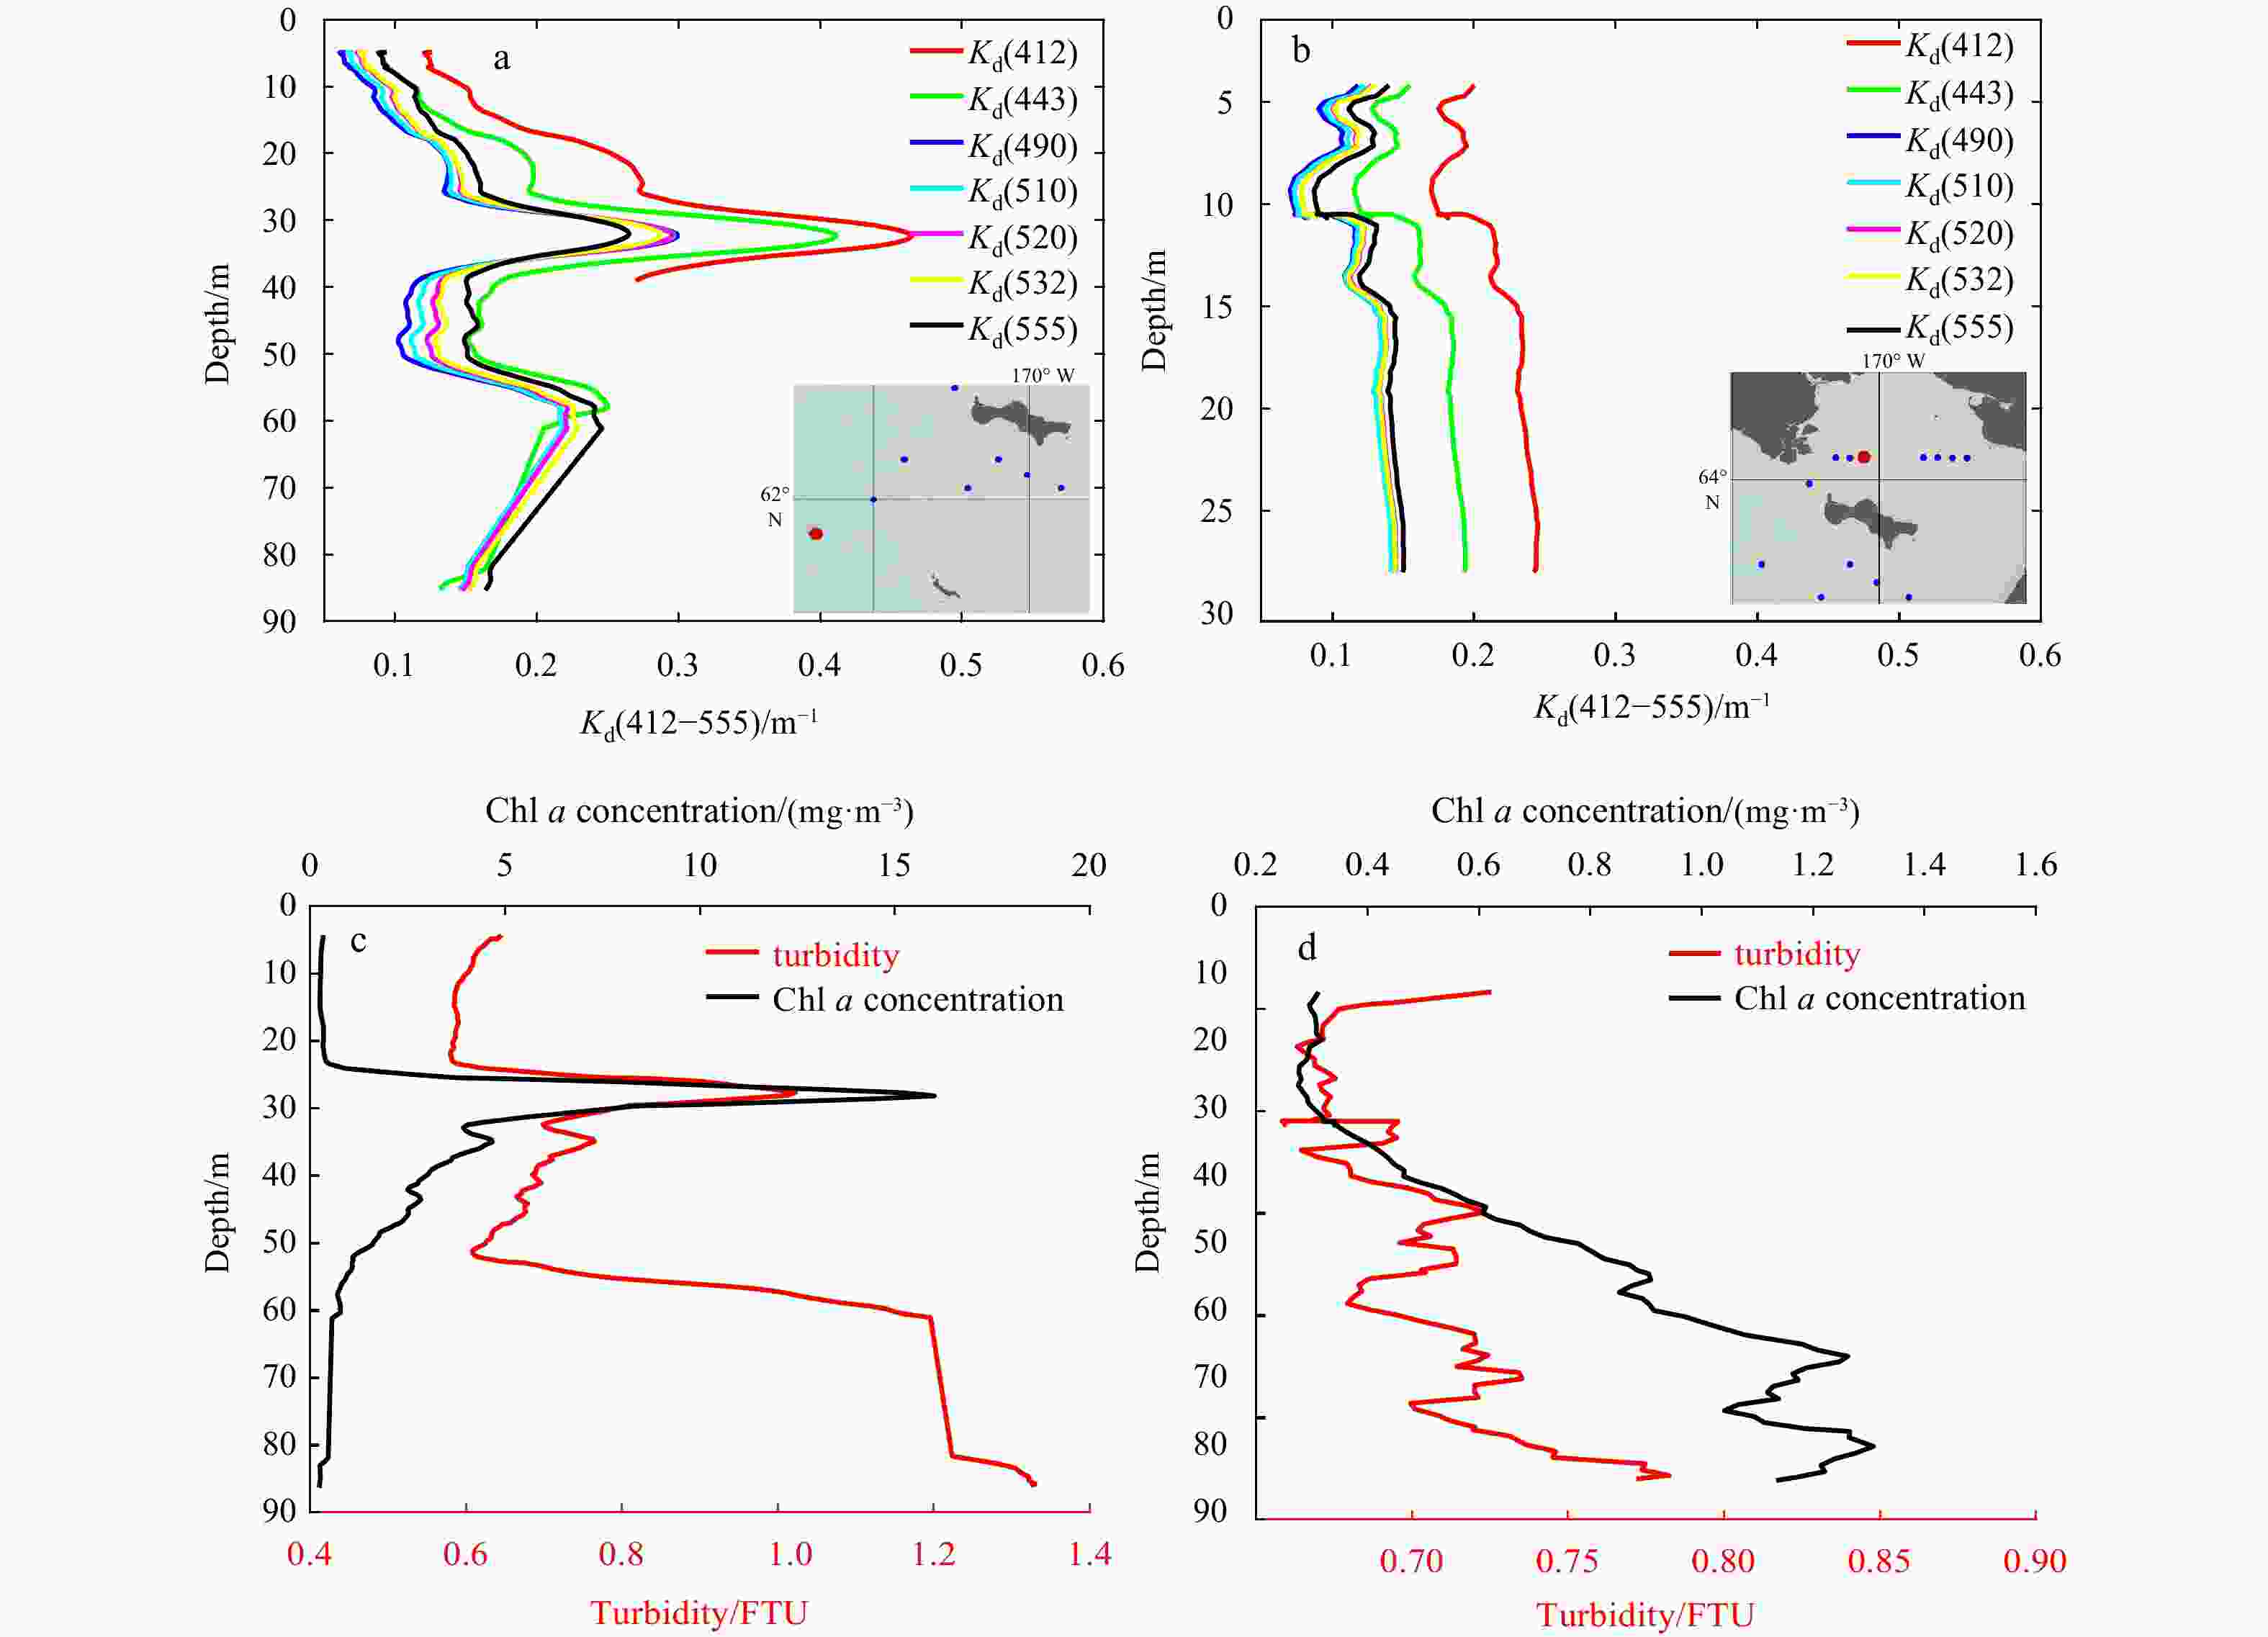
Figure 11. Typical summer profiles of the
$ {{ K}}_{\mathrm{d}}\left(z,{\text{λ}} \right) $ at 412–555 nm on the northern (a) and southern (b) shelves; and the chlorophyll a and turbidity on the northern (c) and southern (d) shelves. The stations (red dots) is shown in the lower right corner of a and b.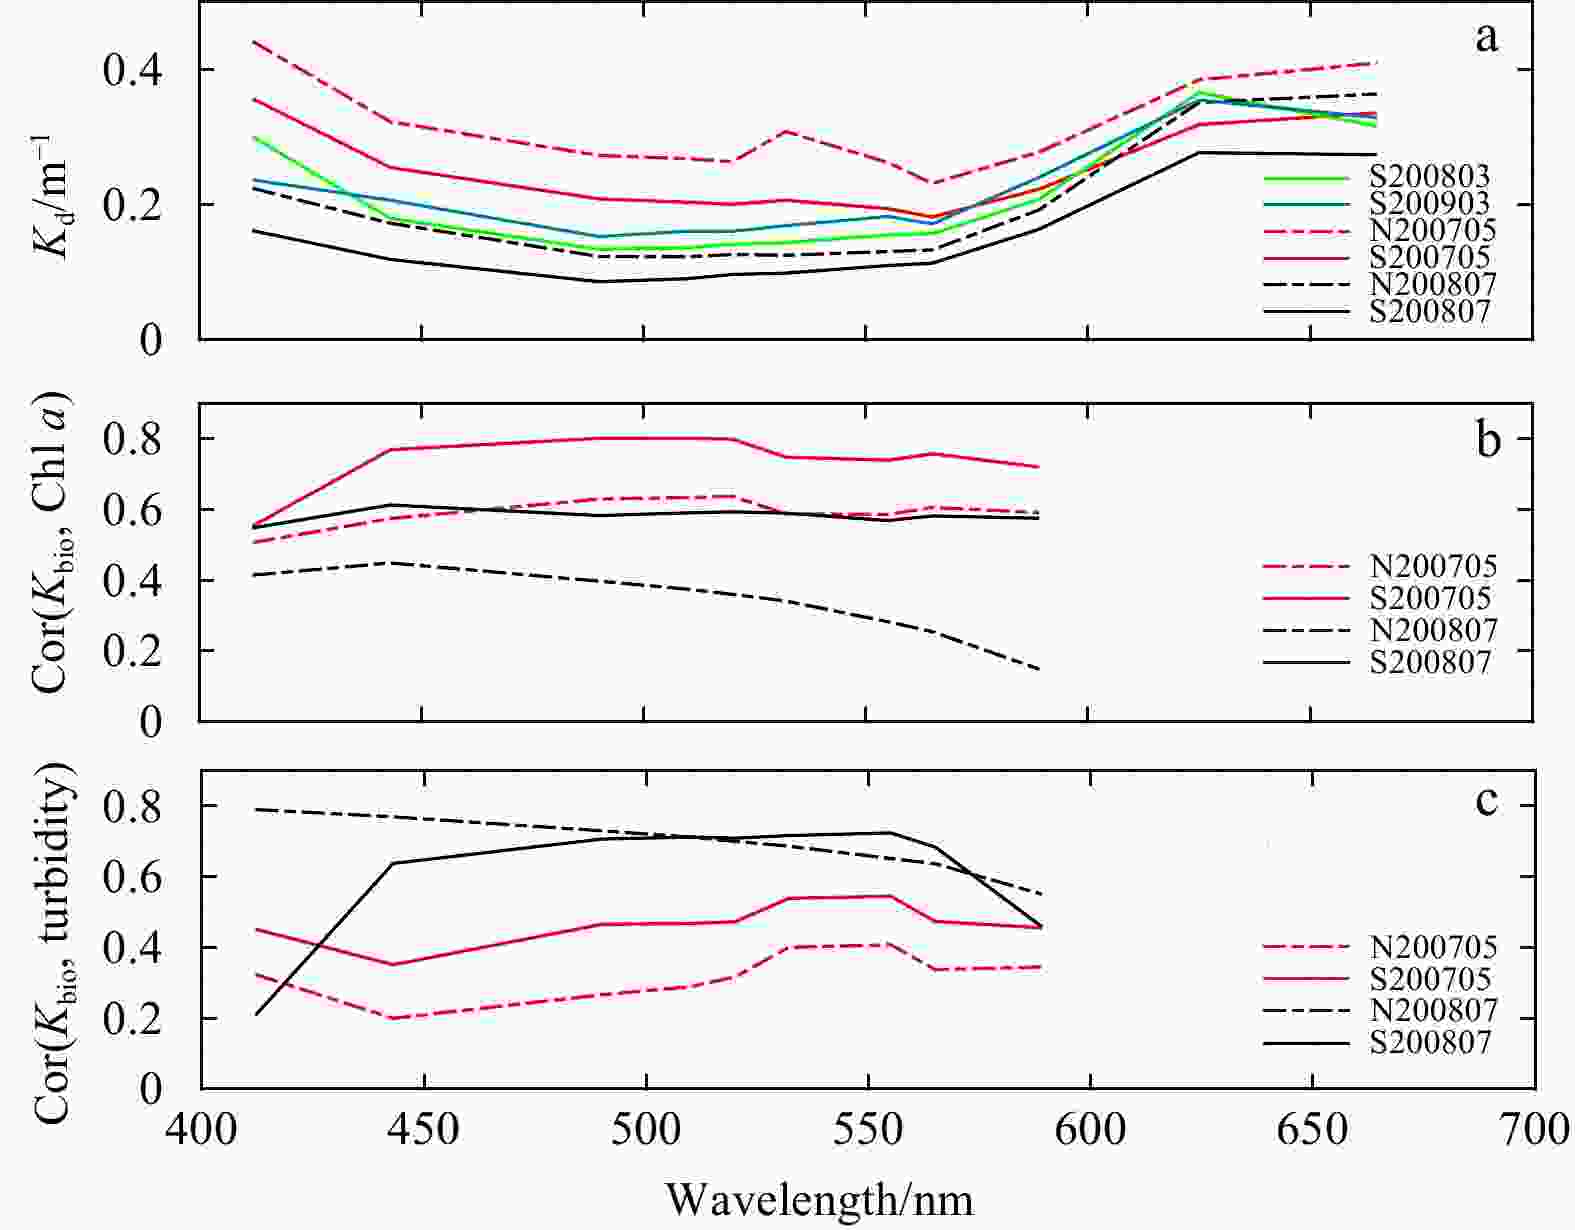
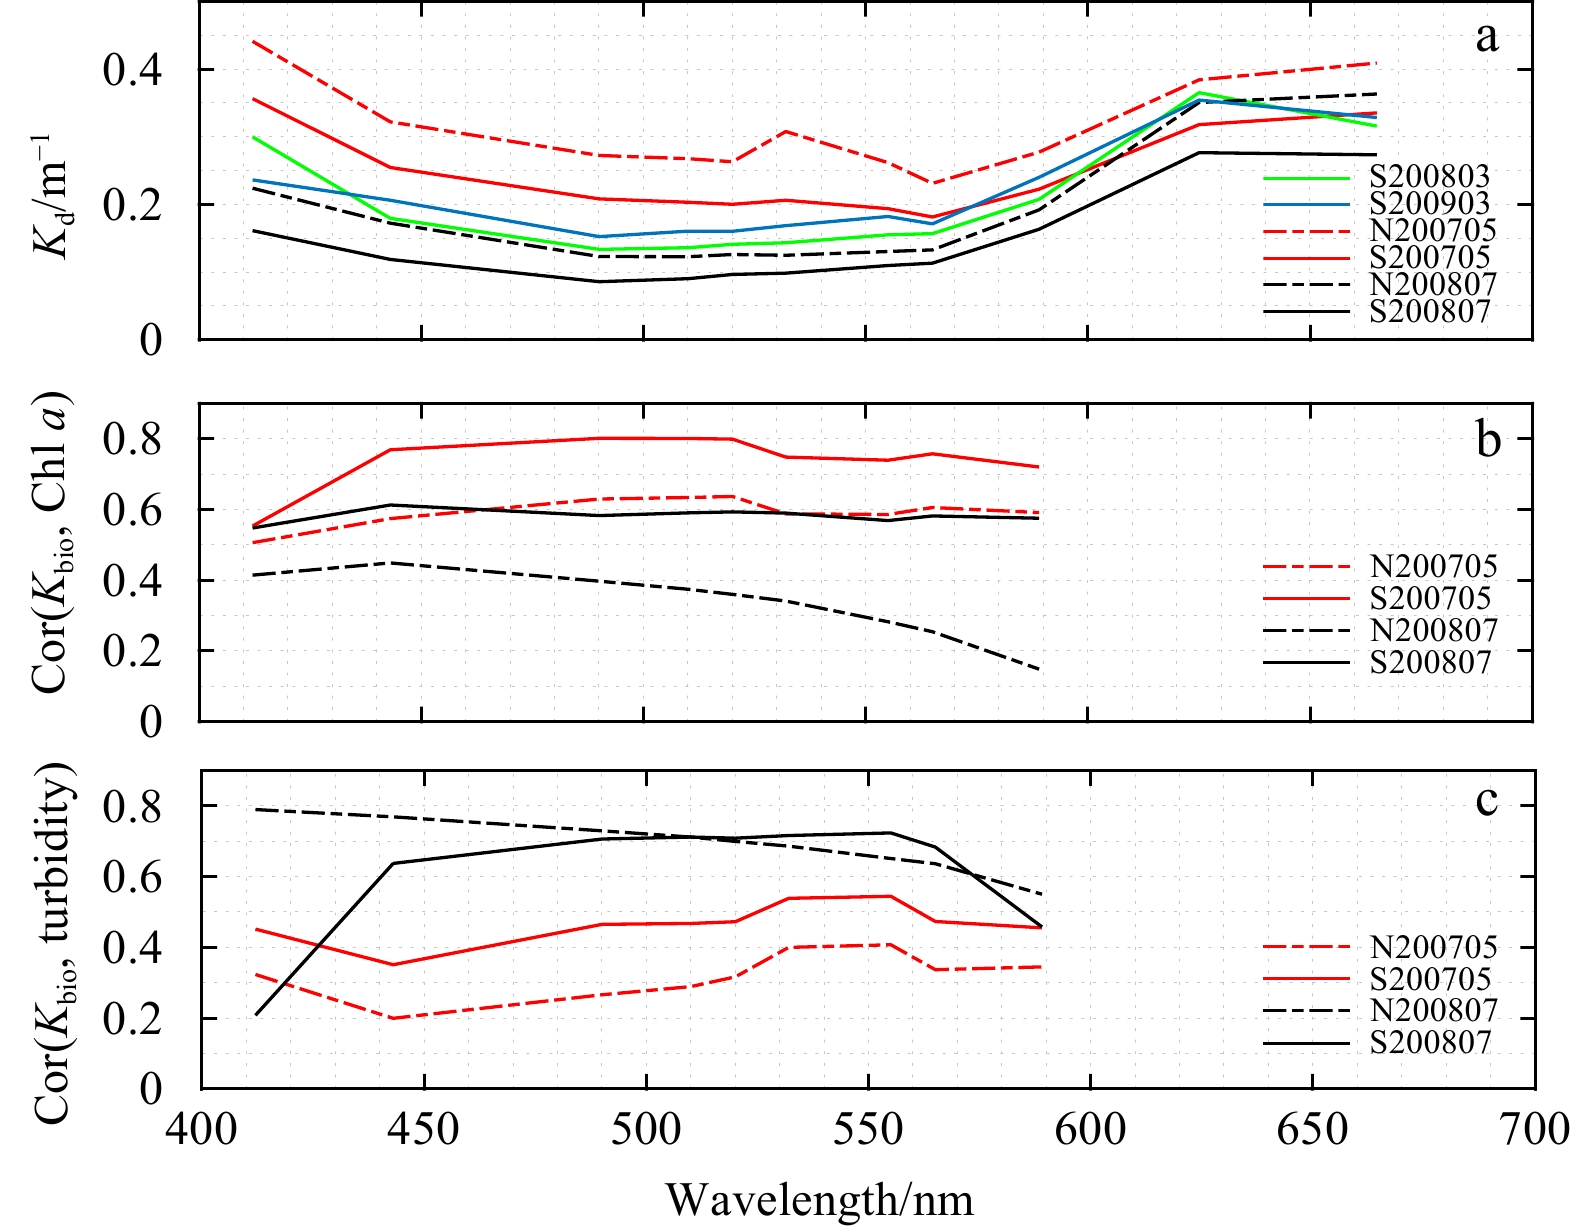
Figure 12. Spectrum dependence of the
$ {{ K}}_{\mathrm{d}}\left(z,{\text{λ}} \right) $ , and the correlation coefficients between the$ {{ K}}_{\mathrm{b}\mathrm{i}\mathrm{o}}\left({\text{λ}} \right) $ (a) and the chlorophyll a concentration (b) and the turbidity (c) at 412–683 nm. The solid and dashed curves are for the southern and northern shelves, respectively. The color of the curves represents the sampling season: red indicates spring 2007; green indicates winter 2008; black indicates summer 2008; and blue indicates winter 2009.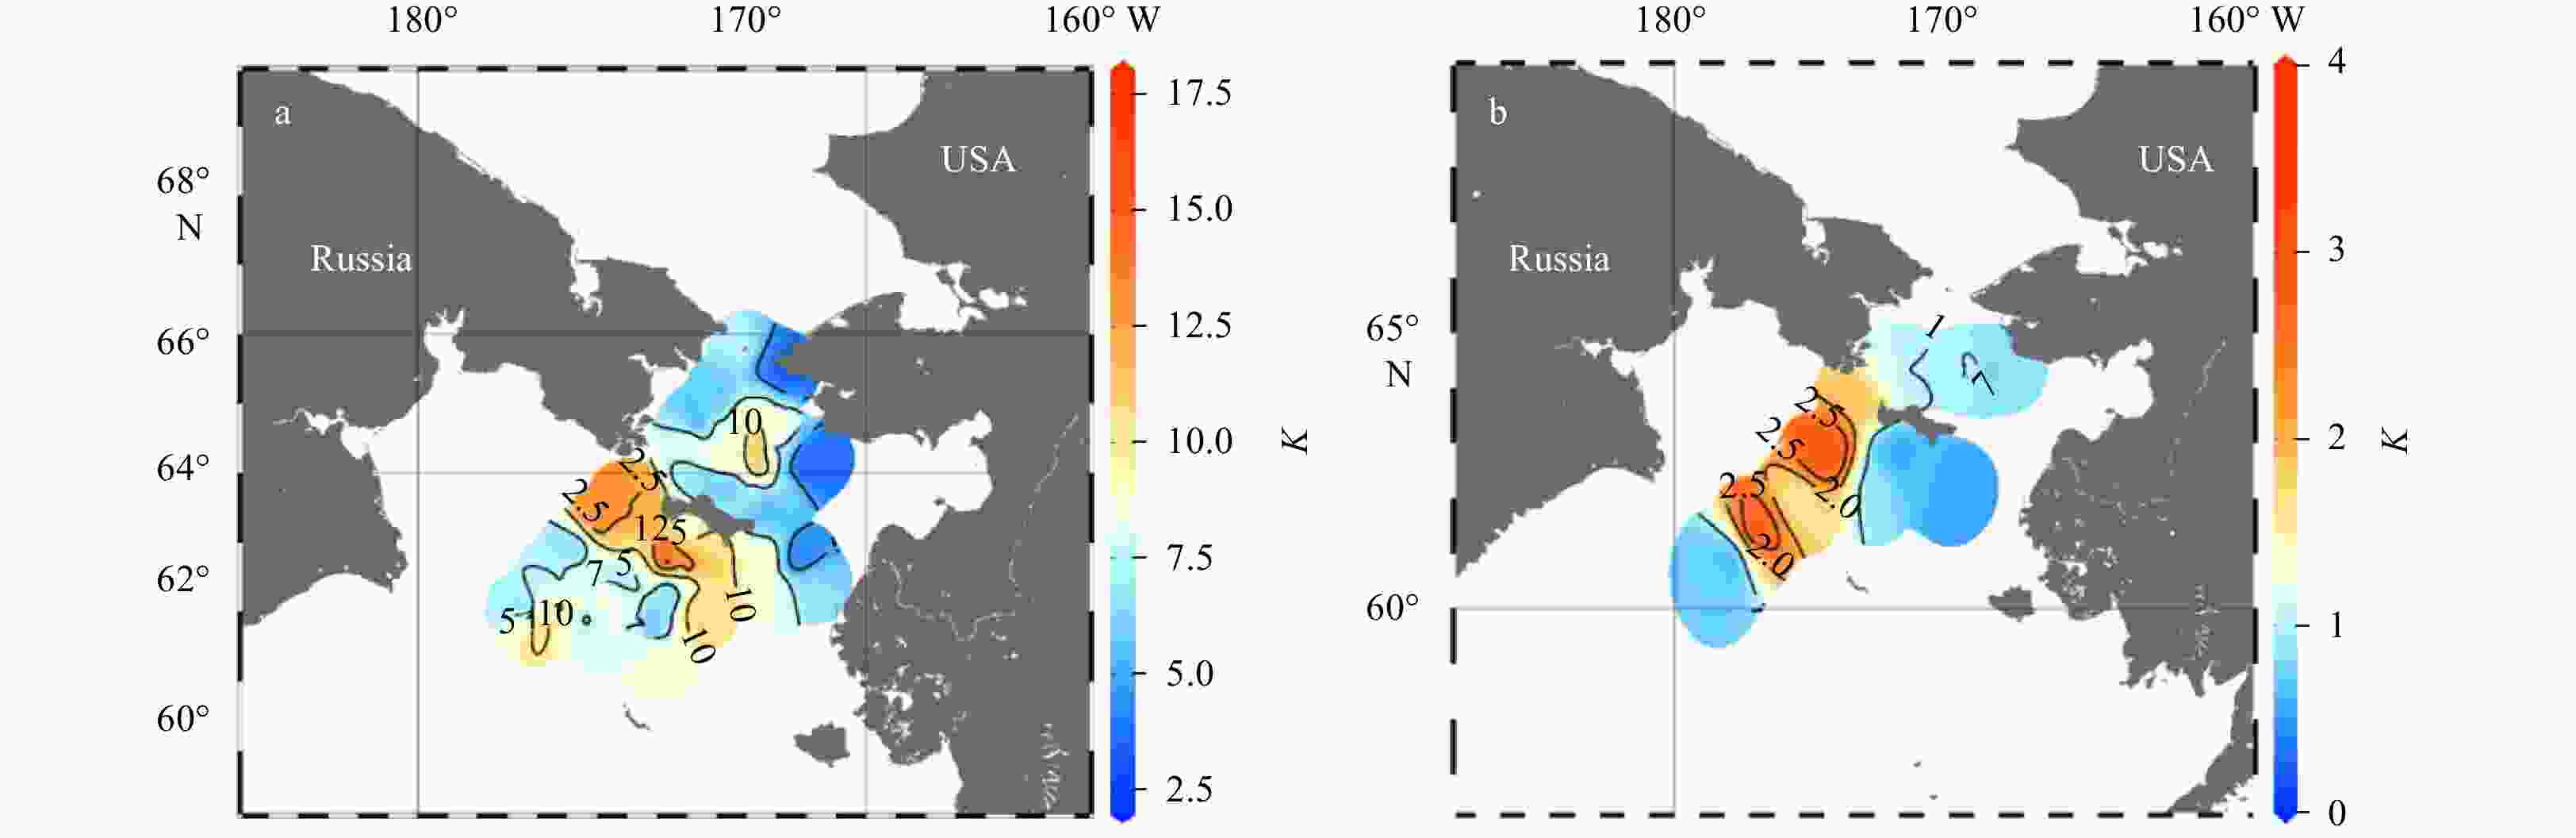
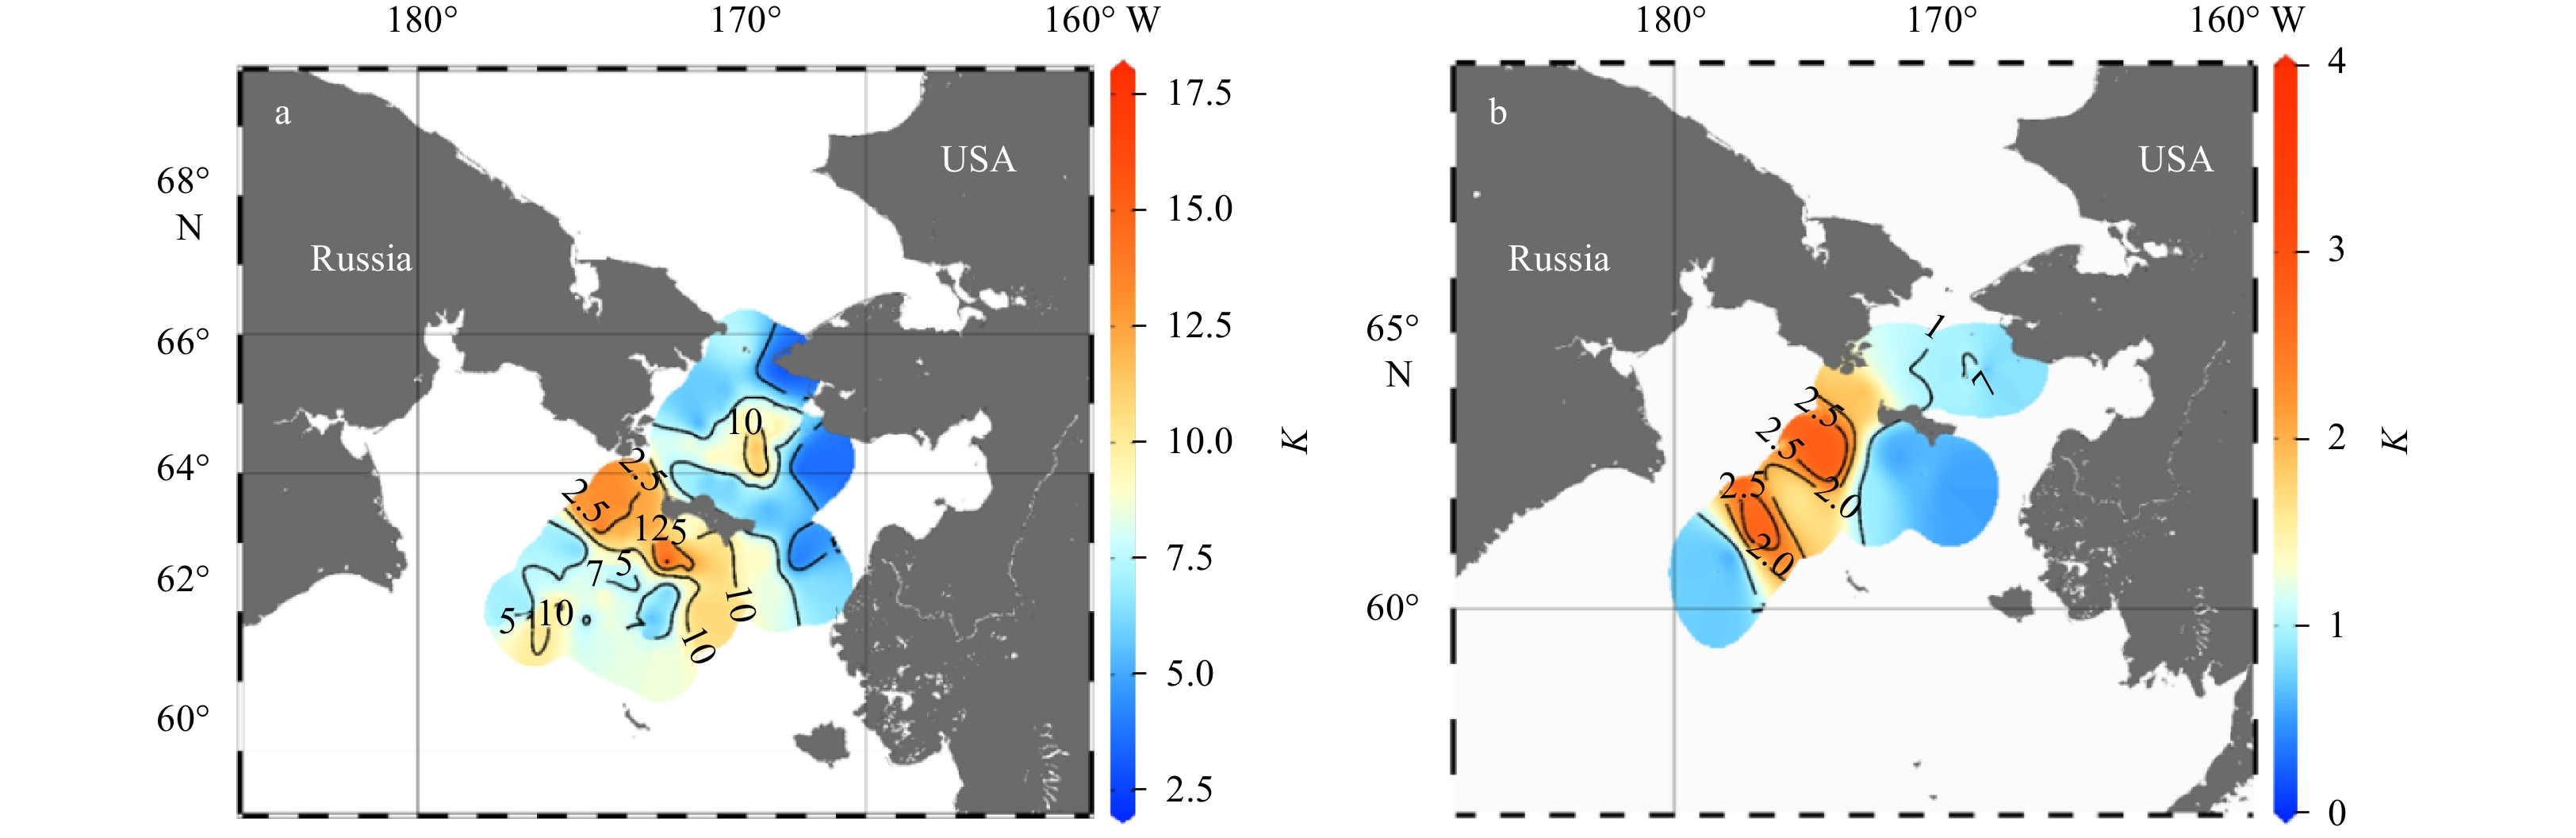
Figure 13. Spatial distributions of the K value on the Bering Sea shelf in spring 2007 (a) and summer 2008 (b).

Figure 14. Spatial distributions of the mean
${{ K}}_{\mathrm{d}}(490)$ on the Bering Sea shelf in spring 2007 (a), winter 2008 (b), summer 2008 (c), and winter 2009 (d).
Figure 15. The relationships between the chlorophyll a concentration and
${{ K}}_{\mathrm{d}}({\text{λ}} )$ at 412 nm, 443 nm, 490 nm, 510 nm, 532 nm, and 555 nm, respectively. The lines are the fitted power functions, where red and black lines are the fitting results of this study in spring and summer, respectively, and blue lines are the results of Morel and Maritorena (2001). The light red and gray circles indicate the chlorophyll a concentration in spring and summer, respectively.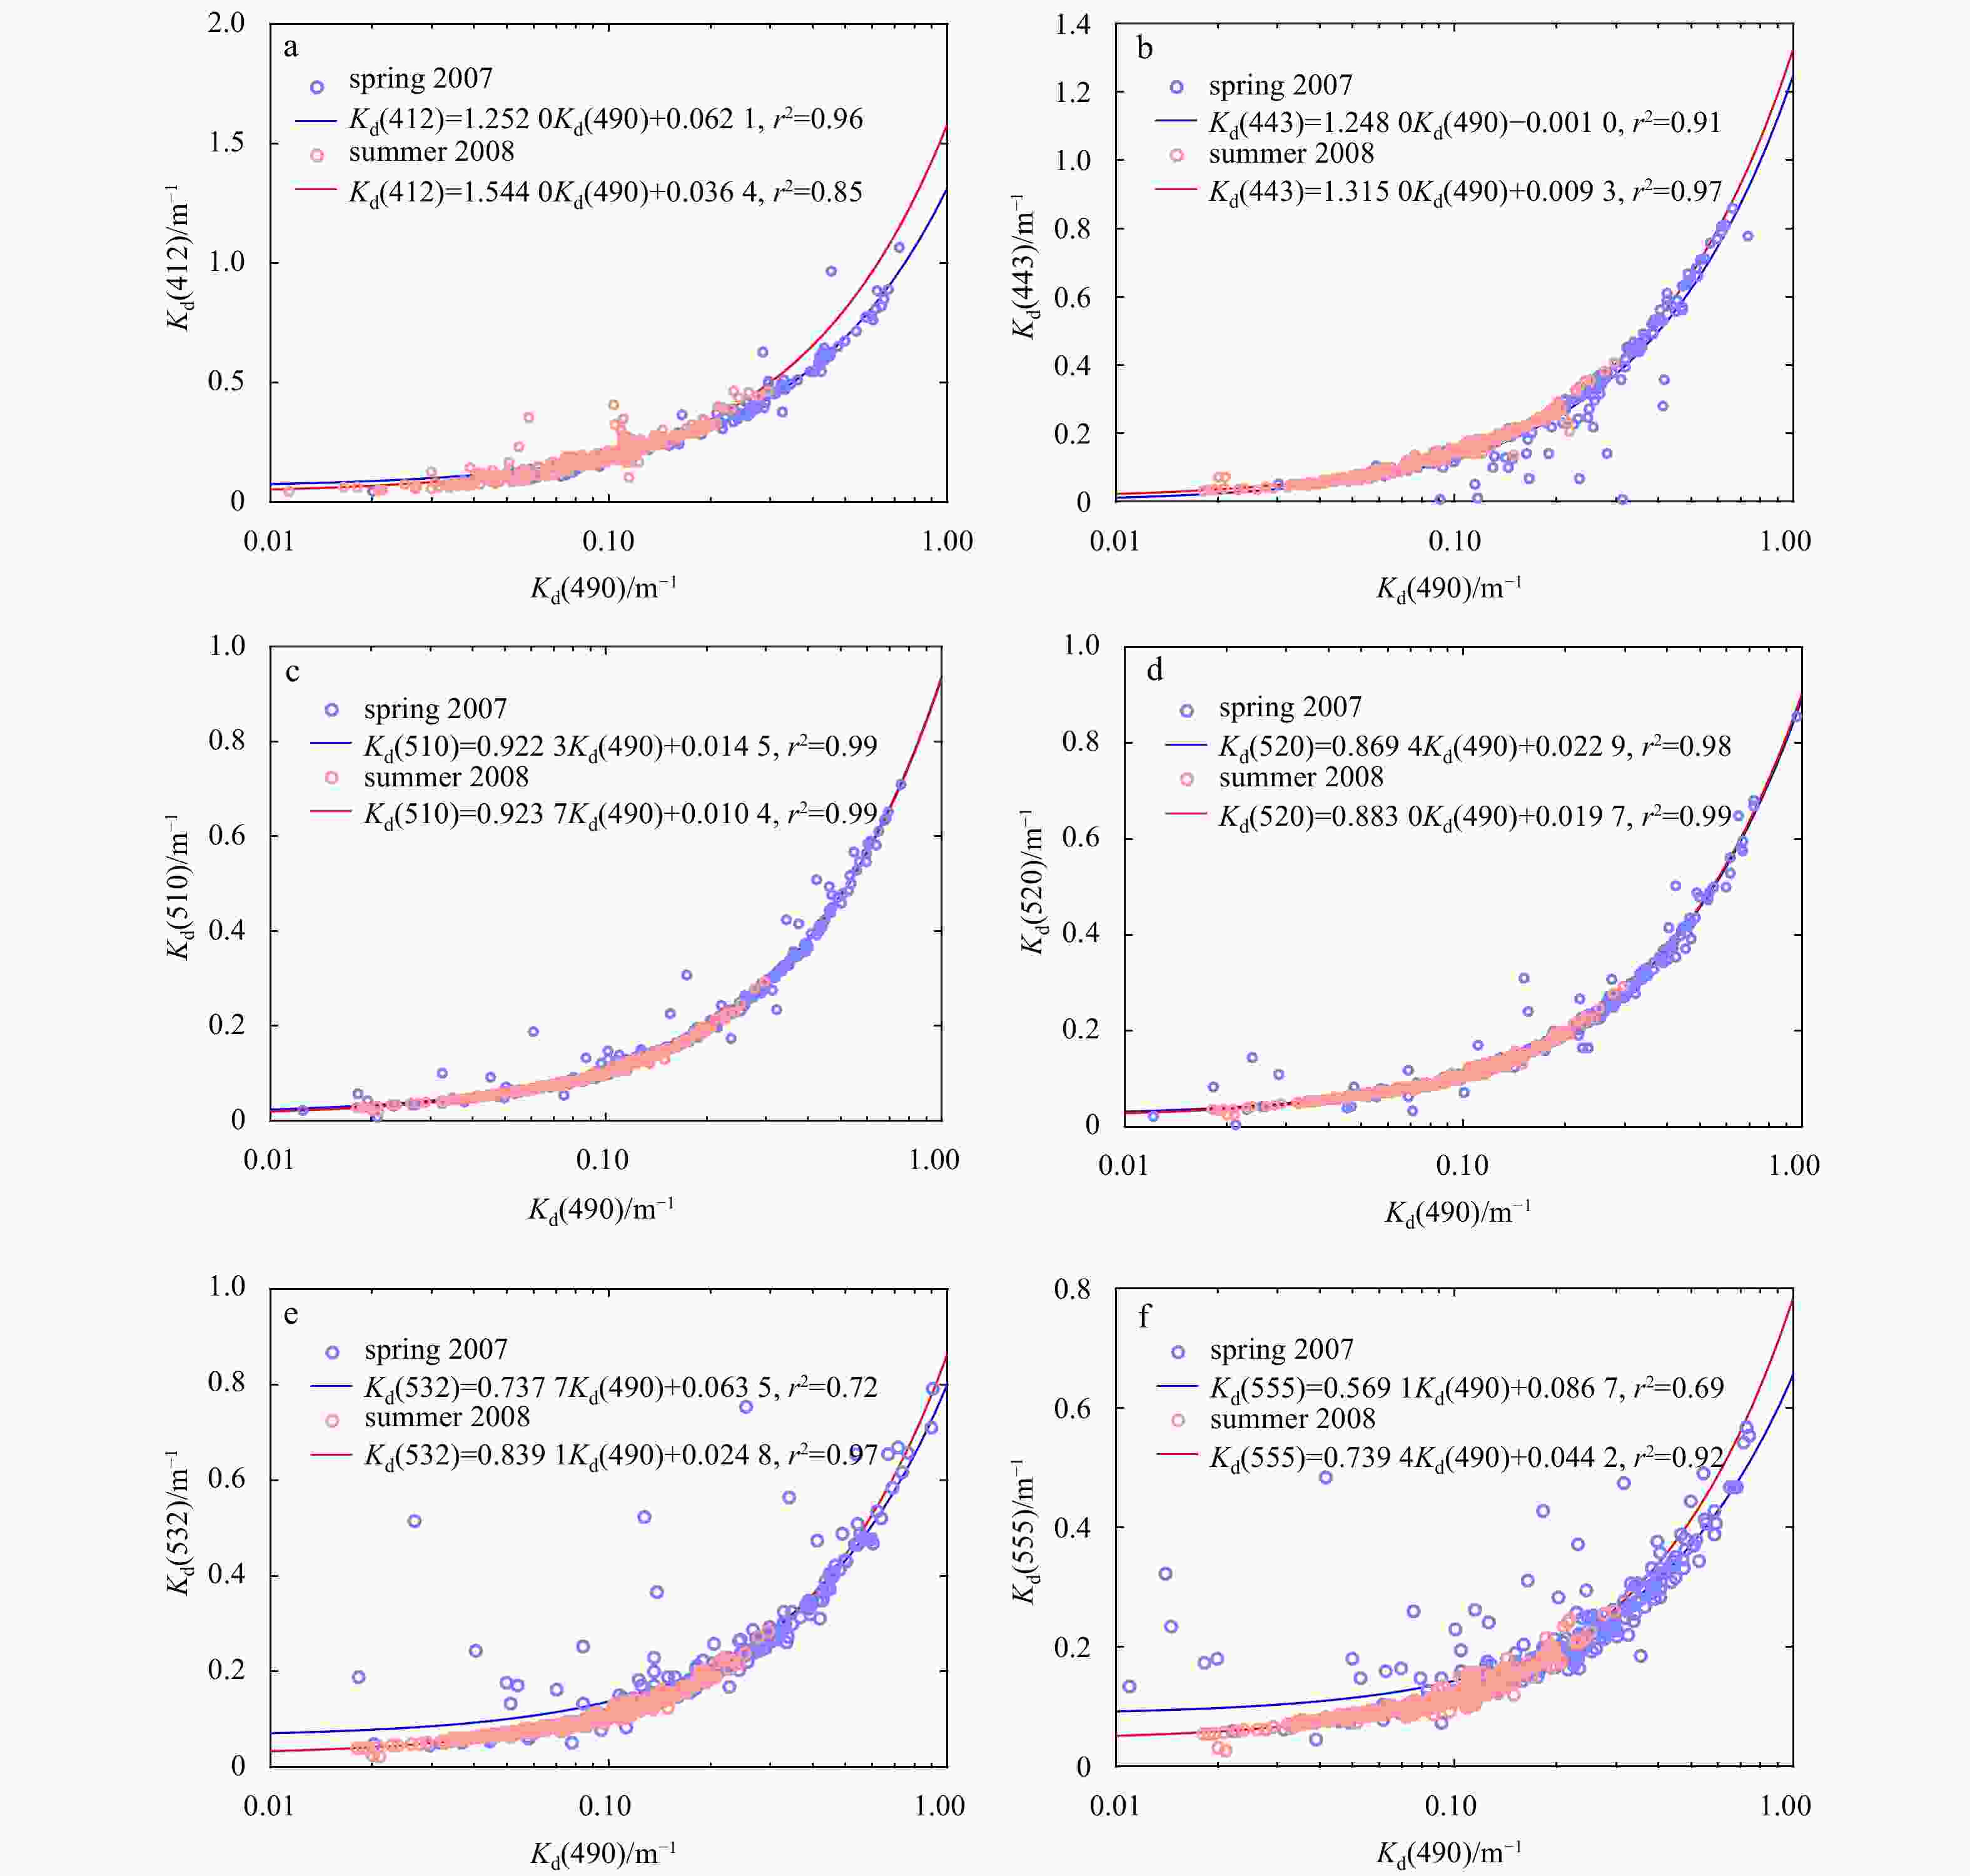
Figure 16. The relationships between
${{ K}}_{\mathrm{d}}({\text{λ}})$ at 490 nm and${{ K}}_{\mathrm{d}}({\text{λ}})$ at 412 nm, 443 nm, 510 nm, 520 nm, 532 nm, and 555 nm, respectively. The blue and red lines are the fitted linear functions in spring and summer, respectively. The light blue and light red circles indicate the chlorophyll a concentration in spring and summer, respectively.Table 1. Summary of the cruises, stations, and sampled variables
Cruise Time Season Area Location Number of
stationsParameters Healy-0702 2007/05/18– spring Bering Sea shelf 61°–66°N 92 temperature (°C), salinity, irradiance (μW/(cm2·nm)), 2007/06/16 166°–176°W turbidity (FTU), chlorophyll a concentration (mg/m3), Healy-0801 2008/03/16– winter southern Bering Sea shelf 62°–63°N 14 irradiance (μW/(cm2·nm)) 2008/03/23 168°–175°W CHINARE-0803 2008/07/23– summer northern Bering Sea shelf 60°–65°N 18 temperature (°C), salinity, irradiance (μW/(cm2·nm)), 2008/07/27 167°–179°W turbidity (FTU), chlorophyll a concentration (mg/m3), Healy-0901 2009/03/14– winter southern Bering Sea shelf 62°–64°N 22 irradiance (μW/(cm2·nm)) 2009/03/28 168°–175°W  下载: 导出CSV
Table 2. Regression coefficients fitted at 412–555 nm in spring and summer in this study and values in reference
Period/reference $\text{λ} $/nm Kw/m−1 e($\text{λ} $) $\chi $ r2 Spring 412 0.0081 0.3669 0.2584 0.35 443 0.0090 0.5184 0.1503 0.56 490 0.0166 0.5323 0.1200 0.67 510 0.0339 0.5468 0.1065 0.70 532 0.0445 0.5348 0.1058 0.71 555 0.0606 0.5059 0.0917 0.71 Summer 412 0.0081 0.3360 0.2105 0.54 443 0.0090 0.3664 0.1568 0.55 490 0.0166 0.3805 0.1489 0.55 510 0.0339 0.4005 0.0863 0.47 532 0.0445 0.3930 0.0800 0.45 555 0.0606 0.3741 0.0716 0.39 Morel and Maritorena (2001) 410 0.0081 0.6518 0.1226 445 0.0090 0.6744 0.1056 490 0.0166 0.6896 0.0724 510 0.0339 0.6857 0.0594 530 0.0445 0.6722 0.0483 555 0.0606 0.6420 0.0400
下载: 导出CSV
-
Austin R W, Petzold T J. 1986. Spectral dependence of the diffuse attenuation coefficient of light in ocean waters. Optical Engineering, 25(3): 471–479 Baker K S, Smith R C. 1990. Irradiance transmittance through the air/water interface. In: Proceedings Volume 1302, Ocean Optics X. Orlando, FL, USA: SPIE, 556–565 Berthon J F, Zibordi G. 2004. Bio-optical relationships for the northern Adriatic Sea. International Journal of Remote Sensing, 25(7–8): 1527–1532 Bricaud A, Babin M, Morel A, et al. 1995. Variability in the chlorophyll-specific absorption coefficients of natural phytoplankton: analysis and parameterization. Journal of Geophysical Research: Oceans, 100(C7): 13321–13332. doi: 10.1029/95JC00463 Bricaud A, Morel A, Prieur L. 1981. Absorption by dissolved organic matter of the sea (yellow substance) in the UV and visible domains. Limnology & Oceanography, 26(1): 43–53 Coachman L K, Aagaard K, Tripp R B. 1975. Bering Strait: The Regional Physical Oceanography. Seattle and London: University of Washington Press Coachman L K, Shigaev V V. 1992. Northern Bering-Chukchi Sea Ecosystem: the physical basis. In: Nagel P A, ed. Results of the Third Joint US-USSR Bering and Chukchi Seas Expedition (BERPAC), Summer 1988. Washington, DC: US Fish and Wildlife Service, 17–27 Cooper L W, Janout M A, Frey K E, et al. 2012. The relationship between sea ice break-up, water mass variation, chlorophyll biomass, and sedimentation in the northern Bering Sea. Deep-Sea Research Part II: Topical Studies in Oceanography, 65–70: 141–162 Corlett W B, Pickart R S. 2017. The Chukchi slope current. Progress in Oceanography, 153: 50–65. doi: 10.1016/j.pocean.2017.04.005 Cota G F, Pomeroy L R, Harrison W G, et al. 1996. Nutrients, primary production and microbial heterotrophy in the southeastern Chukchi Sea: Arctic summer nutrient depletion and heterotrophy. Marine Ecology Progress Series, 135(1–3): 247–258 Danielson S L, Ahkinga O, Ashjian C, et al. 2020. Manifestation and consequences of warming and altered heat fluxes over the Bering and Chukchi Sea continental shelves. Deep-Sea Research Part II: Topical Studies in Oceanography, 177: 104781. doi: 10.1016/j.dsr2.2020.104781 Danielson S L, Eisner L, Ladd C, et al. 2017. A comparison between late summer 2012 and 2013 water masses, macronutrients, and phytoplankton standing crops in the northern Bering and Chukchi Seas. Deep-Sea Research Part II: Topical Studies in Oceanography, 135: 7–26. doi: 10.1016/j.dsr2.2016.05.024 Eisner L, Hillgruber N, Martinson E, et al. 2013. Pelagic fish and zooplankton species assemblages in relation to water mass characteristics in the northern Bering and southeast Chukchi seas. Polar Biology, 36(1): 87–113. doi: 10.1007/s00300-012-1241-0 Gong Donglai, Pickart R S. 2016. Early summer water mass transformation in the eastern Chukchi Sea. Deep-Sea Research Part II: Topical Studies in Oceanography, 130: 43–55. doi: 10.1016/j.dsr2.2016.04.015 Hirawake T, Oida J, Yamashita Y, et al. 2021. Water mass distribution in the northern Bering and southern Chukchi seas using light absorption of chromophoric dissolved organic matter. Progress in Oceanography, 197: 102641. doi: 10.1016/j.pocean.2021.102641 Huang Yichen, Li Yan, Shao Hao, et al. 2008. Seasonal variations of sea surface temperature, chlorophyll-a and turbidity in Beibu Gulf, MODIS imagery study. Journal of Xiamen University (Natural Science), 47(6): 856–863 Jerlov N G. 1976. Marine Optics. Amsterdam: Elsevier Kowalczuk P, Sagan S, Makarewicz A, et al. 2019. Bio-optical properties of surface waters in the Atlantic Water inflow region off Spitsbergen (Arctic Ocean). Journal of Geophysical Research: Oceans, 124(3): 1964–1987. doi: 10.1029/2018JC014529 Lee Zhong-Ping, Darecki M, Carder K L, et al. 2005. Diffuse attenuation coefficient of downwelling irradiance: an evaluation of remote sensing methods. Journal of Geophysical Research: Oceans, 110(C2): C02017 Lin Peigen, Pickart R S, McRaven L T, et al. 2019. Water mass evolution and circulation of the northeastern Chukchi Sea in summer: implications for nutrient distributions. Journal of Geophysical Research: Oceans, 124(7): 4416–4432. doi: 10.1029/2019JC015185 Lowry K E, Pickart R S, Mills M M, et al. 2015. The influence of winter water on phytoplankton blooms in the Chukchi Sea. Deep-Sea Research Part II: Topical Studies in Oceanography, 118: 53–72. doi: 10.1016/j.dsr2.2015.06.006 Martini K I, Stabeno P J, Ladd C, et al. 2016. Dependence of subsurface chlorophyll on seasonal water masses in the Chukchi Sea. Journal of Geophysical Research: Oceans, 121(3): 1755–1770. doi: 10.1002/2015JC011359 Mitchell B G, Kahru M. 1998. Algorithms for SeaWiFS standard products developed with the CalCOFI bio-optical data set. CalCOFI Reports, 39: 133–147 Morel A, Maritorena S. 2001. Bio-optical properties of oceanic waters: a reappraisal. Journal of Geophysical Research: Oceans, 106(C4): 7163–7180. doi: 10.1029/2000JC000319 Mueller J L, Morel A, Frouin R, et al. 2003. Ocean optics protocols for Satellite Ocean color sensor validation, Revision 4, Volume III. Greenbelt, Maryland: Goddard Space Flight Space Center Naik P, Wang Menghua, D’Sa E J, et al. 2015. Bering Sea optical and biological properties from MODIS. Remote Sensing of Environment, 163: 240–252. doi: 10.1016/j.rse.2015.03.020 Pickart R S, Nobre C, Lin Peigen, et al. 2019. Seasonal to mesoscale variability of water masses and atmospheric conditions in Barrow Canyon, Chukchi Sea. Deep-Sea Research Part II: Topical Studies in Oceanography, 162: 32–49. doi: 10.1016/j.dsr2.2019.02.003 Pisareva M N, Pickart R S, Spall M A, et al. 2015. Flow of pacific water in the western Chukchi Sea: Results from the 2009 RUSALCA expedition. Deep-Sea Research Part I: Oceanographic Research Papers, 105: 53–73 Pope R M, Fry E S. 1997. Absorption spectrum (380–700 nm) of pure water: II. Integrating cavity measurements. Applied Optics, 36(33): 8710–8723 Sambrotto R N, Goering J J, McRoy C P. 1984. Large yearly production of phytoplankton in the western Bering Strait. Science, 225(4667): 1147–1150. doi: 10.1126/science.225.4667.1147 Siegel D A, Dickey T D. 1987. Observations of the vertical structure of the diffuse attenuation coefficient spectrum. Deep-Sea Research Part A: Oceanographic Research Papers, 34(4): 547–563 Spreen G, Kaleschke L, Heygster G. 2008. Sea ice remote sensing using AMSR-E 89-GHz channels. Journal of Geophysical Research: Oceans, 113(C2): C02S03 Springer A M, McRoy C P. 1993. The paradox of pelagic food webs in the northern Bering Sea: III. Patterns of primary production. Continental Shelf Research, 13(516): 575–599 Stabeno P J, Bell S W, Bond N A, et al. 2019. Distributed Biological Observatory Region 1: Physics, chemistry and plankton in the northern Bering Sea. Deep-Sea Research Part II: Topical Studies in Oceanography, 162: 8–21. doi: 10.1016/j.dsr2.2018.11.006 Stramski D. 1994. Gas microbubbles: An assessment of their significance to light scattering in quiescent seas. In: Proceedings Volume 2258, Ocean Optics XII. Bergen, Norway: SPIE, 704–710 Strong A L, Lowry K E, Brown Z W, et al. 2016. Mass balance estimates of carbon export in different water masses of the Chukchi Sea shelf. Deep-Sea Research Part II: Topical Studies in Oceanography, 130: 88–99. doi: 10.1016/j.dsr2.2016.05.003 Tiwari S P, Shanmugam P. 2011. An optical model for the remote sensing of coloured dissolved organic matter in coastal/ocean waters. Estuarine, Coastal & Shelf Science, 93(4): 396–402 Volynsky V A, Sudbin A I. 1992. Statistical analysis of spectra of diffuse attenuation coefficient. Oceanologia, 32(5): 821–829 Walsh J J, McRoy C P, Coachman L K, et al. 1989. Carbon and nitrogen cycling within the Bering/Chukchi seas: Source regions for organic matter effecting AOU demands of the Arctic Ocean. Progress in Oceanography, 22(4): 277–359. doi: 10.1016/0079-6611(89)90006-2 Wang Guifen, Cao Wenxi, Yang Dingtian, et al. 2008. Variation in downwelling diffuse attenuation coefficient in the northern South China Sea. Chinese Journal of Oceanology & Limnology, 26(3): 323–333. doi: 10.1007/s00343-008-0323-x Wang Xiaoyu, Zhao Jinping. 2011. Distribution and inter-annual variations of the cold water on the northern shelf of Bering Sea in summer. Haiyang Xuebao (in Chinese), 33(2): 1–10 Wang Weibo, Zhao Jinping. 2014. Variation of diffuse attenuation coefficient of downwelling irradiance in the Arctic Ocean. Acta Oceanologica Sinica, 33(6): 53–62. doi: 10.1007/s13131-014-0489-3 Xing Xiaogang, Boss E, Zhang Jie, et al. 2020. Evaluation of ocean color remote sensing algorithms for diffuse attenuation coefficients and optical depths with data collected on BGC-Argo floats. Remote Sensing, 12(15): 2367. doi: 10.3390/rs12152367 Yamashita Y, Yagi Y, Ueno H, et al. 2019. Characterization of the water masses in the shelf region of the Bering and Chukchi seas with fluorescent organic matter. Journal of Geophysical Research: Oceans, 124(11): 7545–7556. doi: 10.1029/2019JC015476 Yentsch C S. 1965. Distribution of chlorophyll and phaeophytin in the open ocean. Deep-Sea Research and Oceanographic Abstracts, 12(5): 653–666. doi: 10.1016/0011-7471(65)91864-4 Zhang Xiaodong, Lewis M, Johnson B. 1998. Influence of bubbles on scattering of light in the ocean. Applied Optics, 37(27): 6525–6536. doi: 10.1364/AO.37.006525 -


 点击查看大图

计量
- 文章访问数: 346
- HTML全文浏览量: 95
- PDF下载量: 12
- 被引次数: 0

