

LIC color texture enhancement algorithm for ocean vector field data based on HSV color mapping and cumulative distribution function
-
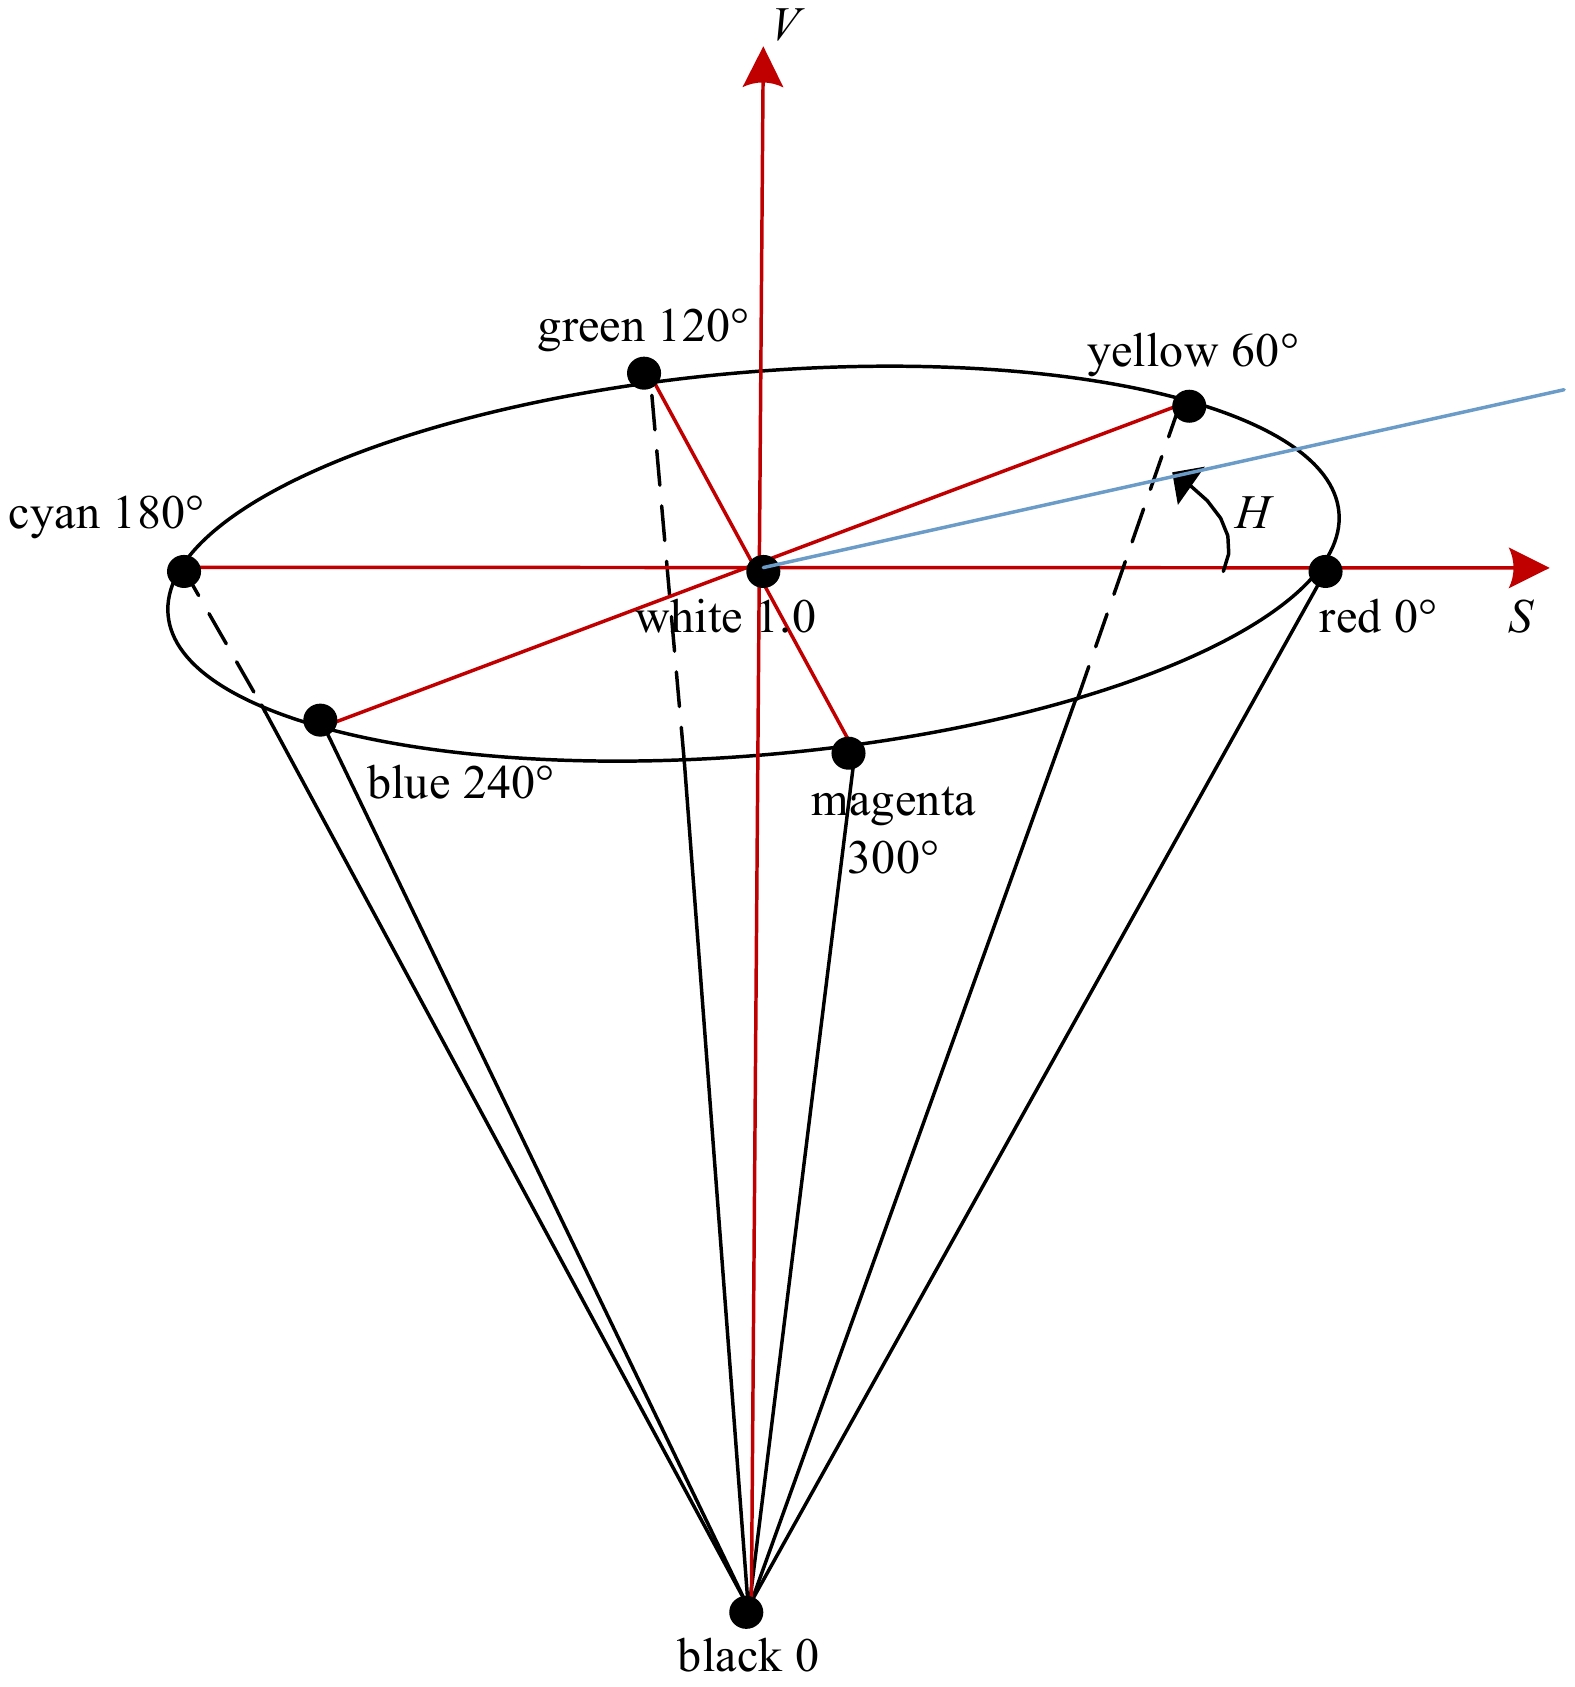
Abstract: Texture-based visualization method is a common method in the visualization of vector field data. Aiming at adding color mapping to the texture of ocean vector field and solving the ambiguity of vector direction in texture image, a new color texture enhancement algorithm based on the Line Integral Convolution (LIC) for the vector field data is proposed, which combines the HSV color mapping and cumulative distribution function calculation of vector field data. This algorithm can be summarized as follows: firstly, the vector field data is convoluted twice by line integration to get the gray texture image. Secondly, the method of mapping vector data to each component of the HSV color space is established. And then, the vector field data is mapped into HSV color space and converted from HSV to RGB values to get the color image. Thirdly, the cumulative distribution function of the RGB color components of the gray texture image and the color image is constructed to enhance the gray texture and RGB color values. Finally, both the gray texture image and the color image are fused to get the color texture. The experimental results show that the proposed LIC color texture enhancement algorithm is capable of generating a better display of vector field data. Furthermore, the ambiguity of vector direction in the texture images is solved and the direction information of the vector field is expressed more accurately.
-

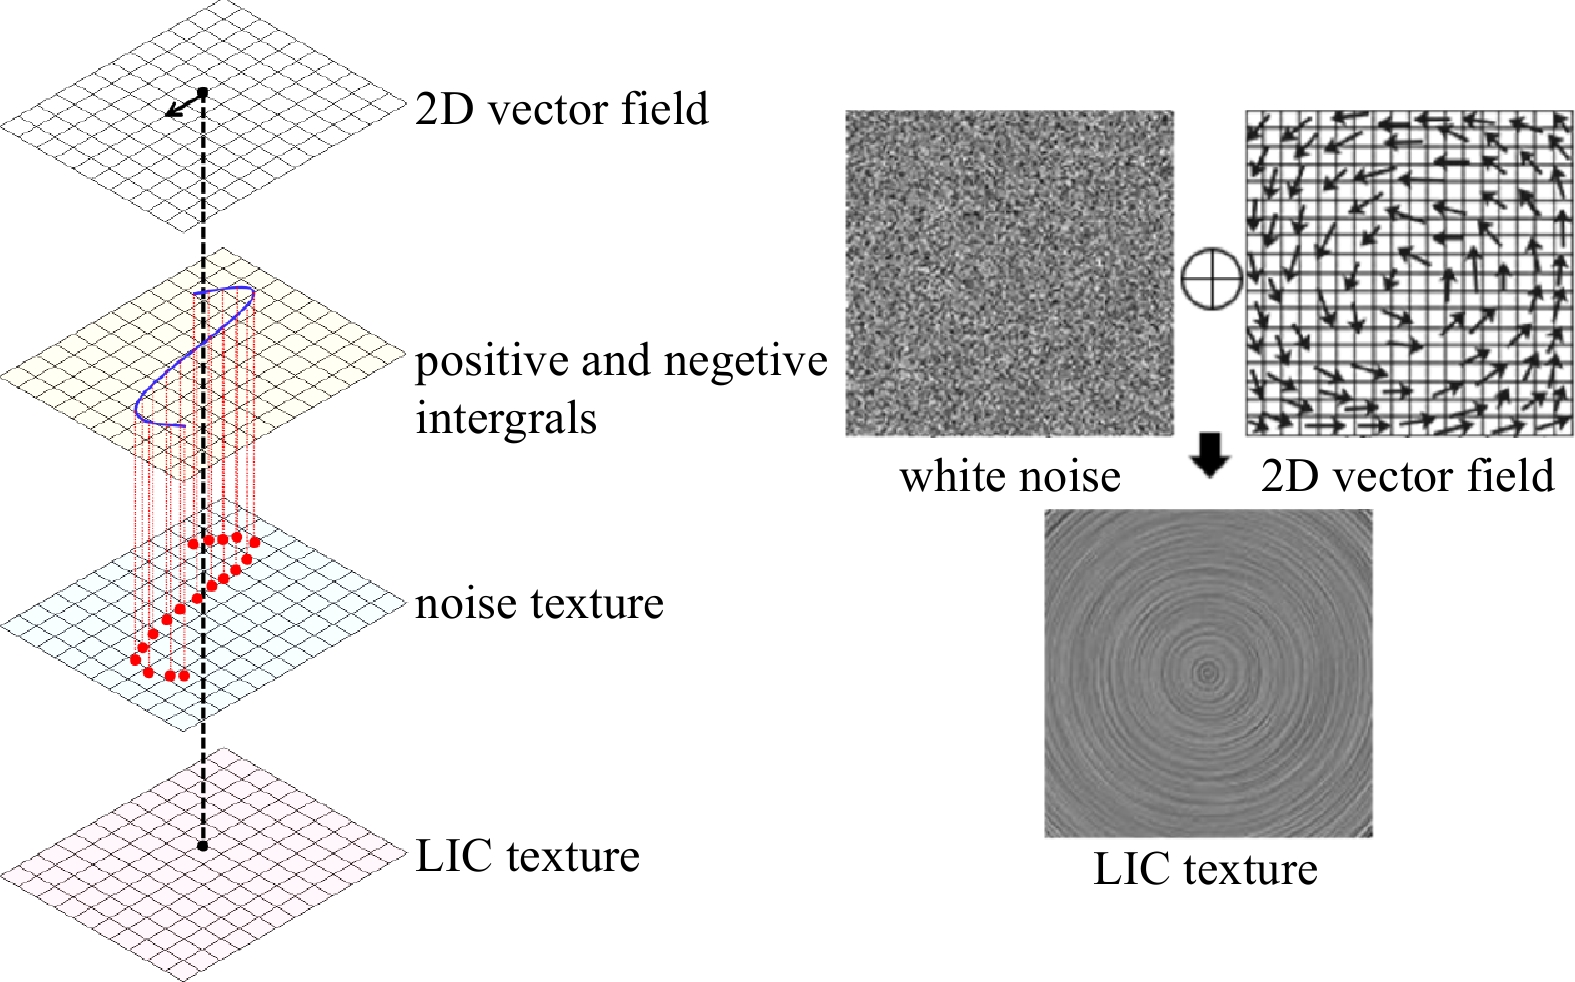
Figure 1. Procedure of LIC algorithm. Blue line: the streamline generated by positive and negative integrals. Red points: white noise.

Figure 2. Streamline generation in LIC. Red line denote the tangent direction of the streamline.

Figure 11. LIC texture merge with HSV color mapping and cumulative distribution function.

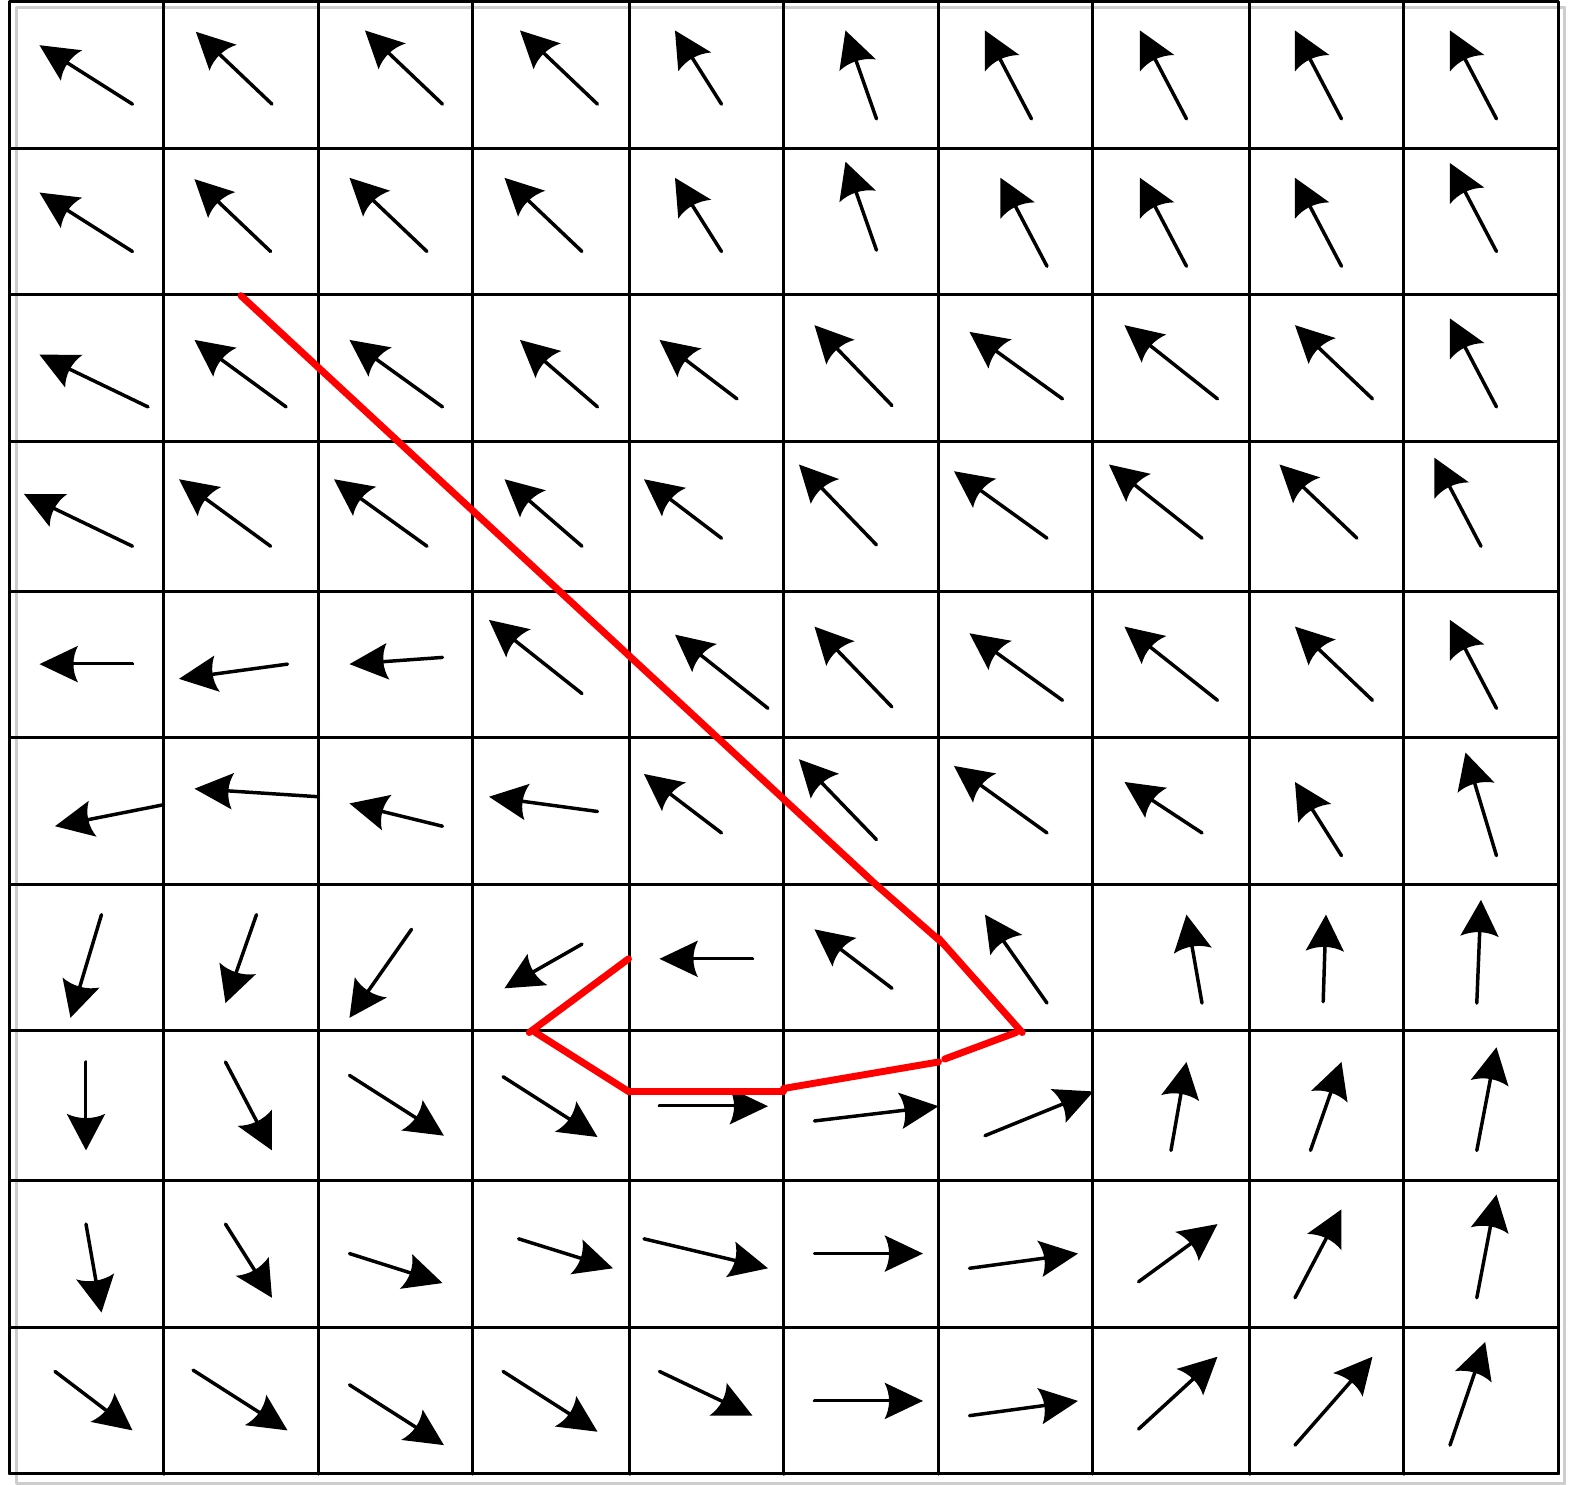
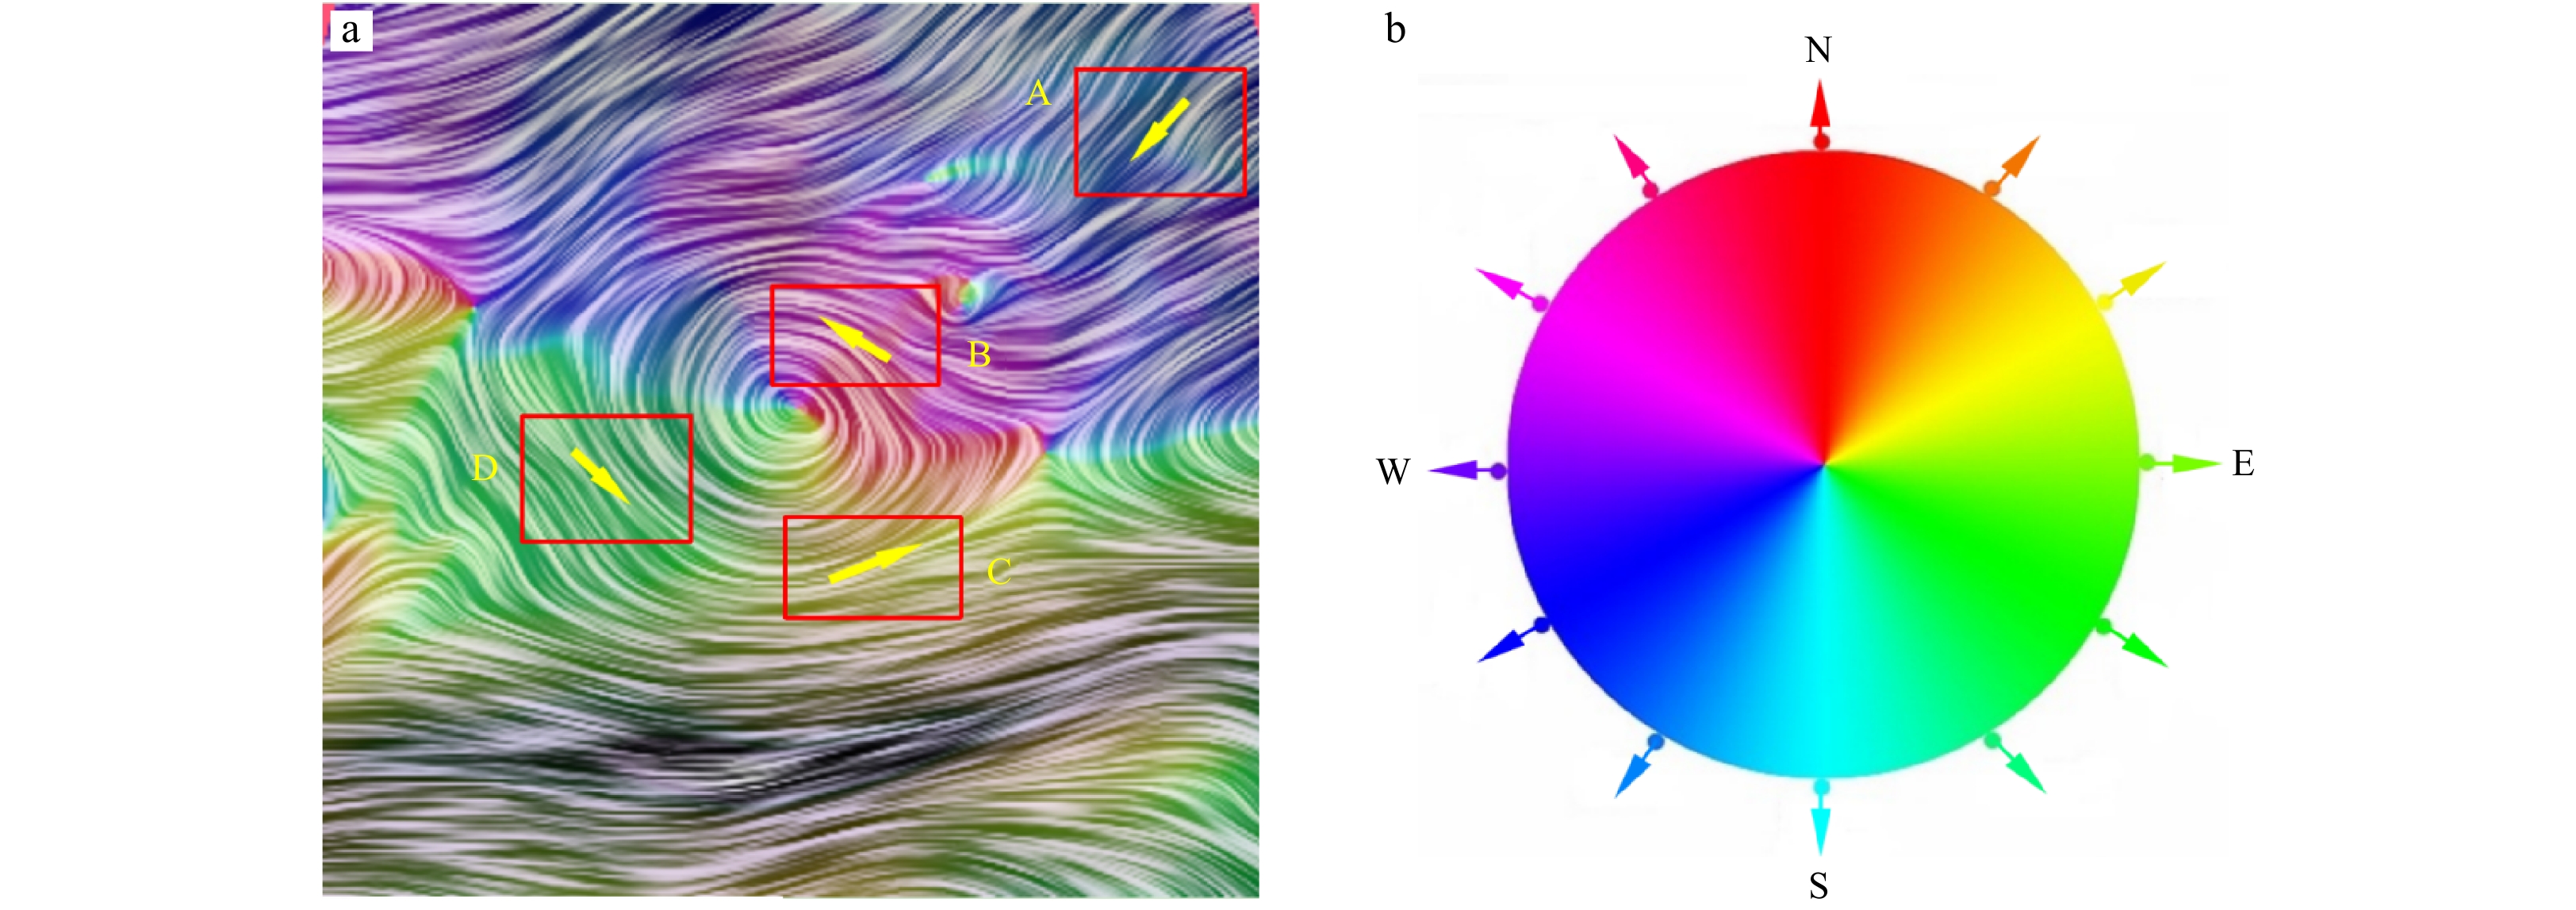
Figure 12. Texture-based visualization combined with a color legend. a. Enhanced LIC color texture, and b. color direction legend. The yellow arrows in a represent the vector field directions of different box areas.

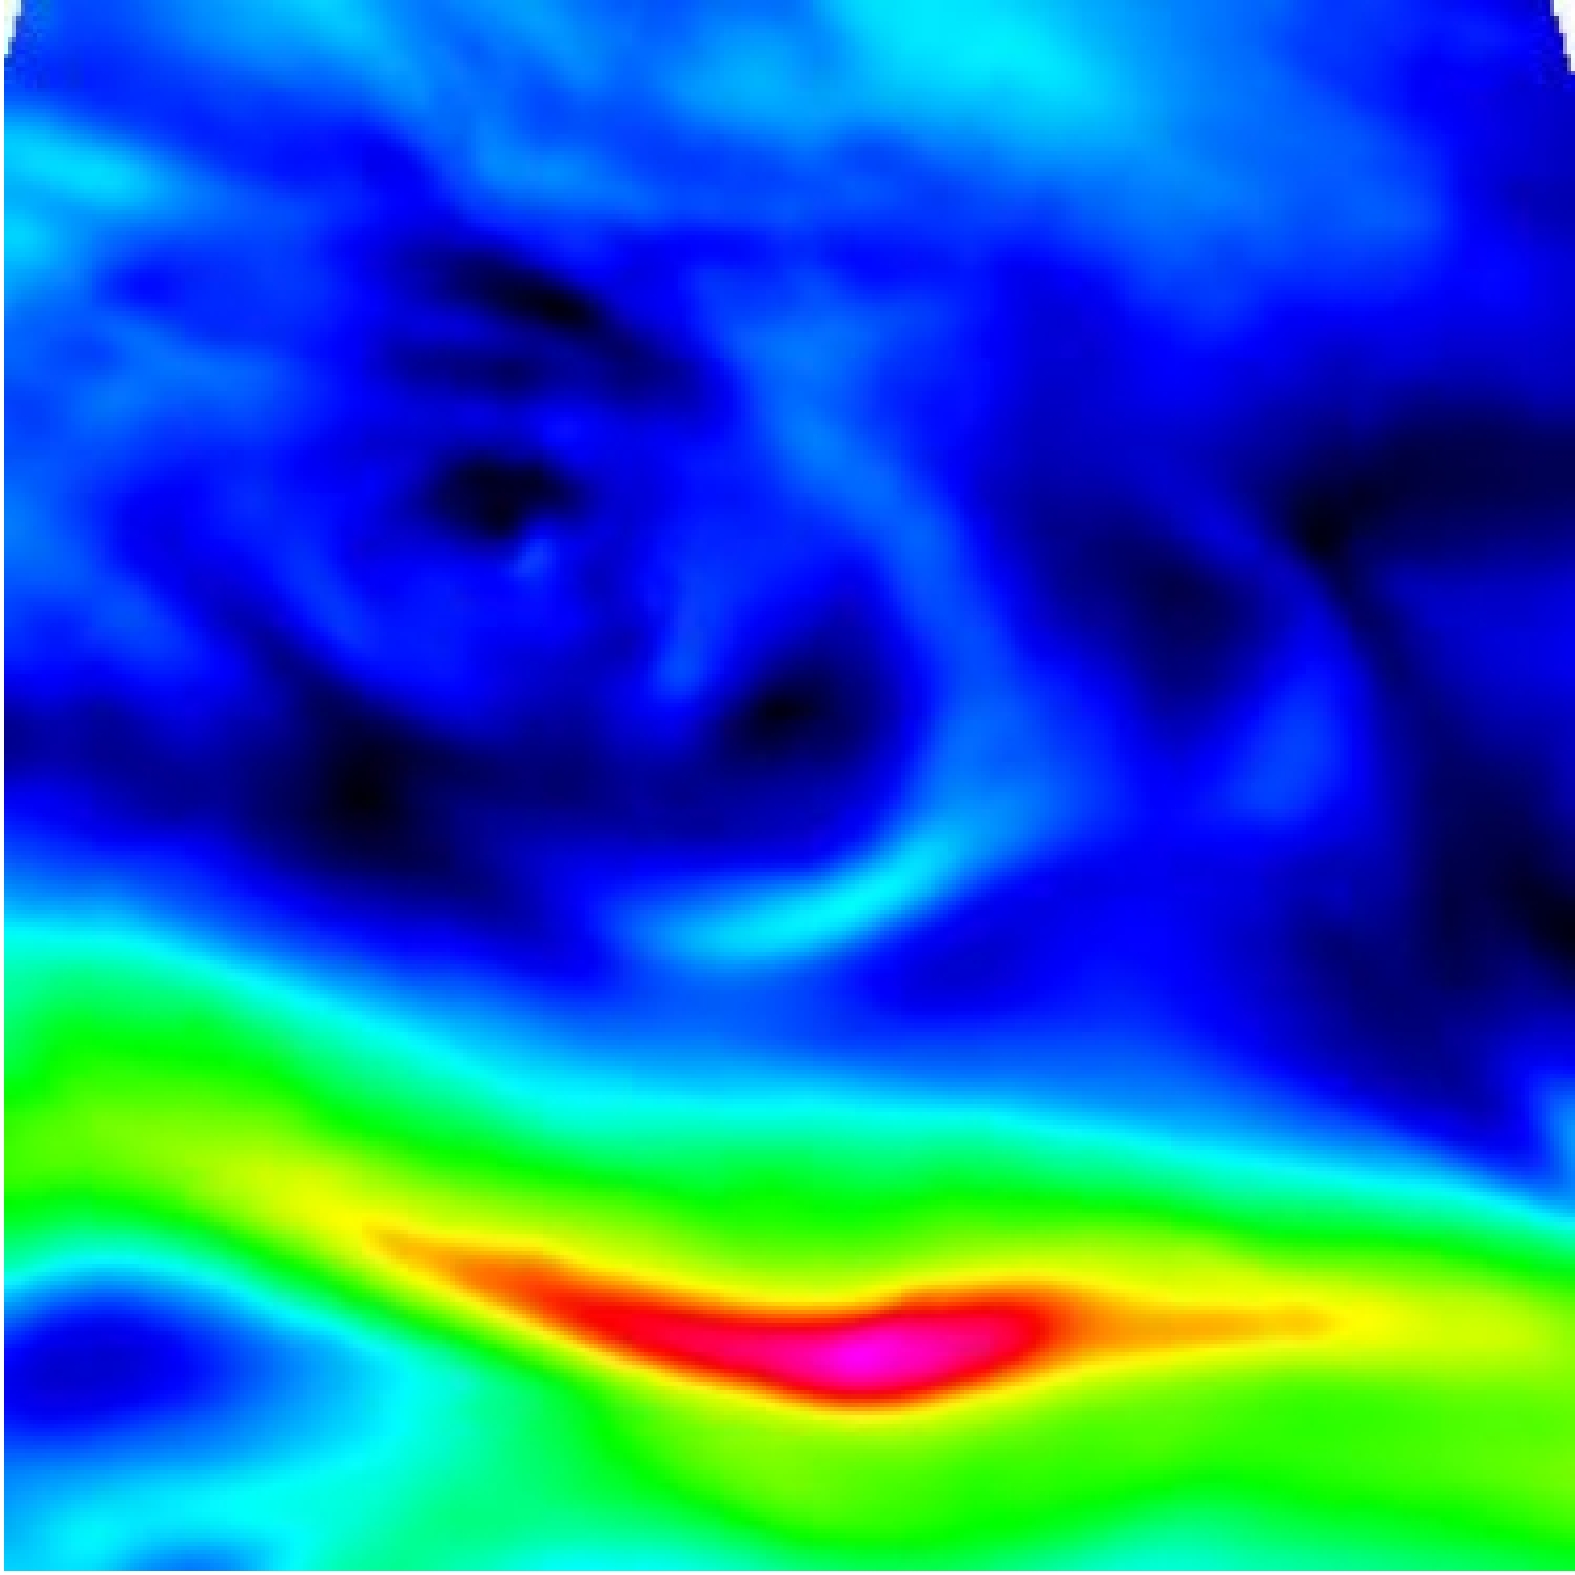
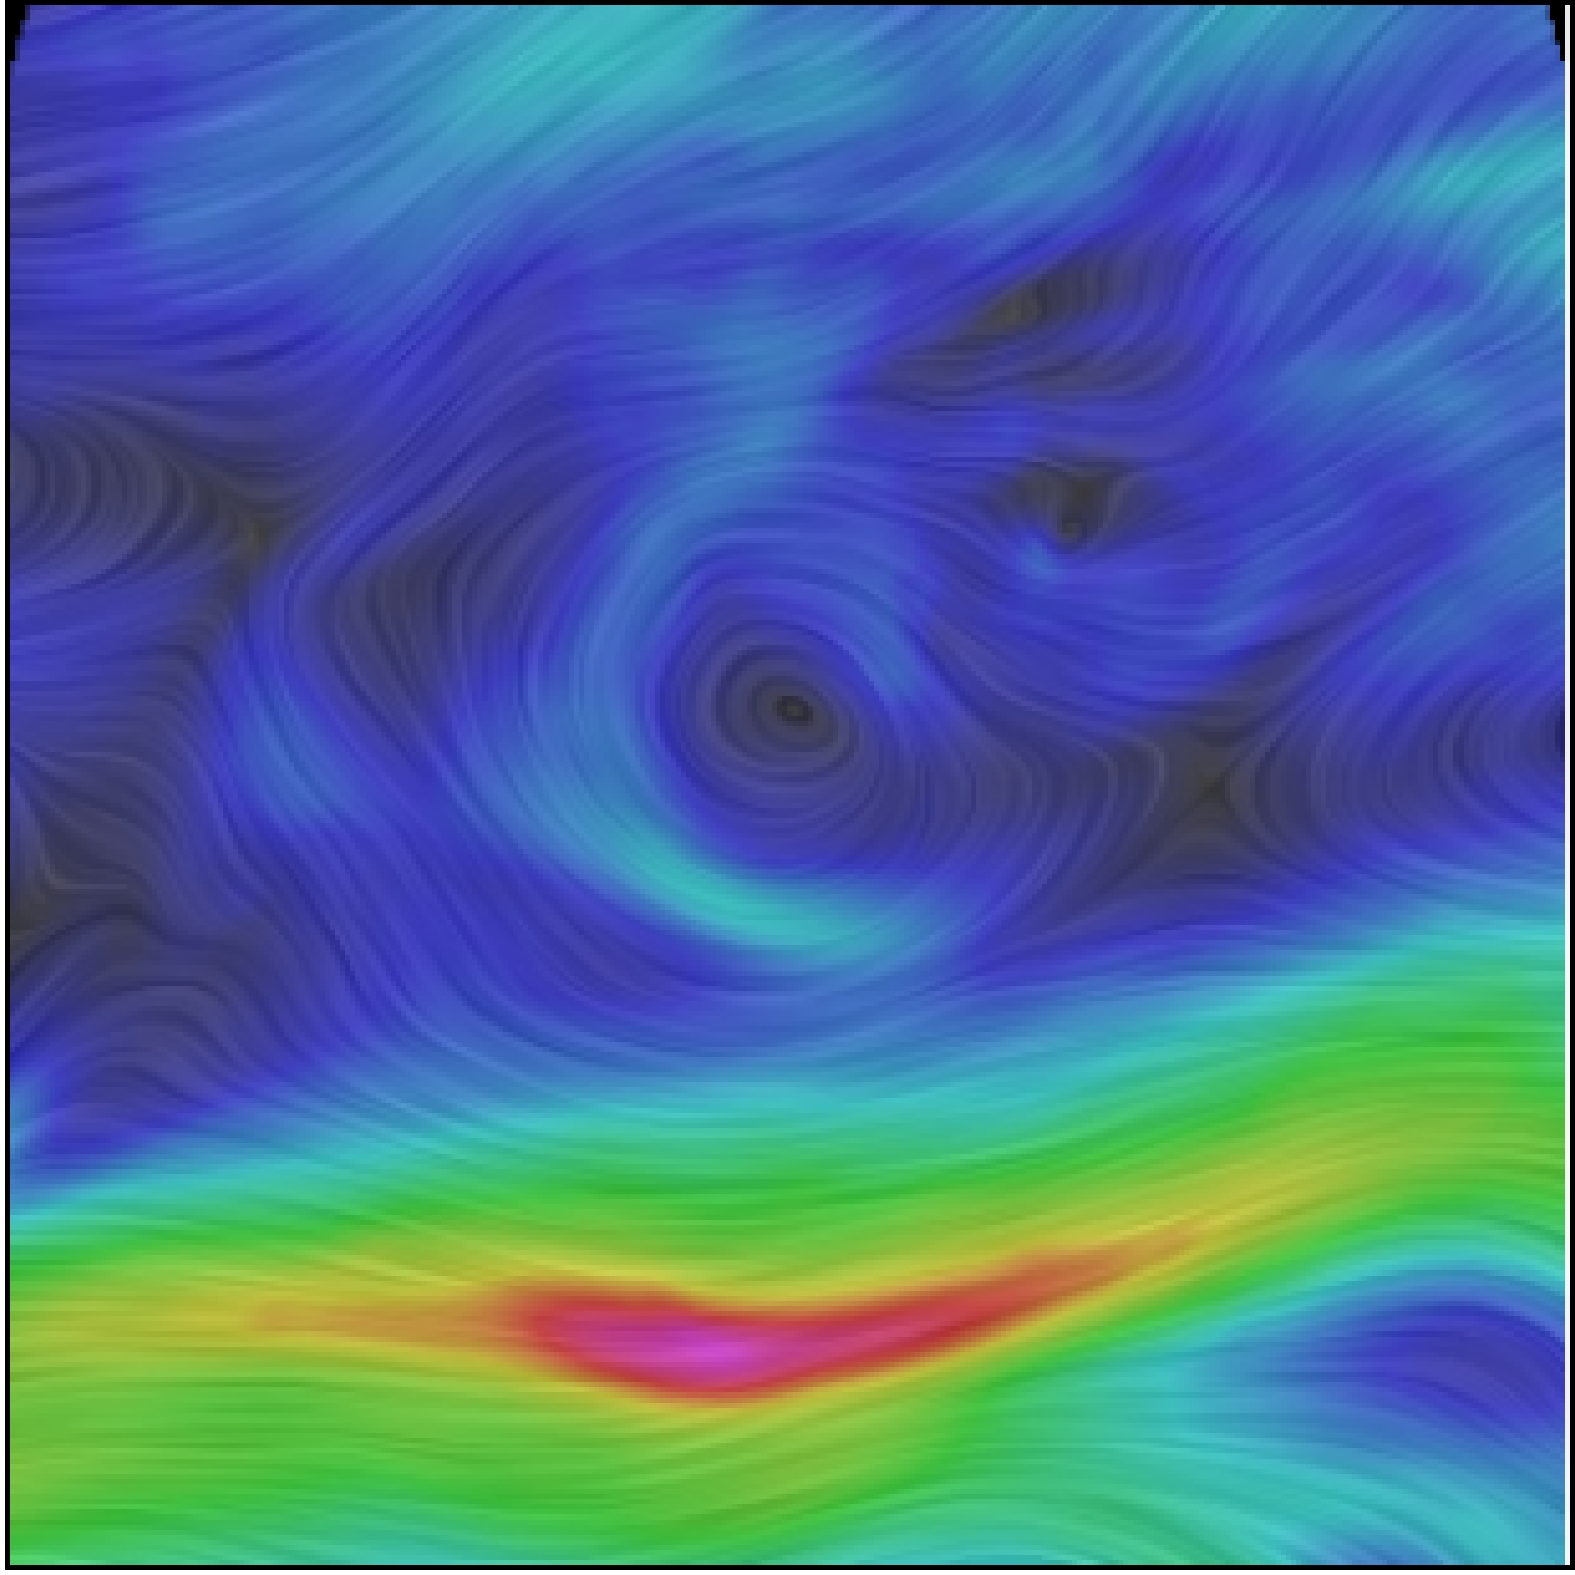
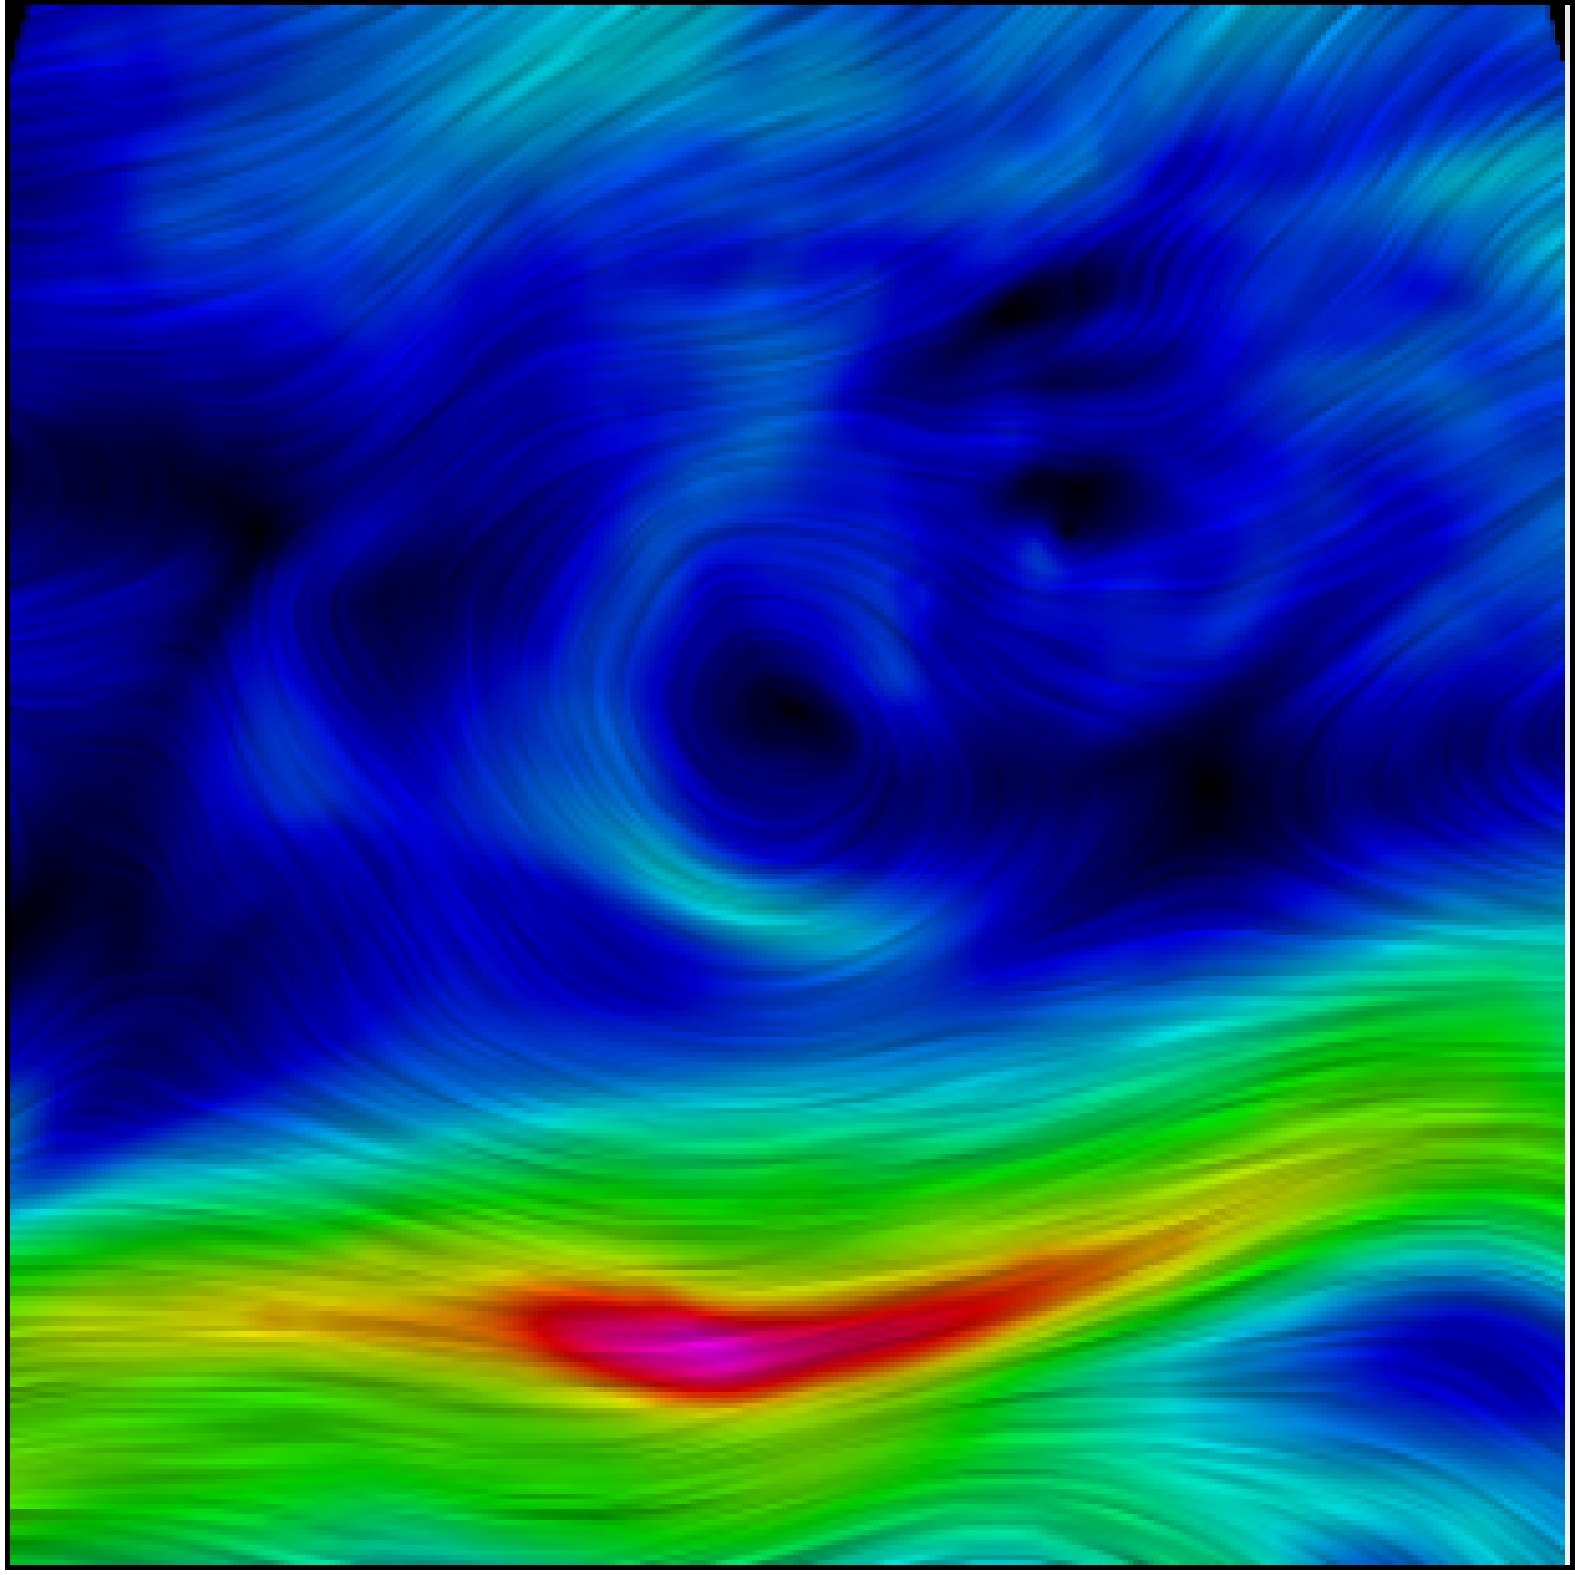
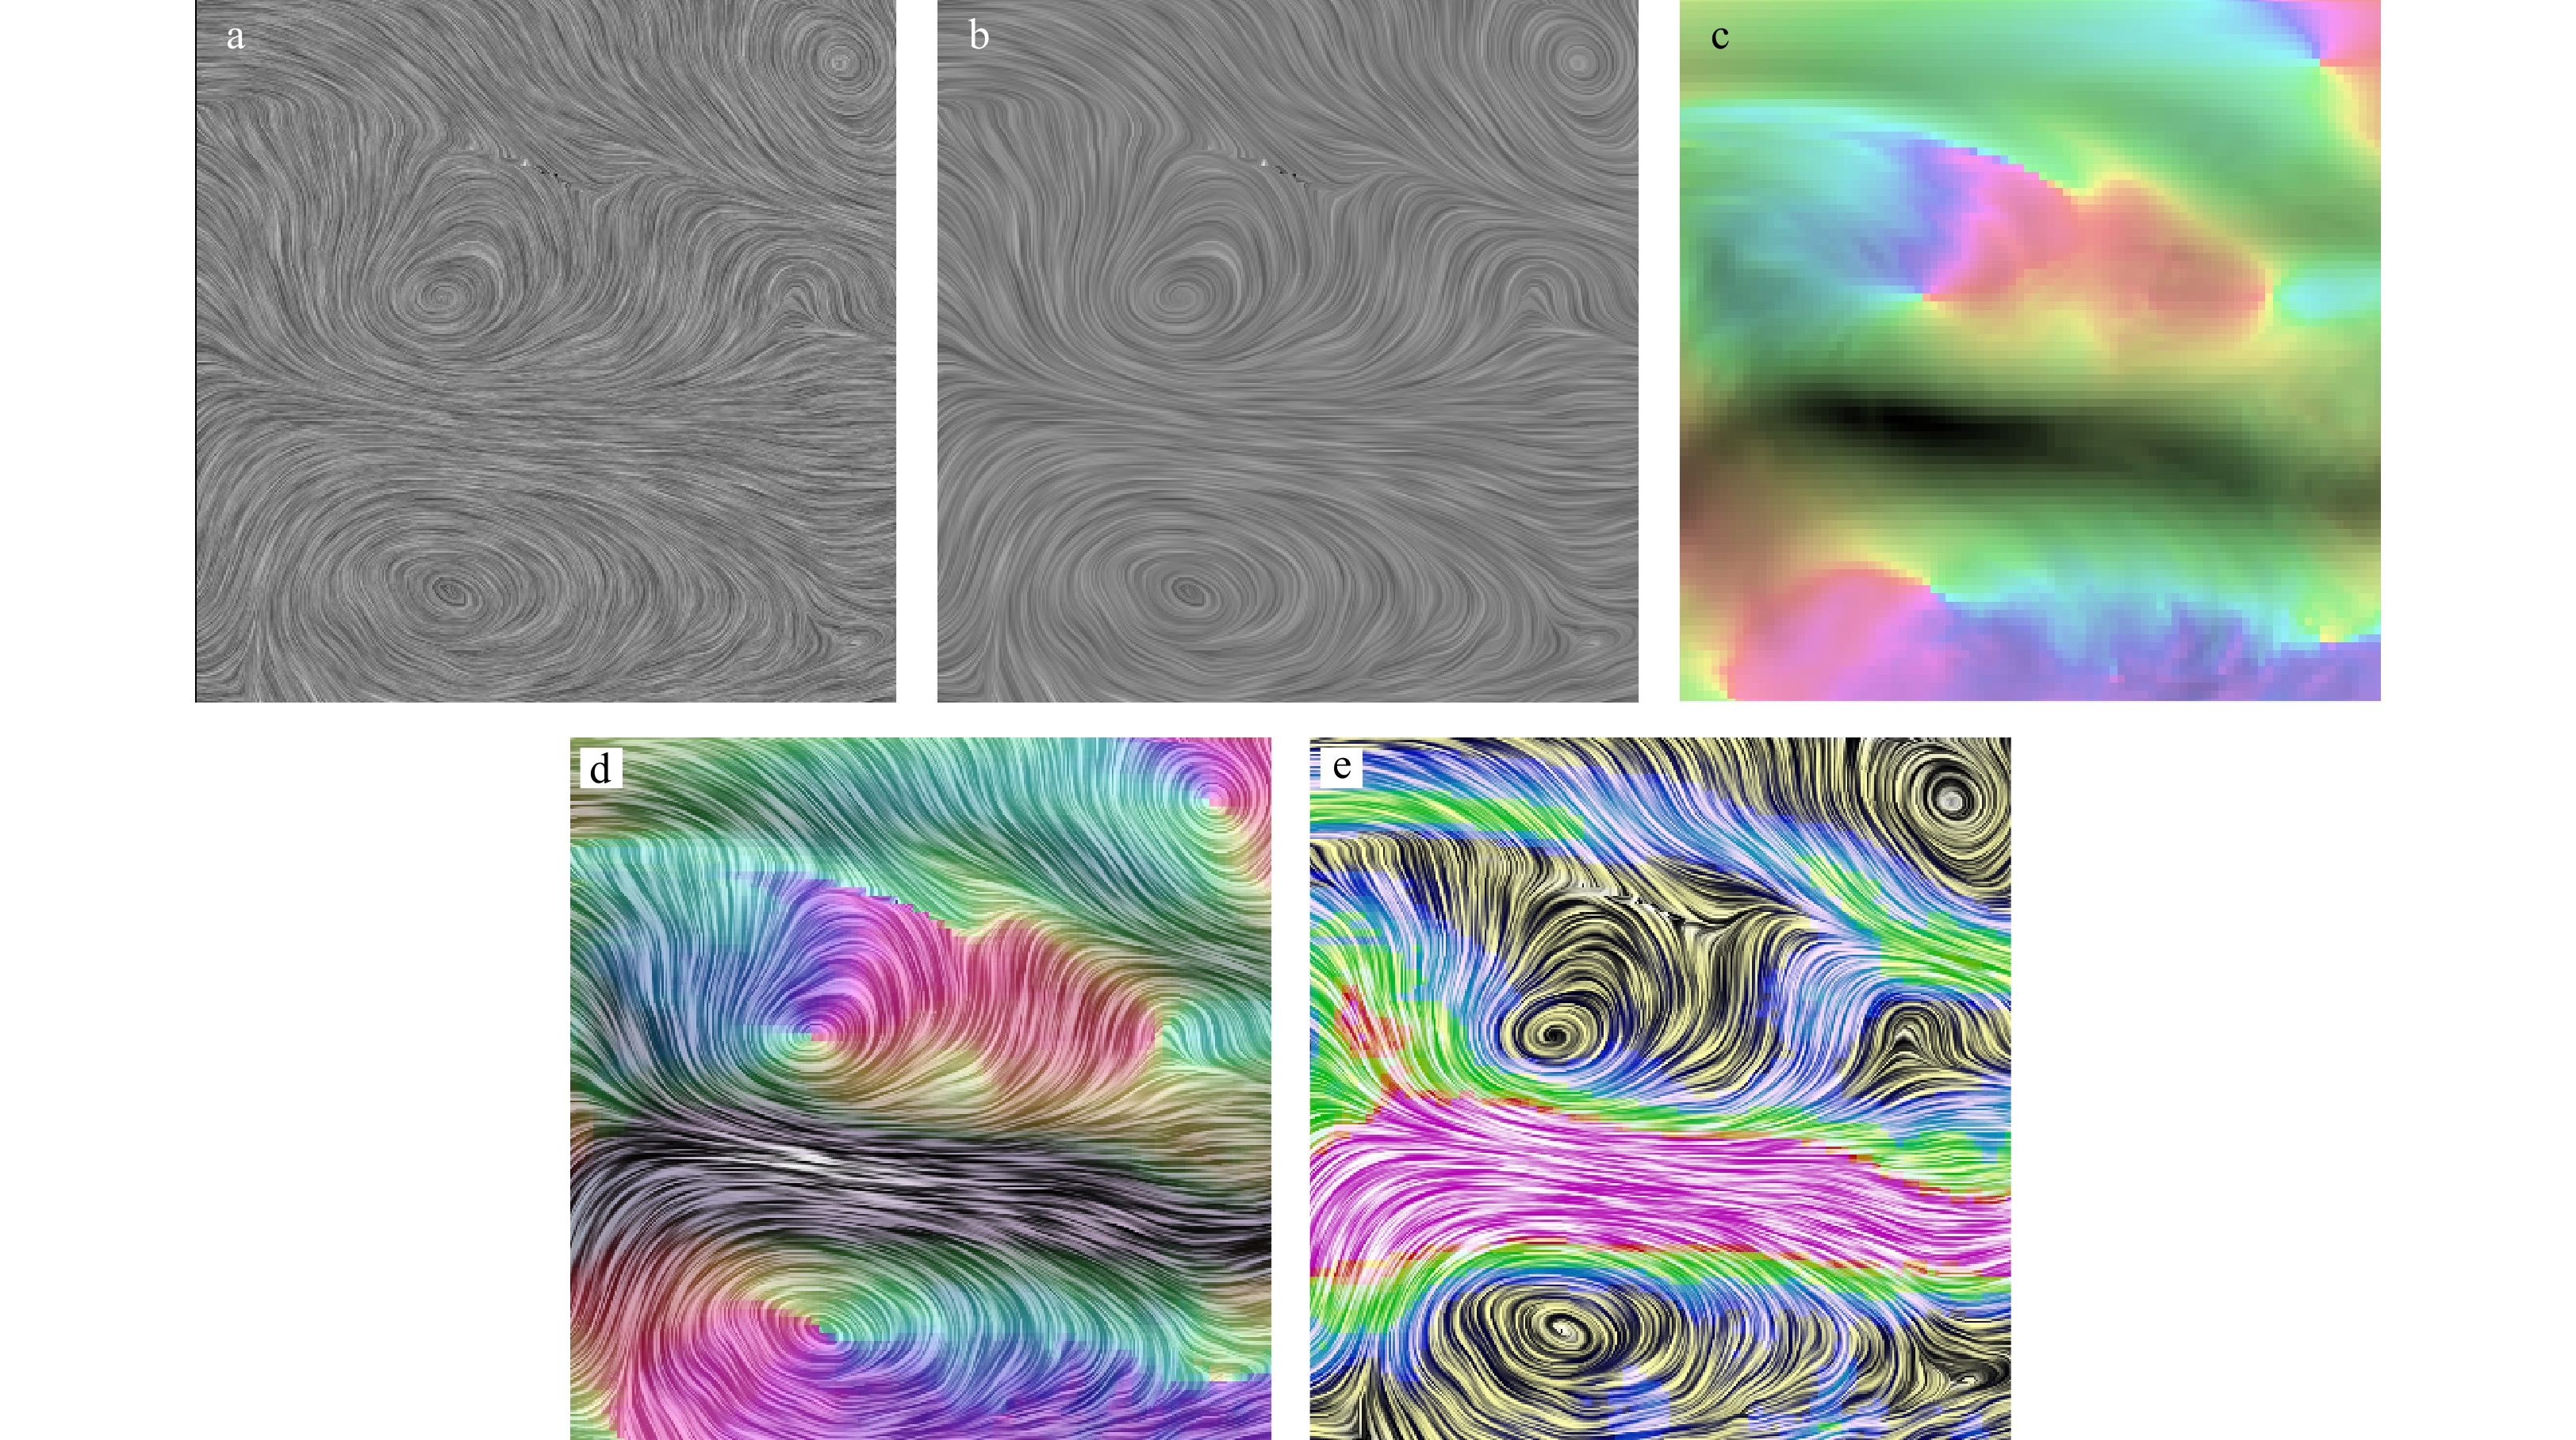
Figure 13. Data set A: 0.5-degree wind data LIC texture color enhancement process and comparison. a. Streamline texture generated by once LIC, b. Streamline texture generated by twice LIC, c. wind direction and velocity map of HSV color mapping, d. texture enhancement results of HSV color mapping and cumulative distribution function (our method), and e. texture enhancement results of linear RGB color mapping and cumulative distribution function.

Figure 14. Data set B: 0.25-degree wind data LIC texture color enhancement process and comparison. a. Streamline texture generated by once LIC, b. streamline texture generated by twice LIC, c. wind direction and velocity map of HSV color mapping, d. texture enhancement results of HSV color mapping and cumulative distribution function (our method), and e. texture enhancement results of linear RGB color mapping and cumulative distribution function.

Figure 16. Texture enhanced visualization of the global ocean wind field. a and b are ocean wind field data collected at two different times.
Table 1. Comparison of running time of different LIC texture color enhancement algorithms in two datasets
Attribute and running time Data set A Data set B Data description 0.5-degree wind data 0.25-degree wind data Data size 721×361 1441×721 HSV color mapping time/ms 86 336 Once LIC/ms 698 2817 Twice LIC/ms 1393 5536 Linear RGB color mapping
and cumulative/ms3053 10849 HSV color mapping and cumulative distribution/ms 3273 11669  下载: 导出CSV
-
Cabral B, Leedom L C. 1993. Imaging vector fields using line integral convolution. In: Proceedings of the 20th Annual Conference on Computer Graphics and Interactive Techniques. Anaheim, CA, USA: ACM, 263–270. doi: 10.1145/166117.166151 Chen Shilong, Li Sikun, Wang Huaihui, et al. 2013. One texture visualization method for aircraft surface vector flow field. Computer Engineering and Applications, 49(19): 123–126, 185 De Leeuw W, Van Liere R. 1997. Divide and conquer spot noise. In: Proceedings of the 1997 ACM/IEEE Conference on Supercomputing. San Jose, CA, USA: ACM, 1–13. doi: 10.1145/509593.509612 De Leeuw W C, Van Wijk J J. 1995. Enhanced spot noise for vector field visualization. In: Proceedings Visualization’95. Atlanta, GA, USA: IEEE,233–239. doi: 10.1109/VISUAL.1995.480817 Deng Zeng’an, Zhang Anmin, Zhai Jingsheng, et al. 2016. An operational radar current observing and data service platform in the East China Sea. Acta Oceanologica Sinica, 35(11): 9–15. doi: 10.1007/s13131-016-0944-4 Ding Zi’an, Liu Zhanping, Yu Yang, et al. 2015. Parallel unsteady flow line integral convolution for high-performance dense visualization. In: 2015 IEEE Pacific Visualization Symposium. Hangzhou, China: IEEE, 25–30. doi: 10.1109/PACIFICVIS.2015.7156352 Kim M, Hansen C. 2015. Surface flow visualization using the closest point embedding. In: 2015 IEEE Pacific Visualization Symposium. Hangzhou, China: IEEE, 17–23. doi: 10.1109/PACIFICVIS.2015.7156351 Kim M, Hansen C. 2017. Closest point sparse octree for surface flow visualization. In: Visualization and Data Analysis. Burlingame, CA, USA: Society for Imaging Science and Technology, 131–139, Li Ting, Ji Min, Jin Fengxiang, et al. 2018. Research on adaptive-step calculation model of marine fluid flow numerical integration. Haiyang Xuebao, 40(3): 95–101. doi: 10.3969/j.issn.0253-4193.2018.03.009 Lu Daying, Zhu Dengming, Wang Zhaoqi, et al. 2016. Efficient level of detail for texture-based flow visualization. Computer Animation and Virtual Worlds, 27(2): 123–140. doi: 10.1002/cav.1664 Madhani J T, Young J, Brown R J. 2014. Visualising experimental flow fields through a stormwater gross pollutant trap. Journal of Visualization, 17(1): 17–26. doi: 10.1007/s12650-013-0188-8 Sanna A, Montrucchio B, Montuschi P, et al. 2001. Visualizing vector fields: the thick oriented stream-line algorithm (TOSL). Computers and Graphics, 25(5): 847–855. doi: 10.1016/S0097-8493(01)00126-1 Sanna A, Zunino C, Montrucchio B, et al. 2002. Adding a scalar value to texture-based vector field representations by local contrast analysis. In: Eurographics/IEEE VGTC Symposium on Visualization. The Eurographics Association, 35–41. doi: 10.2312/VisSym/VisSym02/035-041 Stalling D, Hege H C. 1995. Fast and resolution independent line integral convolution. In: Proceedings of the 22nd Annual Conference on Computer Graphics and Interactive Techniques. New York, NY, USA: ACM, 249–256. doi: 10.1145/218380.218448 Taponecco F, Urness T, Interrante V. 2006. Directional enhancement in texture-based vector field visualization. In: Proceedings of the 4th International Conference on Computer Graphics & Interactive Techniques in Australasia & Southeast Asia. Kuala Lumpur, Malaysia: ACM,197–204. doi: 10.1145/1174429.1174463 van Wijk J J. 1991. Spot noise texture synthesis for data visualization. In: Proceedings of the 18th Annual Conference on Computer Graphics and Interactive Techniques. New York, NY, USA: ACM, 309–318. doi: 10.1145/122718.122751 van Wijk J J. 2002. Image based flow visualization. ACM Transactions on Graphics, 21(3): 745–754. doi: 10.1145/566654.566646 Wang Huaihui, Li Sikun. 2014. Information entropy-based texture adaptation for 3D vector field visualization. Applied Mechanics and Materials, 543–547: 1631–1634, Wang Quan, Tang Xiaoan, Zhang Junda, et al. 2014. An approach of vector field texture visualization based on field driven strength. In: Proccedings of 2014 International Conference on Information and Communications Technologies. Nanjing, China: IET, 1–5. doi: 10.1049/cp.2014.0647 Ye Xiaomin, Lin Mingsen, Yuan Xinzhe, et al. 2016. Satellite SAR observation of the sea surface wind field caused by rain cells. Acta Oceanologica Sinica, 35(9): 80–85. doi: 10.1007/s13131-016-0936-4 Yu Haiping, He Fazhi, Pan Yiteng. 2020. A scalable region-based level set method using adaptive bilateral filter for noisy image segmentation. Multimedia Tools and Applications, 79(9): 5743–5765. doi: 10.1007/s11042-019-08493-1 Zhang Shengdong, He Fazhi, Ren Wenqi. 2020a. NLDN: Non-local dehazing network for dense haze removal. Neurocomputing, 410: 363–373. doi: 10.1016/j.neucom.2020.06.041 Zhang Shengdong, He Fazhi, Ren Wenqi, et al. 2020b. Joint learning of image detail and transmission map for single image dehazing. The Visual Computer, 36(2): 305–316. doi: 10.1007/s00371-018-1612-9 Zöckler M, Stalling D, Hege H C. 1997. Parallel line integral convolution. Parallel Computing, 23(7): 975–989. doi: 10.1016/S0167-8191(97)00039-2 -


 点击查看大图
计量
- 文章访问数: 254
- HTML全文浏览量: 67
- PDF下载量: 9
- 被引次数: 0

