

Validation and accuracy analysis of wind products from scatterometer onboard the HY-2B satellite
-
Abstract: The Chinese marine dynamic environment satellite HY-2B was launched in October 2018 and carries a Ku-band scatterometer. This paper focuses on the accuracies of HY-2B scatterometer wind data during the period from November 2018 to May 2021. The HY-2B wind data are validated against global moored buoys operated by the U.S. National Data Buoy Center and Tropical Atmosphere Ocean, numerical model data by the National Centers for Environmental Prediction, and the Advanced Scatterometer data issued by the Remote Sensing System. The results showed that the wind speeds and directions observed by the HY-2B scatterometer agree well with these buoy wind measurements. The root-mean-squared errors (RMSEs) of the HY-2B wind speed and direction are 0.74 m/s and 11.74°, respectively. For low wind speeds (less than 5 m/s), the standard deviation of the HY-2B-derived wind direction is higher than 20°, which implies that the HY-2B wind direction for low wind speeds is less accurate than that for moderate to high wind speed ranges. The RMSE of the HY-2B wind speed is slightly larger in high latitude oceans (60°–90°S and 60°–90°N) than in low latitude regions. Furthermore, the dependence of the residuals on the cross-track location of wind vector cells and the stability of the HY-2B scatterometer wind products are discussed. The wind stability assessment results indicate that a clear yearly oscillation is observed for the HY-2B wind speed bias which is due to seasonal weather variations. In general, the accuracy of HY-2B winds meets the operational precision requirement and is consistent with other wind data.
-
Key words:
- sea surface wind /
- validation /
- microwave remote sensing /
- scatterometer
-
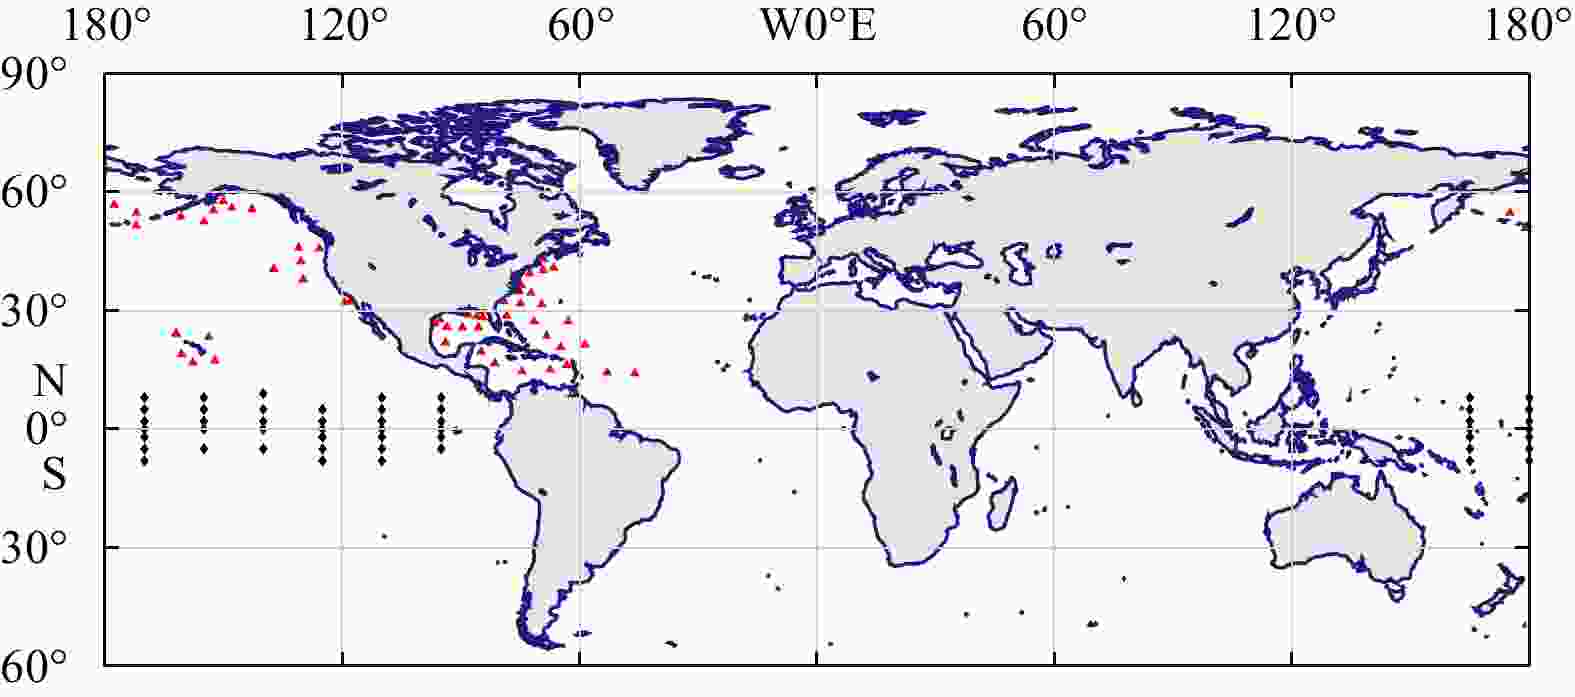
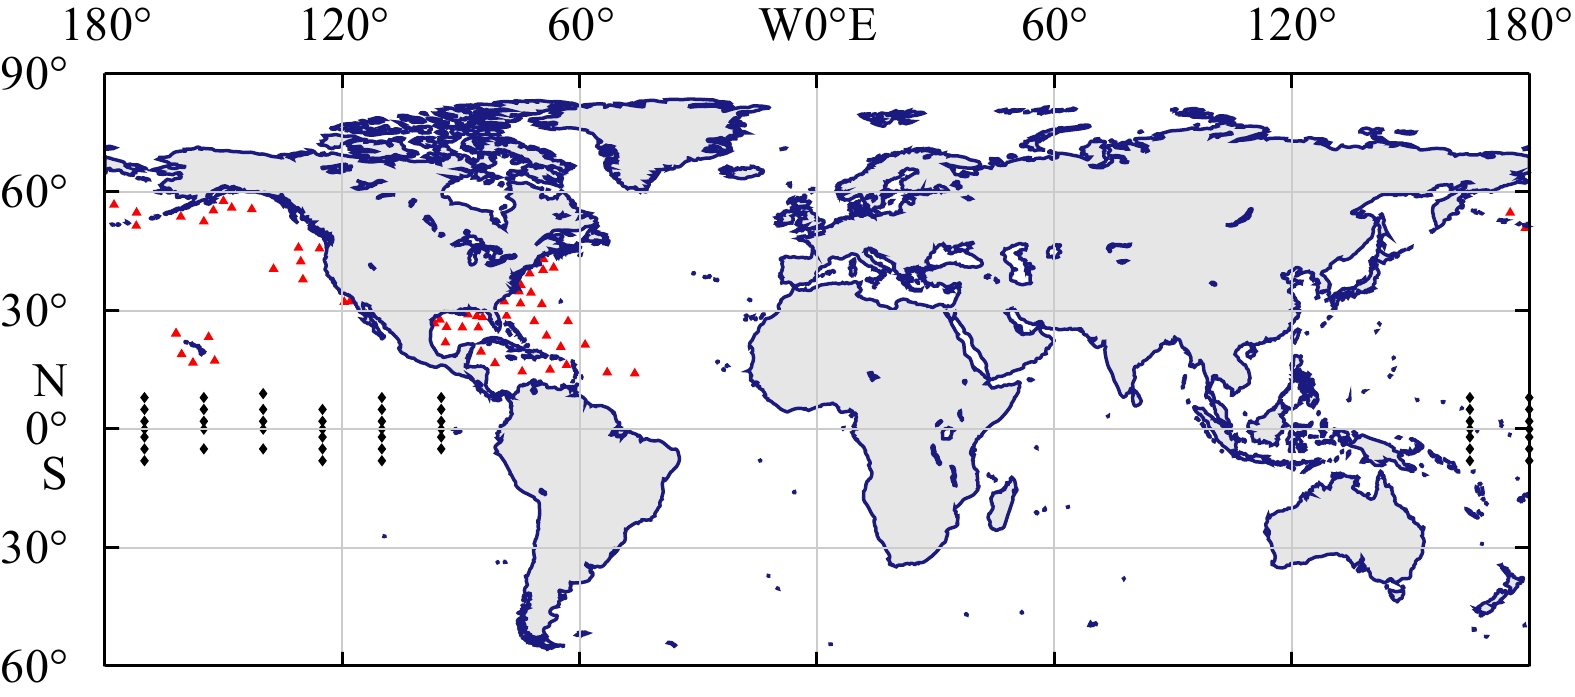
Figure 1. Locations map of the screened NDBC buoys (red triangle) and TAO buoys (black diamond) in this study.
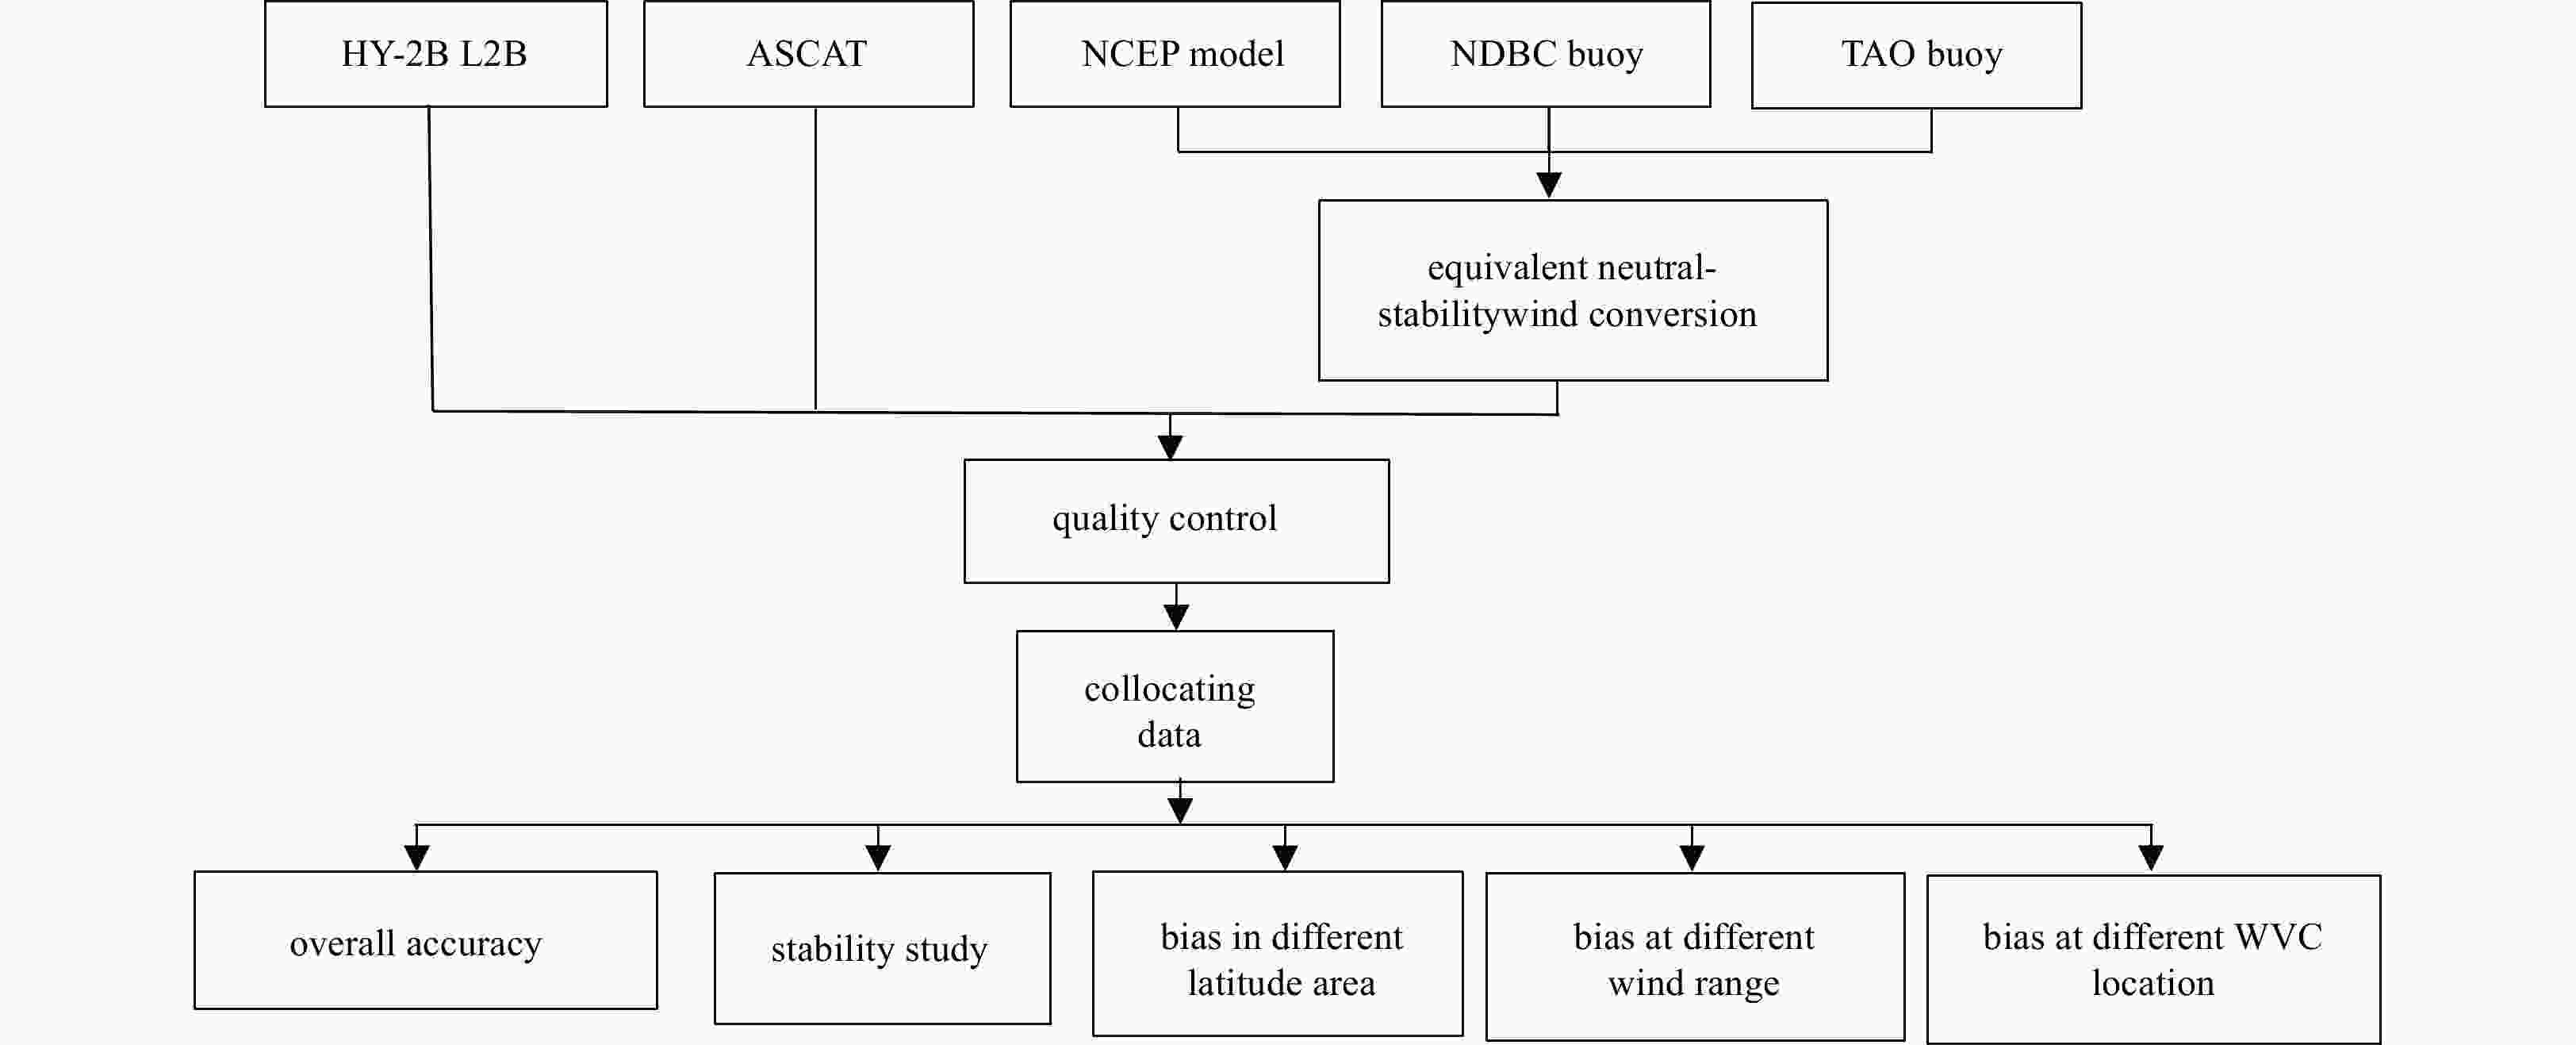
Figure 2. The validation data processing flow for the retrieved winds of the HY-2B scatterometer.
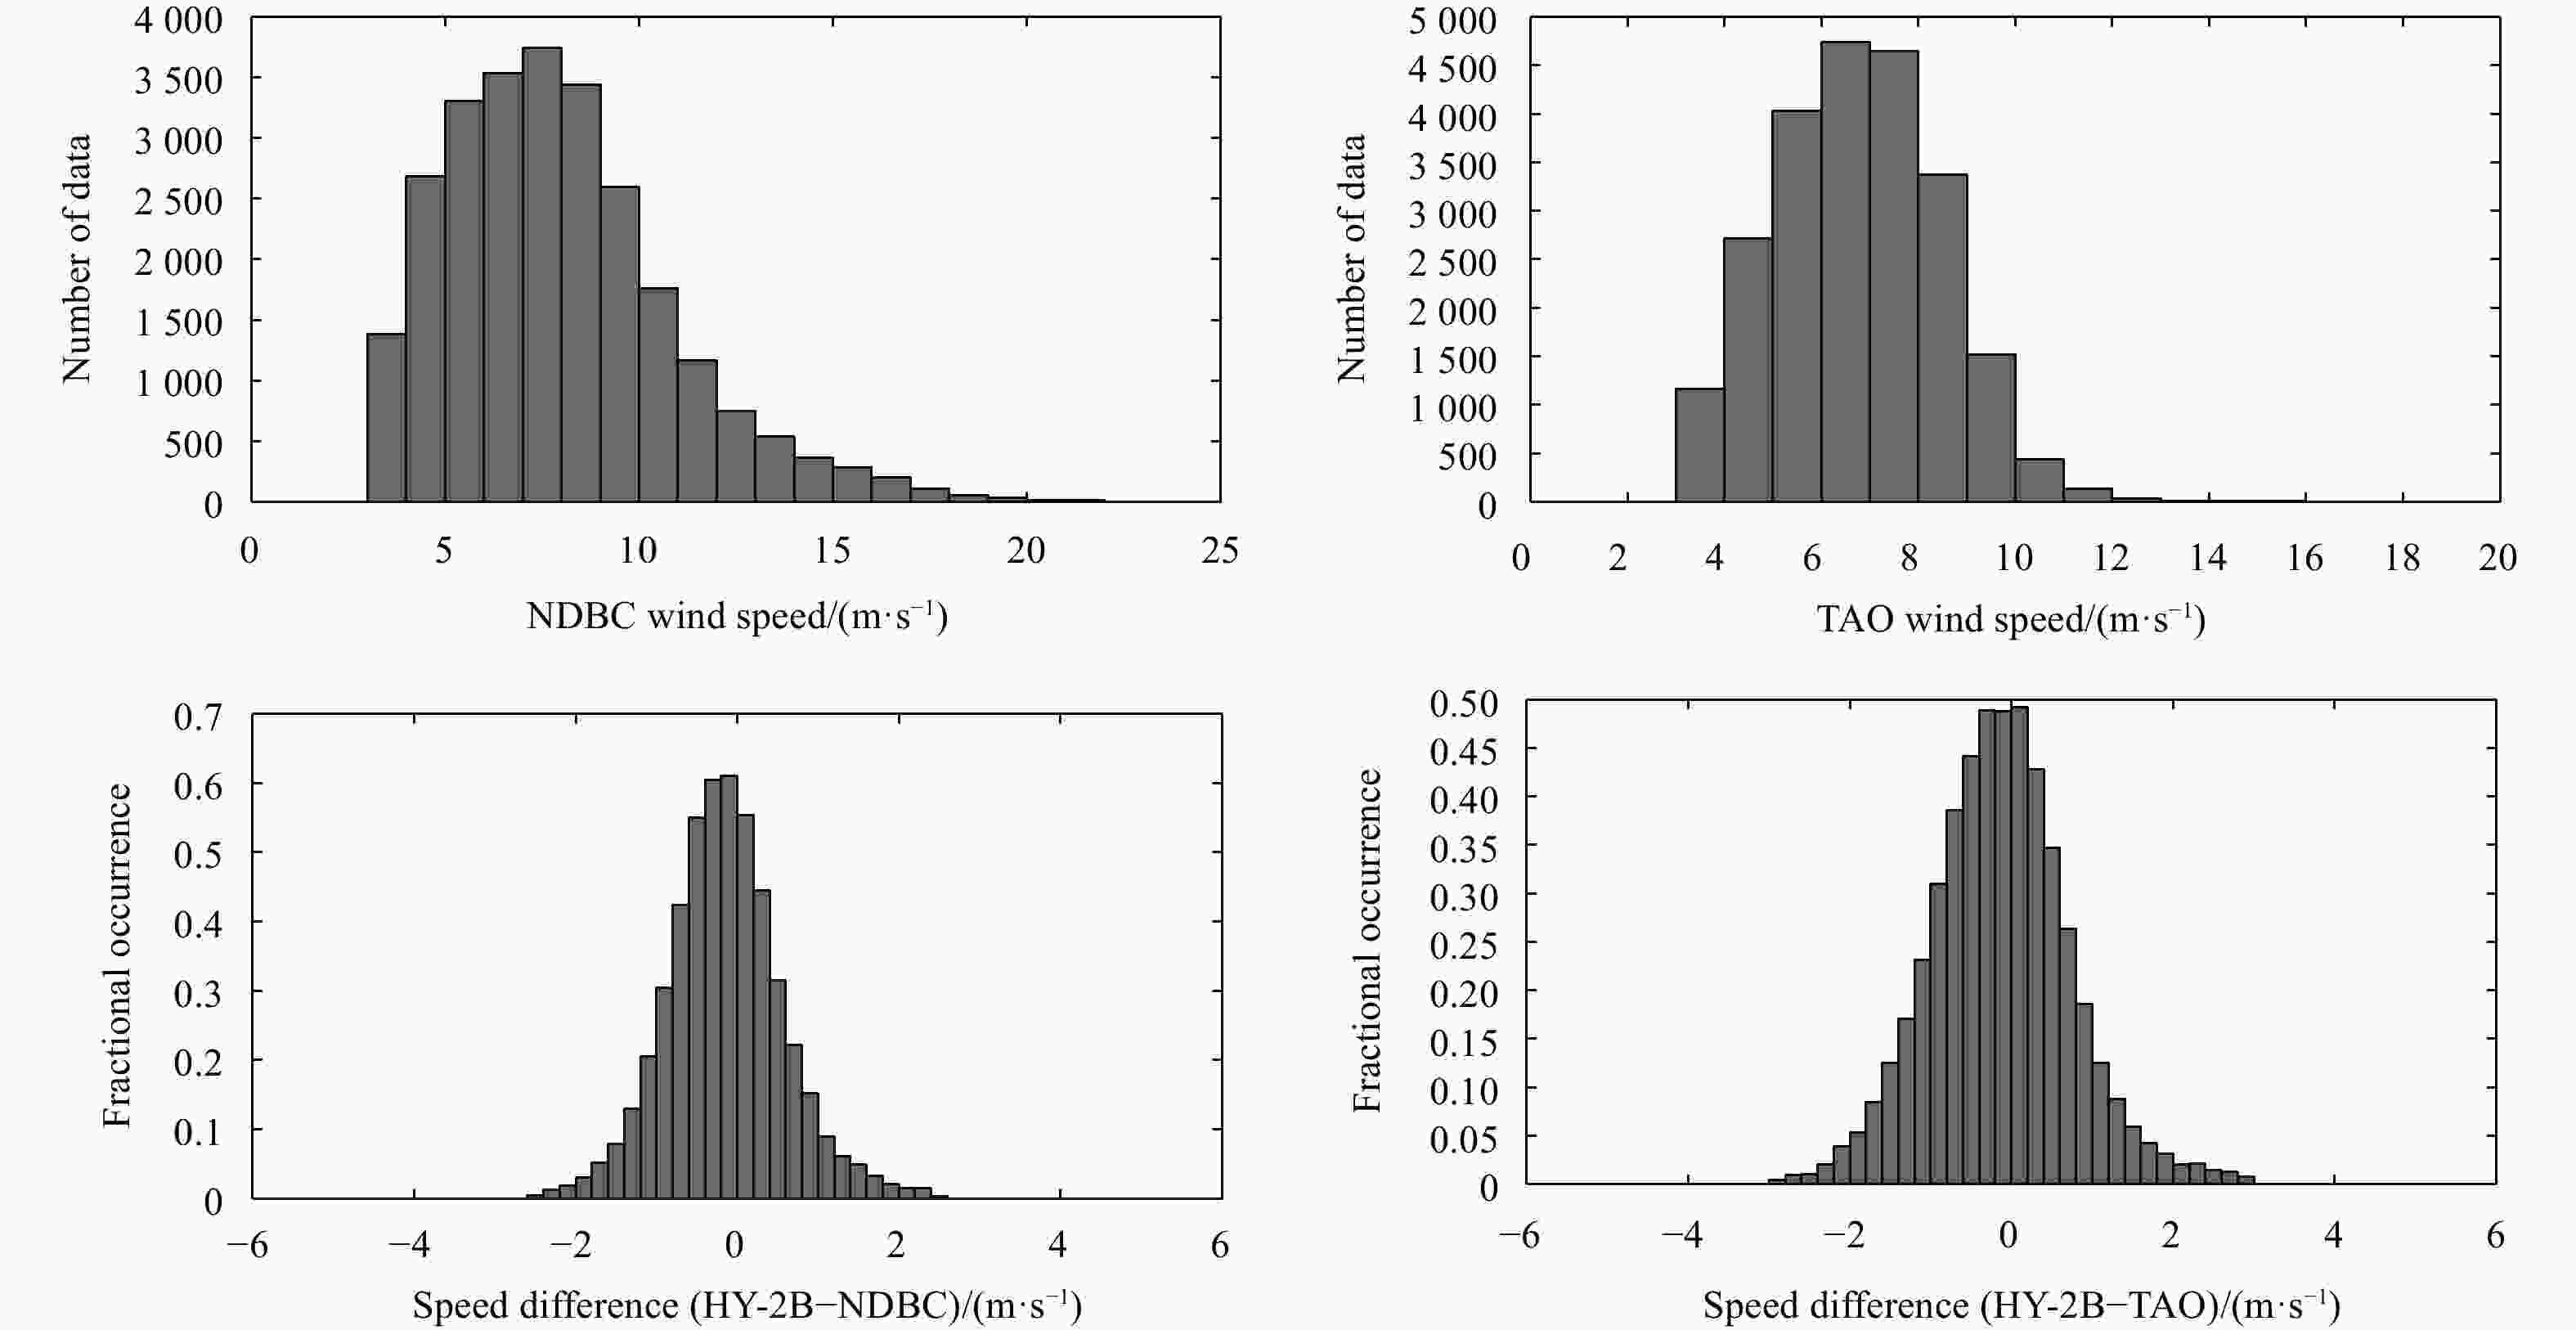
Figure 3. The histogram of the wind speed distribution and deviation for HY-2B compared with NDBC (left) and TAO (right).
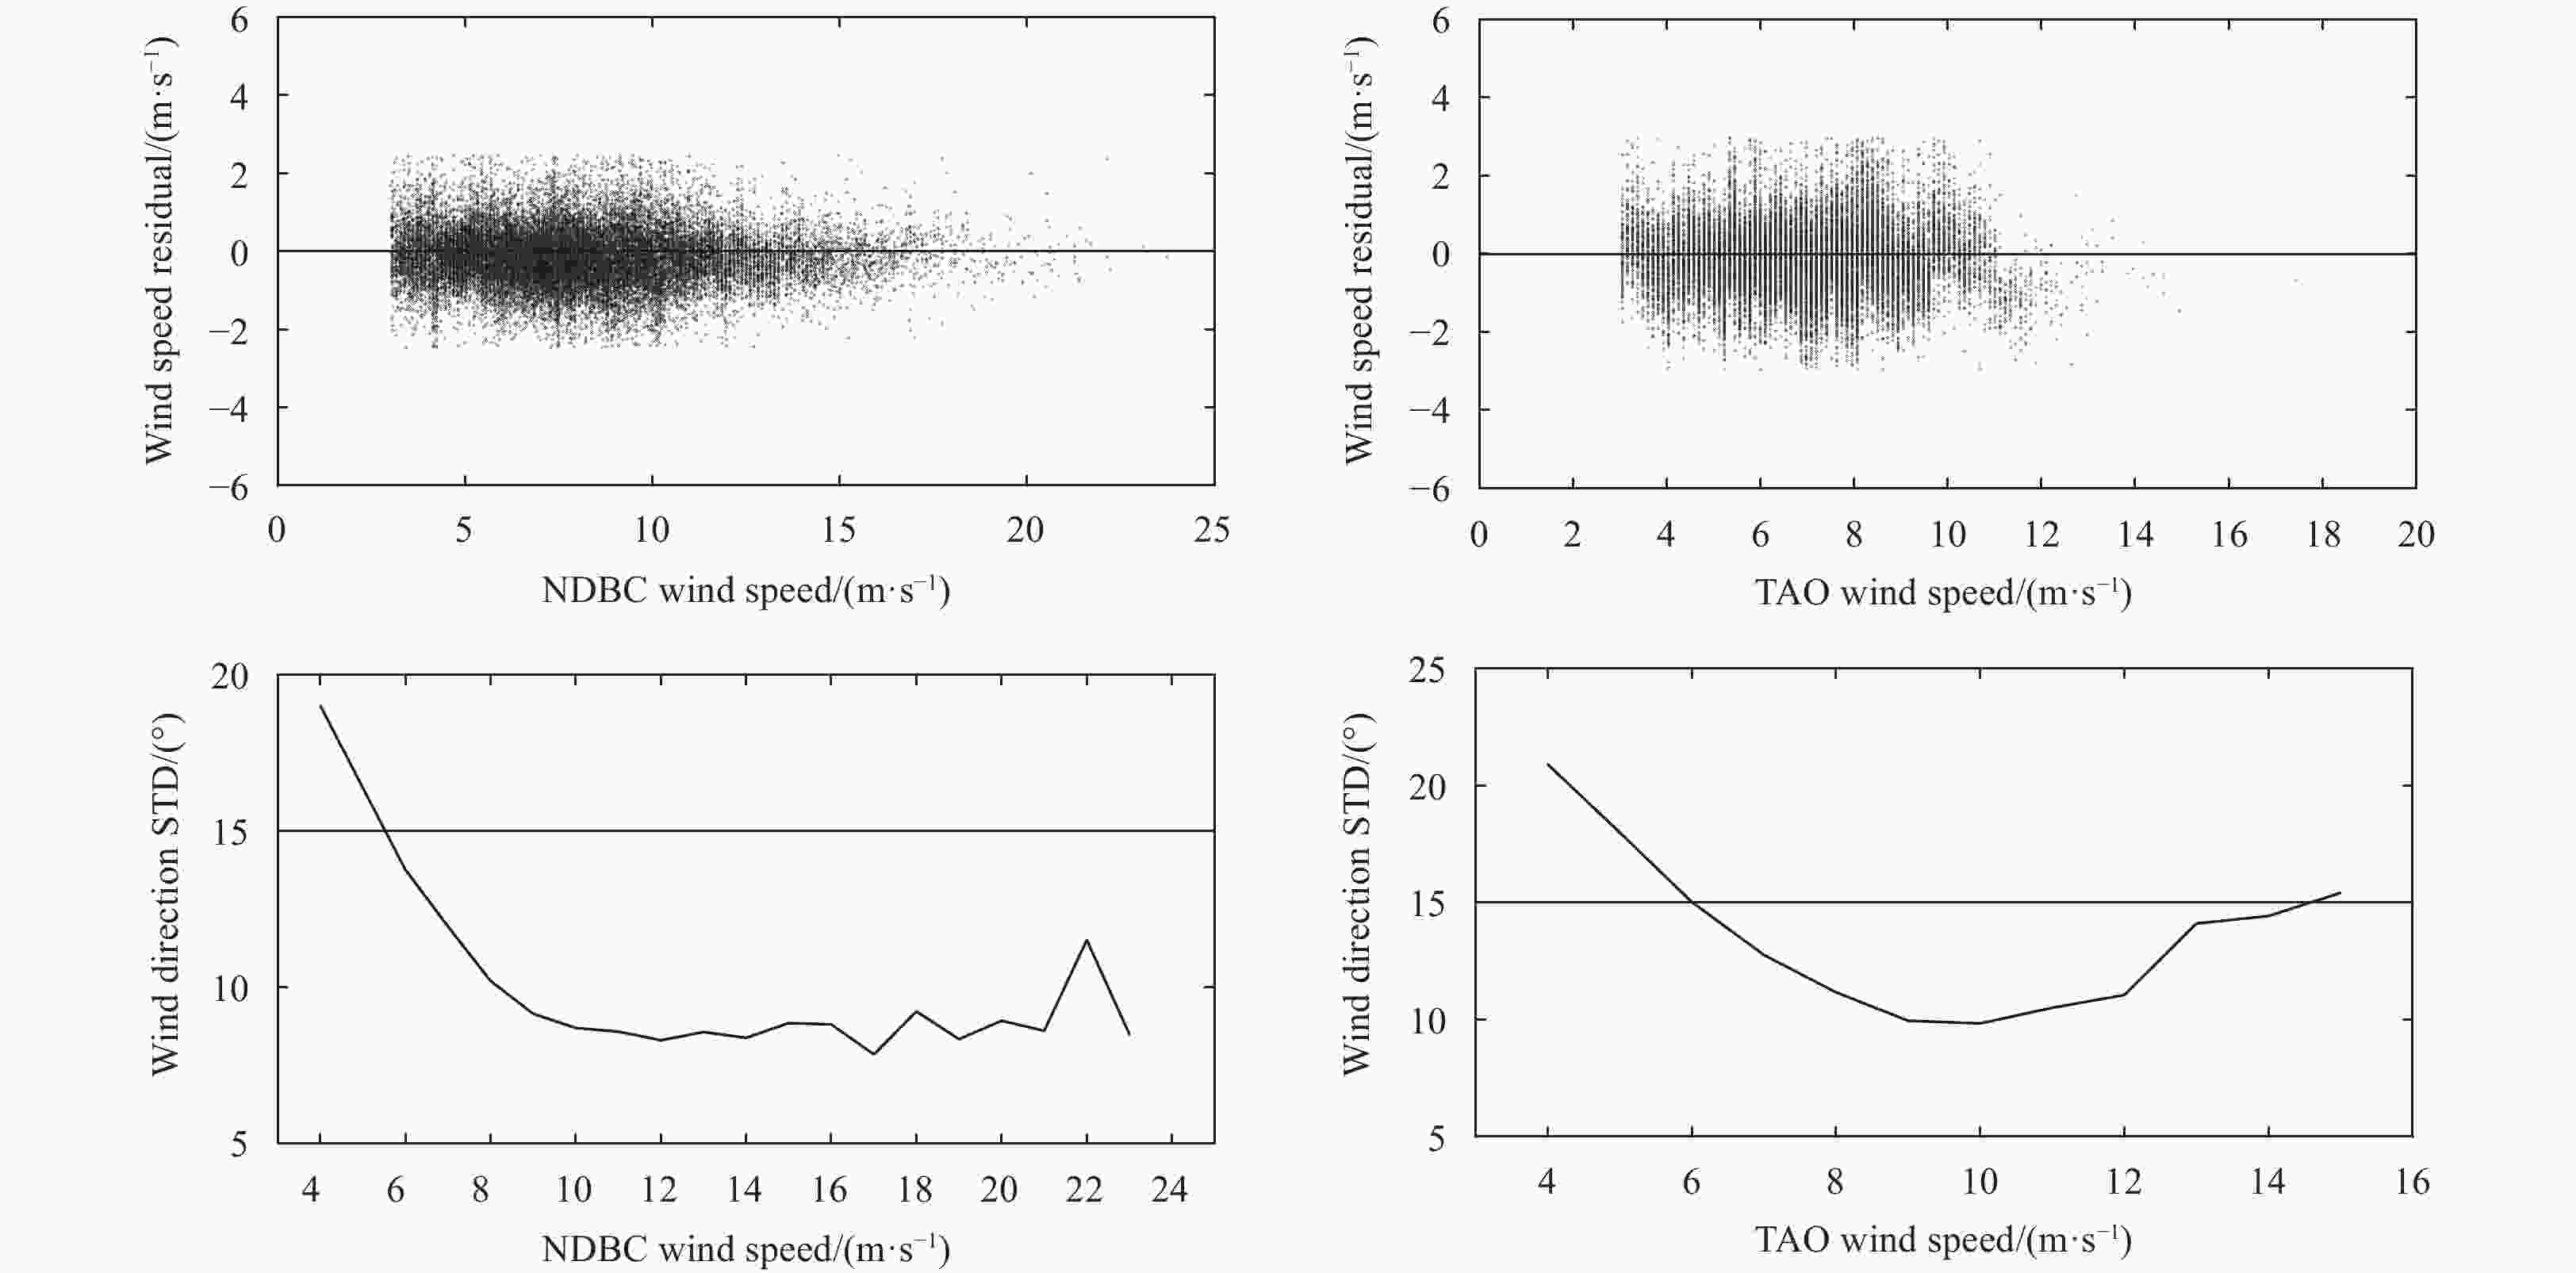
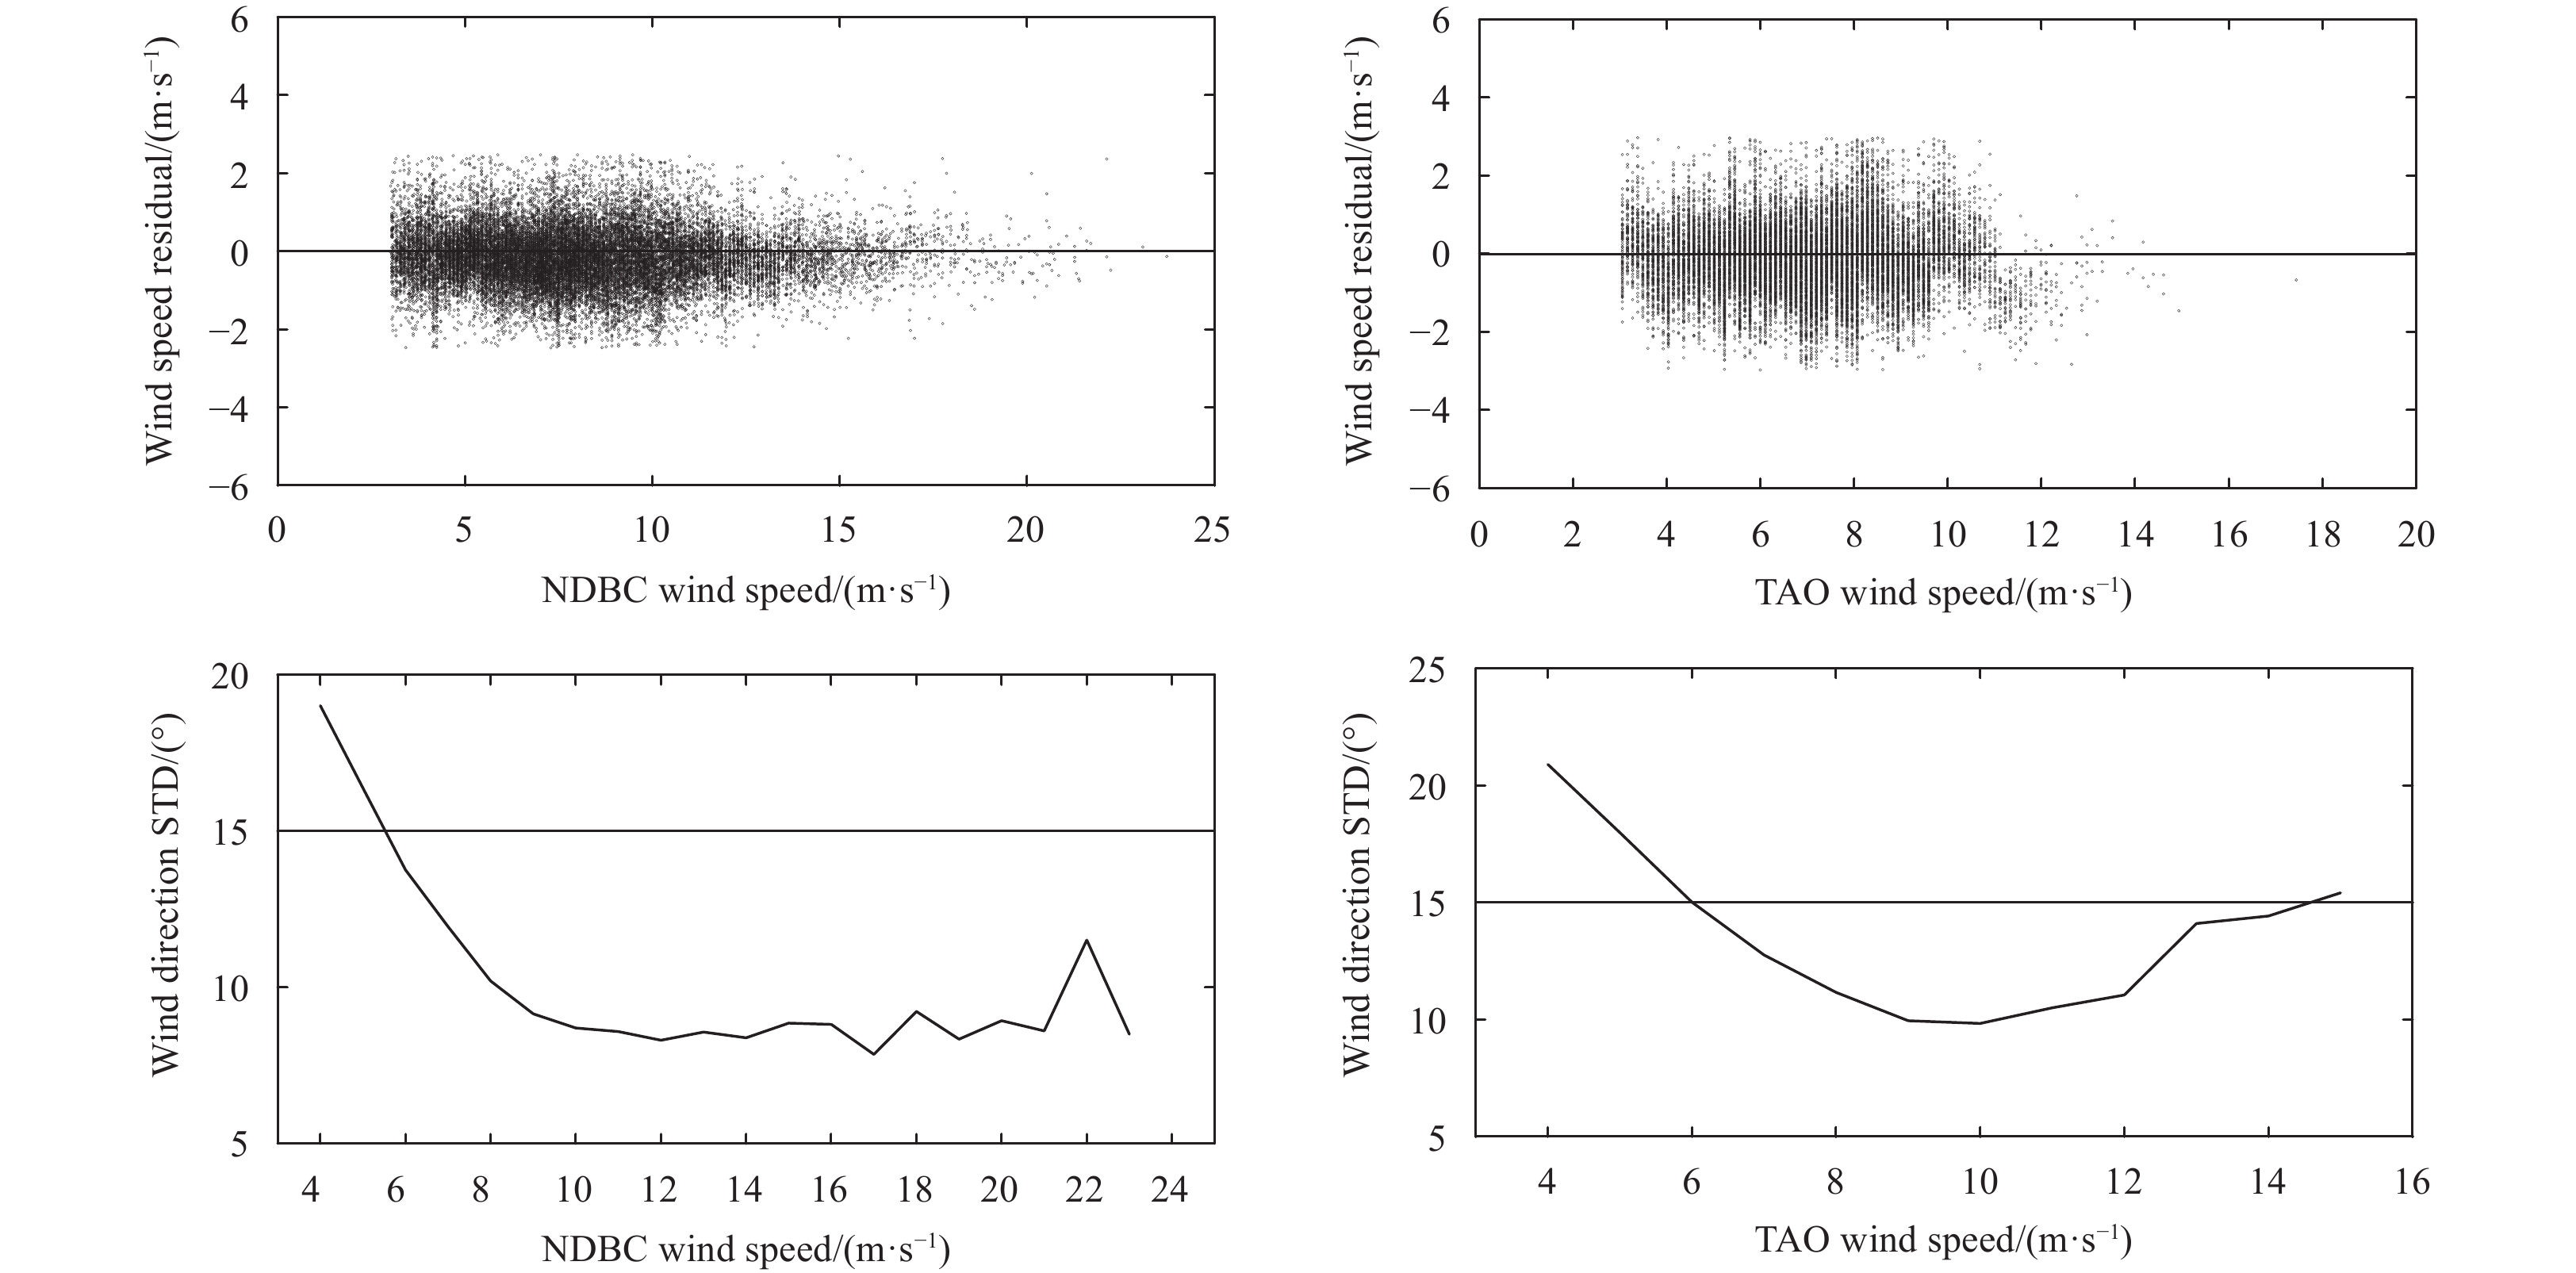
Figure 4. Dependence of wind speed residual (HY-2B-buoy) on the buoy wind speed for the HY-2B winds (upper panel). The STD of the wind direction difference between the HY-2B and NDBC buoys and the TAO buoy as a function of buoy wind speed (lower panel).
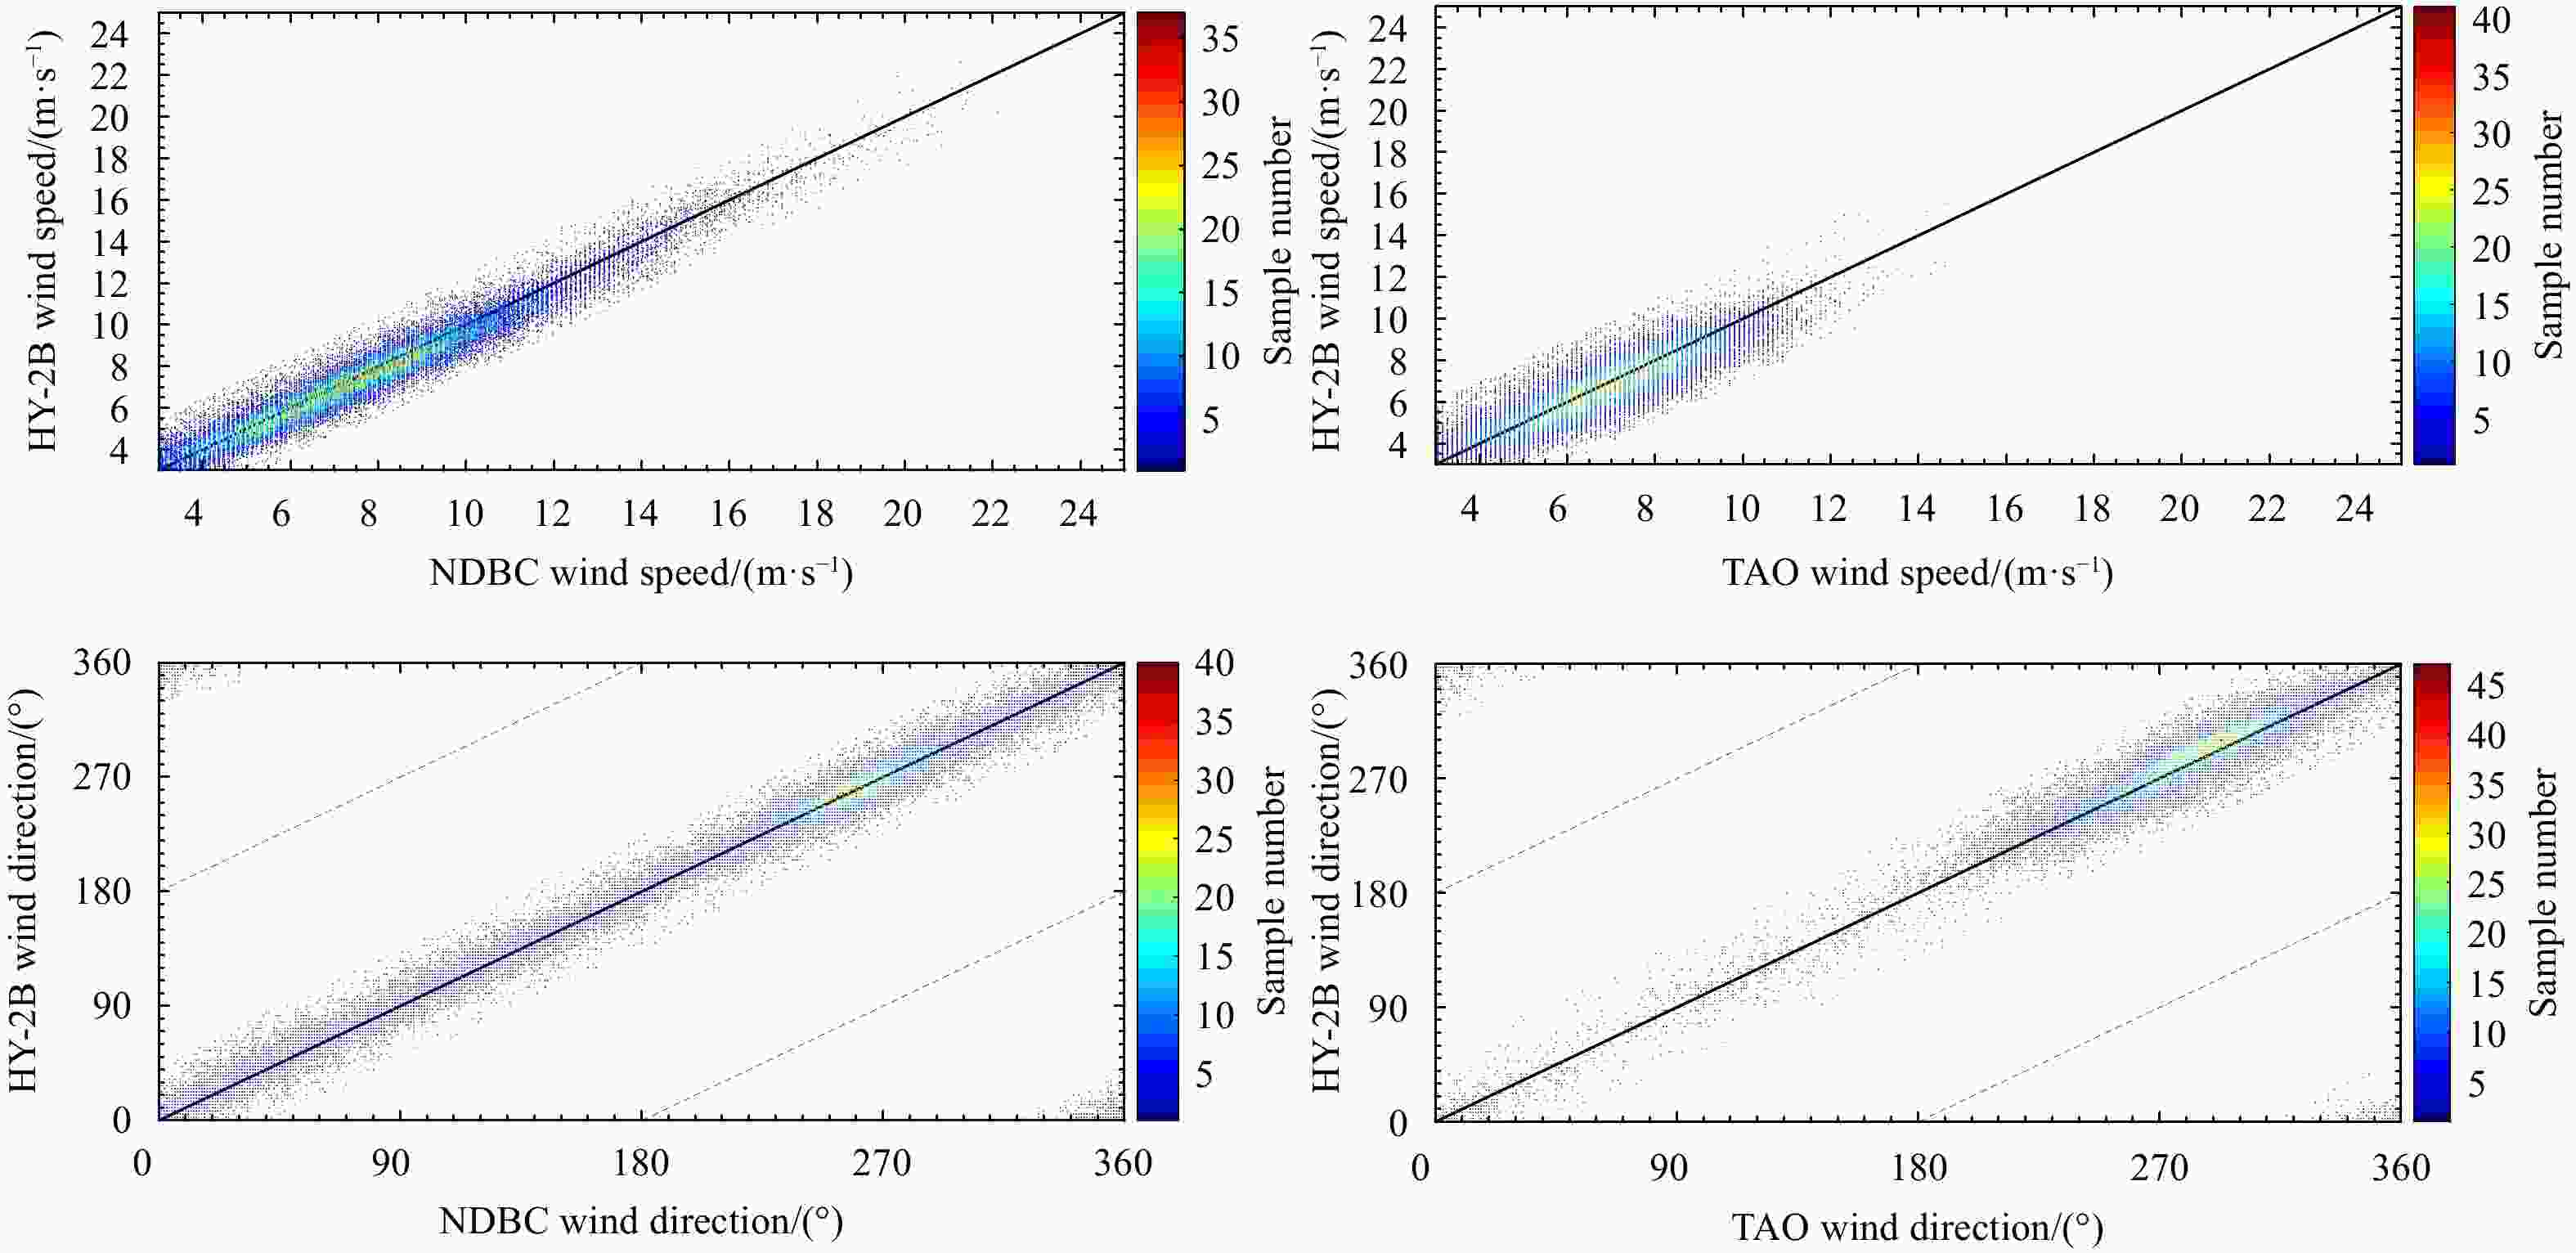
Figure 5. Scatterplots of wind speeds and directions derived from NDBC and HY-2B (left) and from TAO and HY-2B (right).

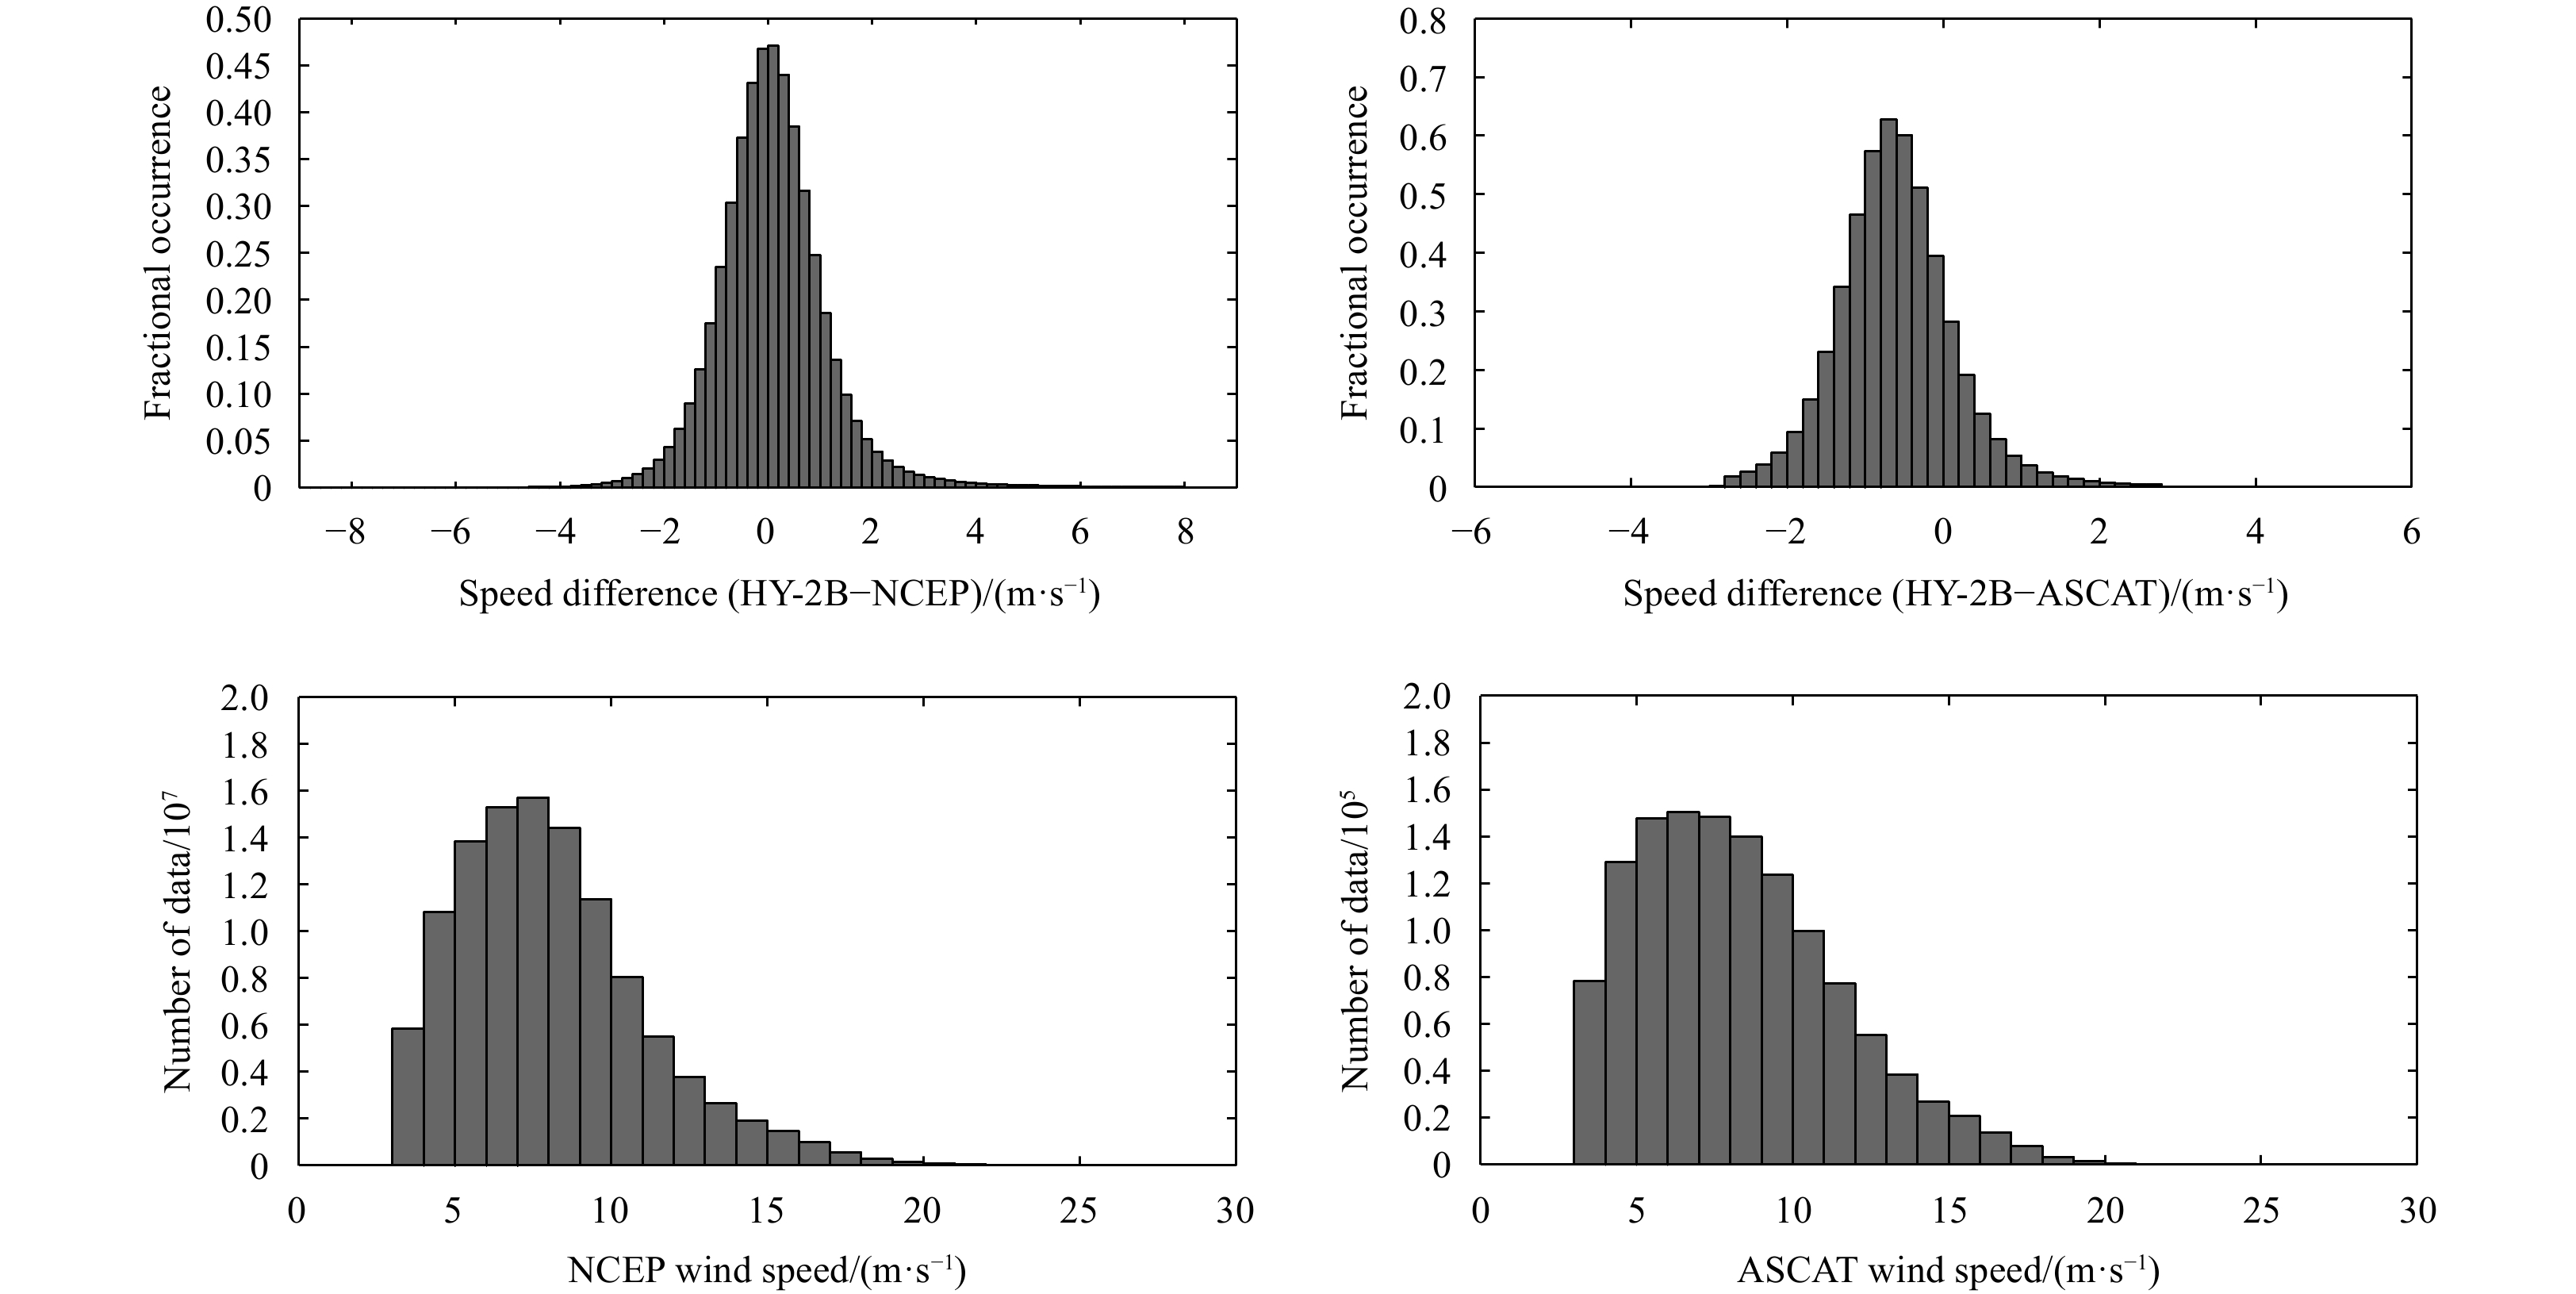
Figure 6. The histogram of the wind speed distribution and deviation for HY-2B compared with NCEP (left) and ASCAT (right).

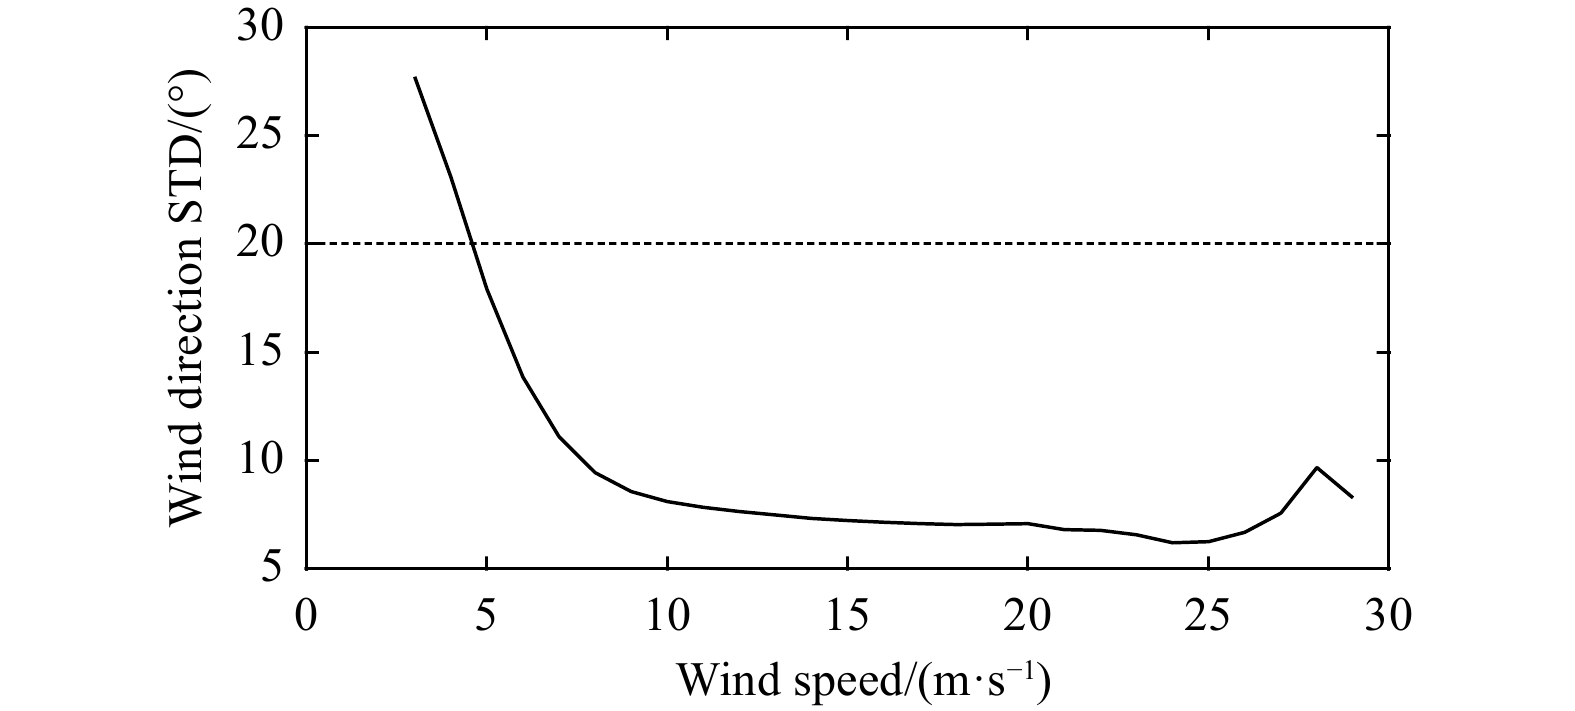
Figure 7. The STD of the wind direction difference between HY-2B and NCEP as a function of NCEP wind speed.
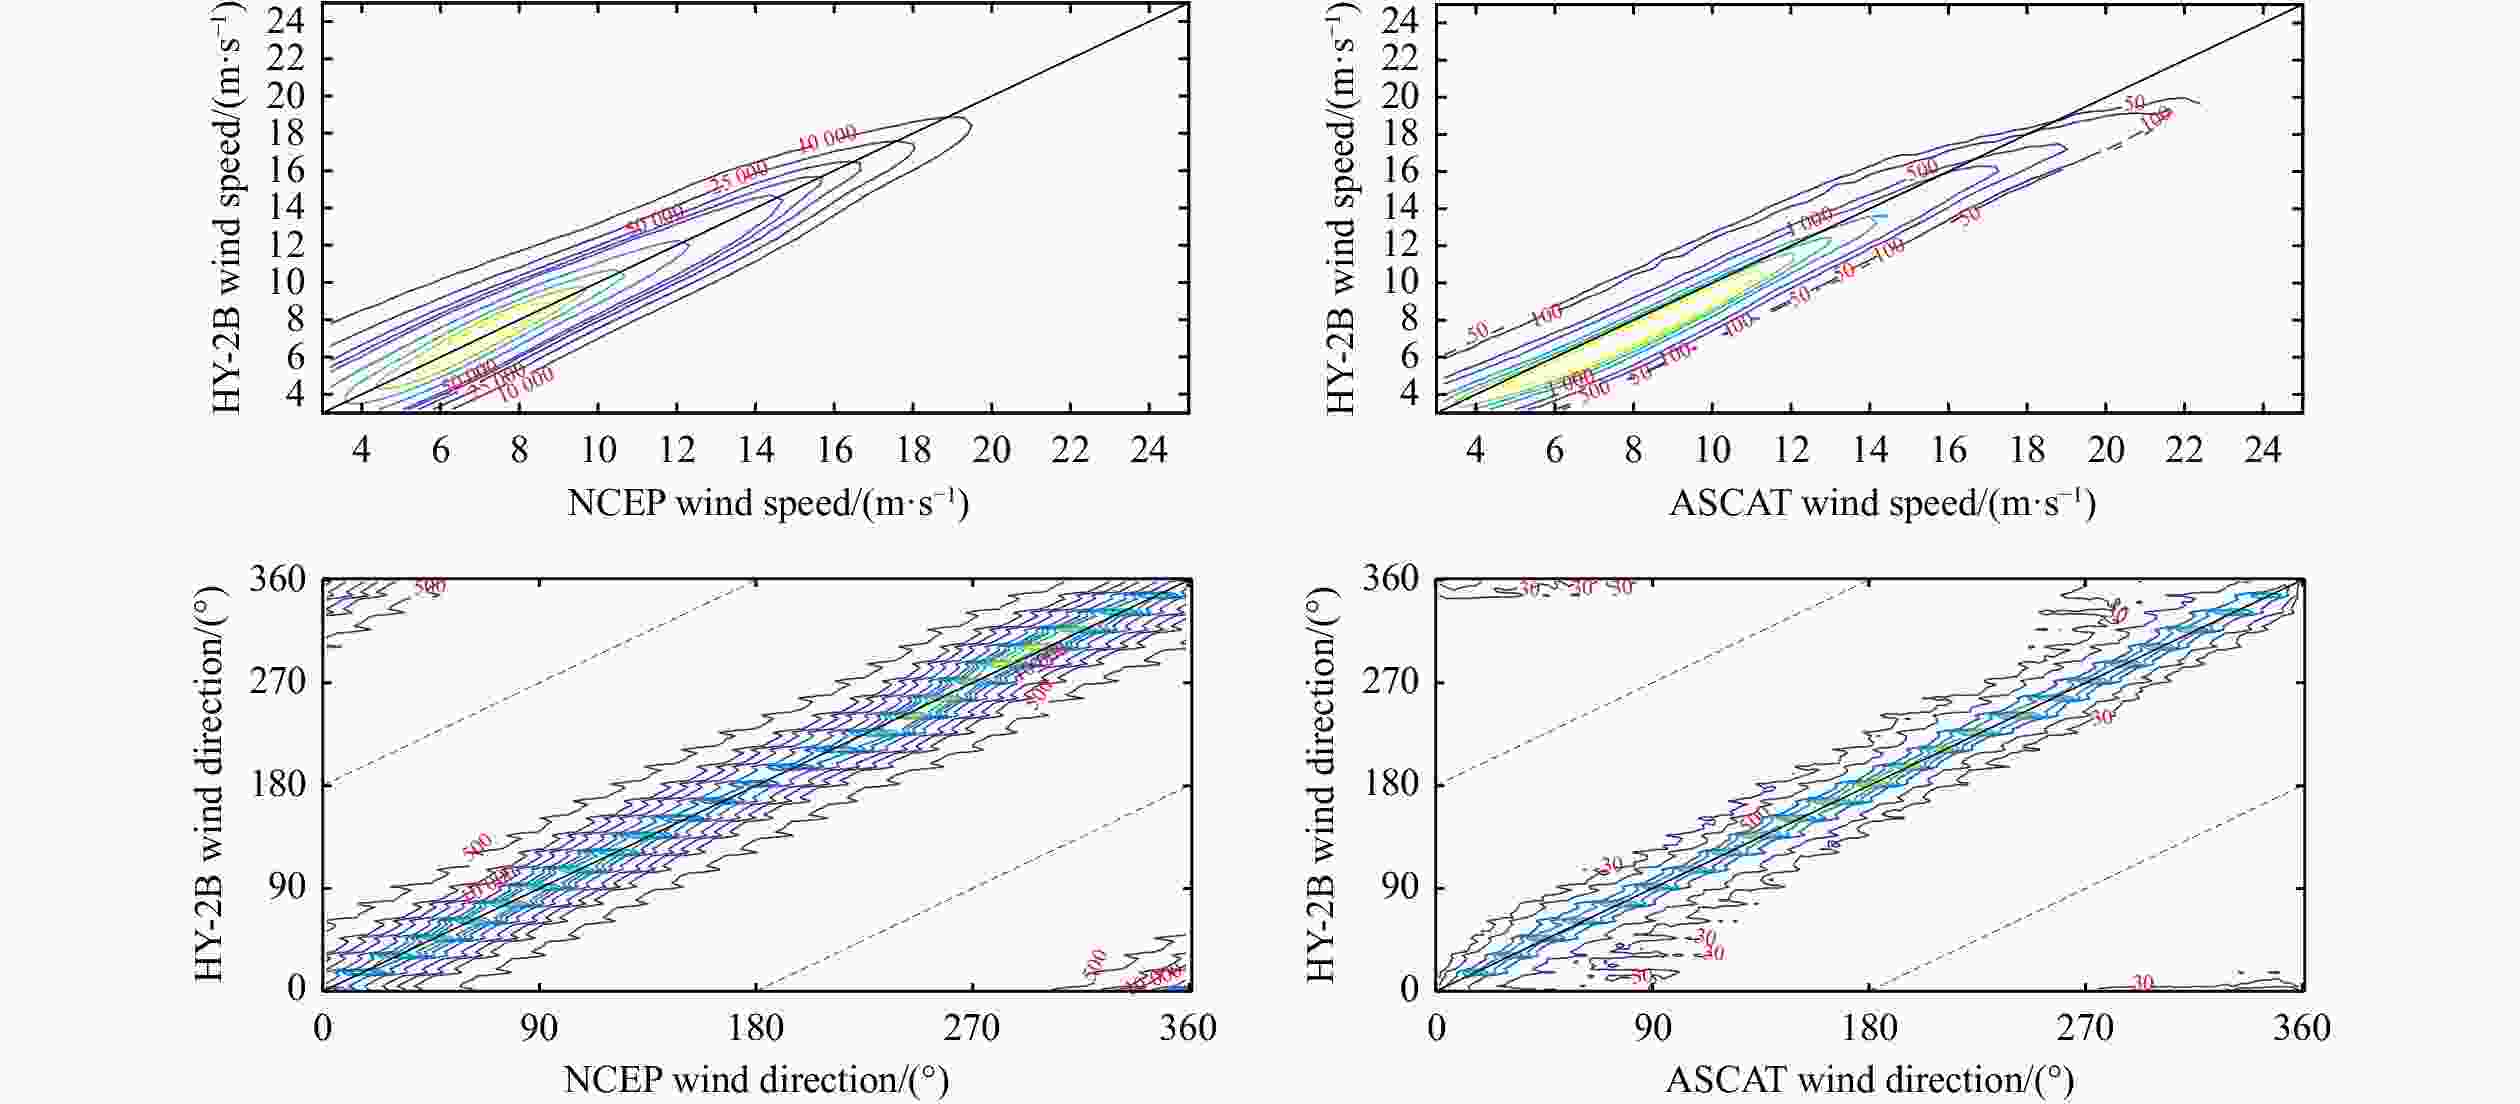
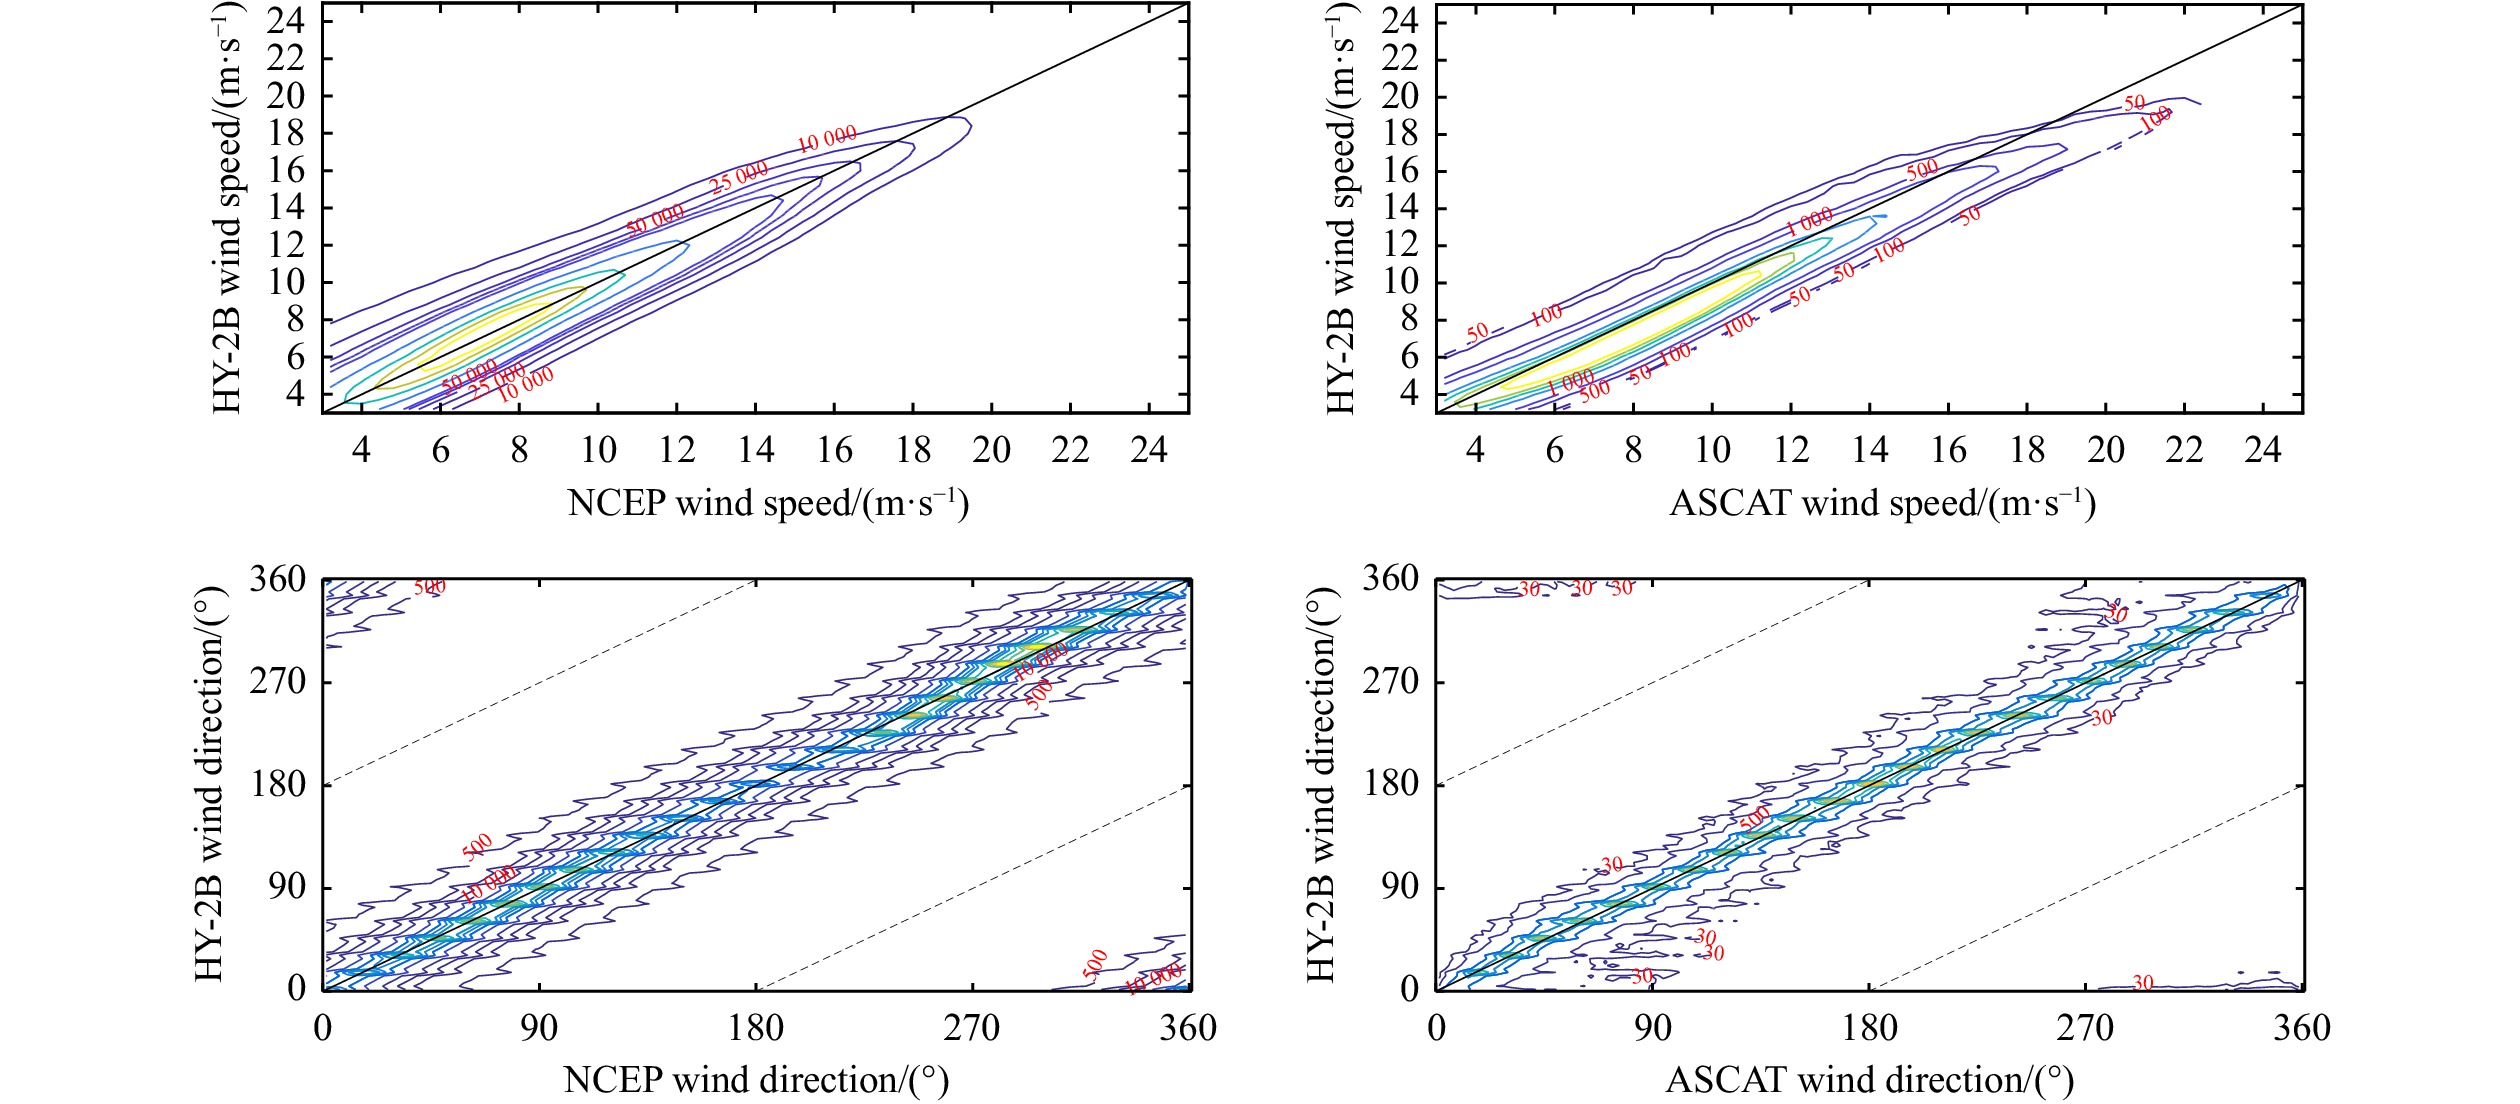
Figure 8. Contours of histograms of wind speeds and directions derived from HY-2B and NCEP (left), HY-2B and ASCAT (right). The red number in the figure indicates the number of samples.

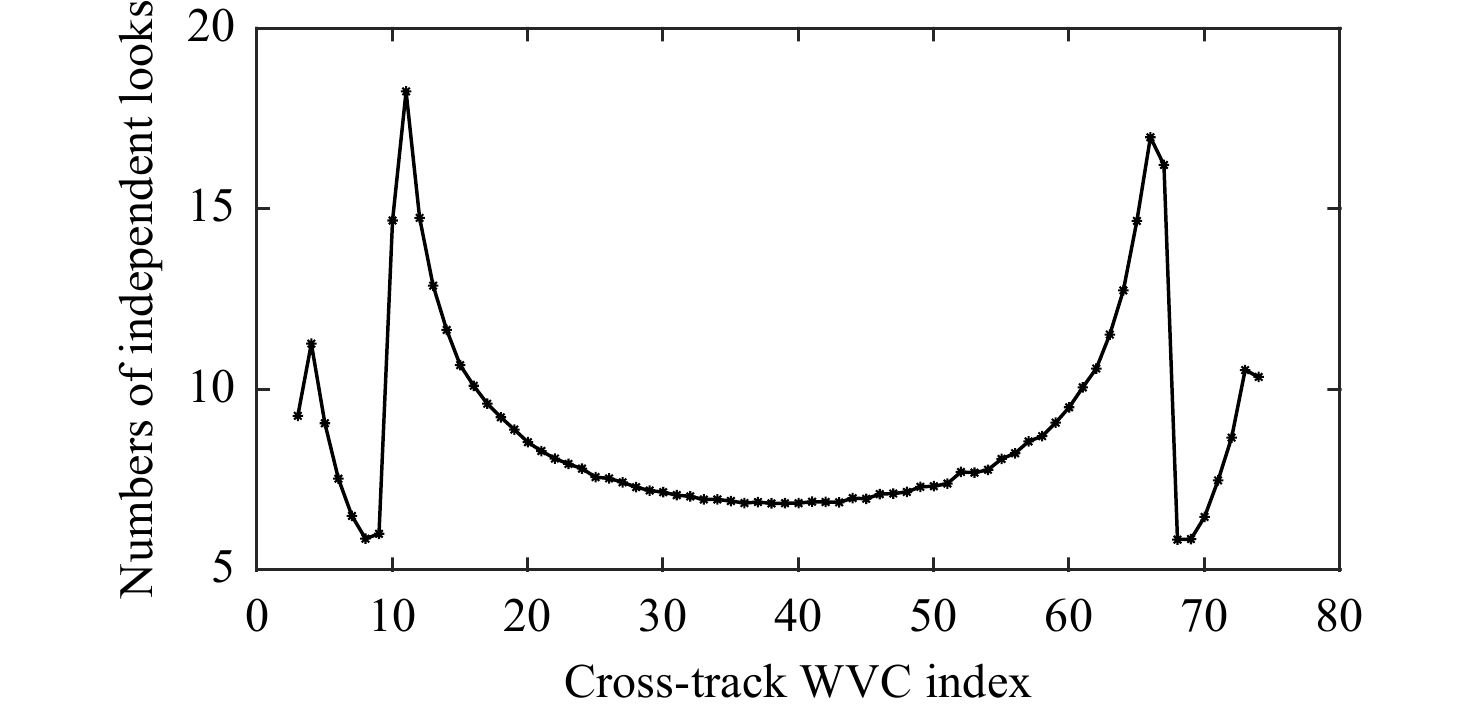
Figure 9. Distributions for total numbers of independent measurements for each wind vector cell (WVC) according to the cross-track WVC index.
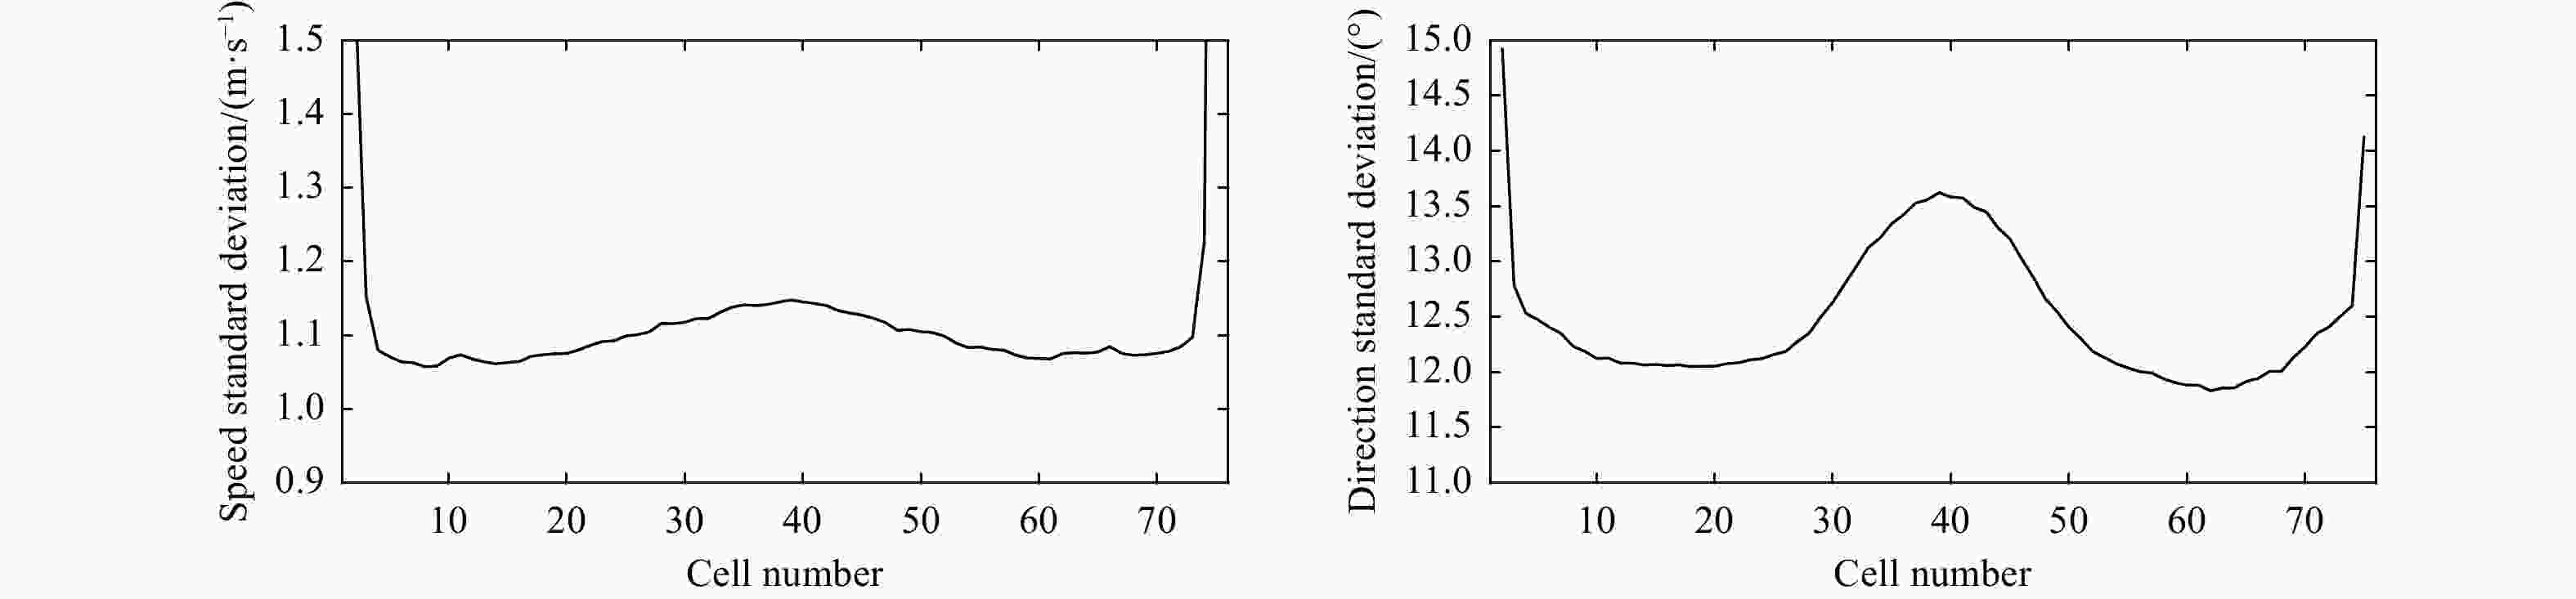
Figure 10. Cross-track variations between HY-2B measurements and spatially and temporally interpolated NCEP wind: STDs of wind speed differences (left), and STDs of wind direction differences (right). Only collocated measurements for which HY-2B and NCEP wind directions differed by less than 90° were considered (see text).
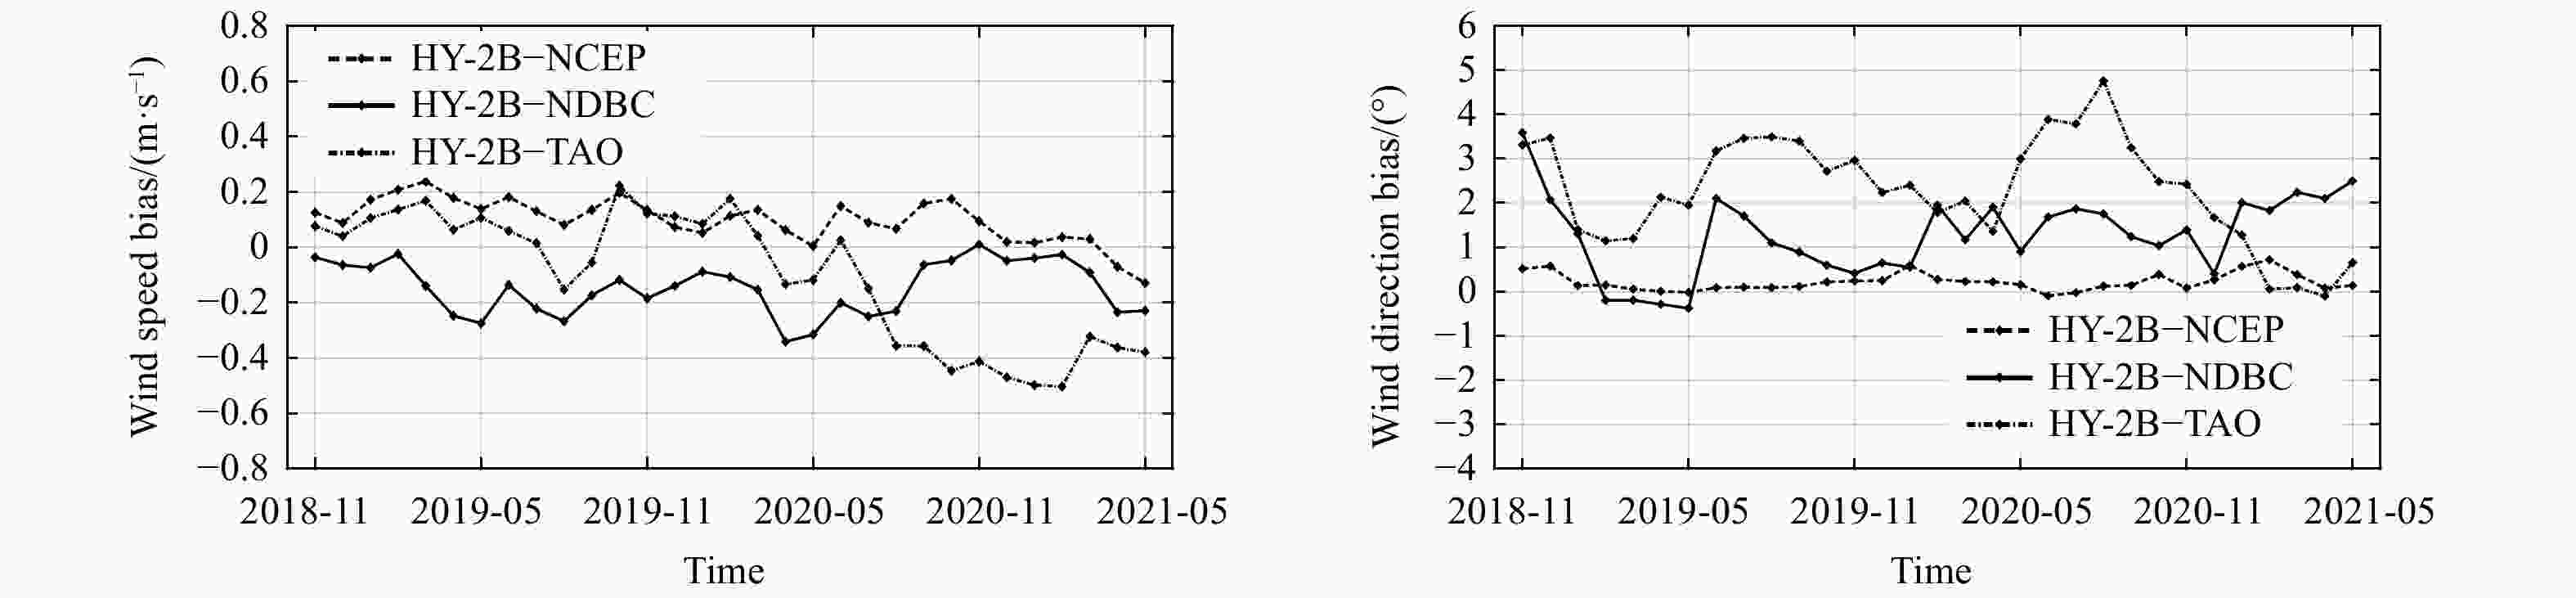
Figure 11. The bias of HY-2B winds versus NCEP winds and buoys from November 2018 to May 2021.
Table 1. Summary of statistics between buoys and HY-2B wind data during November 2018–May 2021
Wind speed/
(m·s−1)Number of data Wind speed Wind direction Bias/(m·s−1) RMSE/(m·s−1) Correlation coefficient Bias/(°) RMSE/(°) Correlation coefficient NDBC 3–10 22 787 −0.13 0.70 0.97 1.24 11.85 0.99 ≥10 3 193 −0.24 0.75 0.90 1.47 7.46 1.00 ≥3 25 980 −0.15 0.74 0.97 1.26 11.74 0.99 TAO 3–10 21 718 −0.13 0.83 0.88 2.17 13.62 0.97 ≥10 1 087 −0.16 0.76 0.59 4.43 11.63 0.93 ≥3 22 805 −0.14 0.88 0.88 2.31 13.64 0.97  下载: 导出CSV
Table 2. Statistics of the comparisons of the HY-2B scatterometer and NCEP wind speeds and directions during November 2018–May 2021
Global Arctic Ocean
60°–90°NNorthern Ocean
10°–60°NTropical Ocean
10°S–10°NSouthern Ocean
10°–60°SAntarctic Ocean
60°–90°SNumber of data 112 674 559 5 584 522 30 374 914 18 026 431 54 033 676 4 655 016 Wind speed Bias/(m·s−1) 0.09 0.24 0.07 0.07 0.05 0.41 RMSE/(m·s−1) 1.10 1.39 0.94 1.03 1.02 1.97 Correlation coefficient 0.93 0.88 0.92 0.85 0.94 0.86 Wind direction Bias/(°) −0.07 −2.04 −2.59 0.41 1.28 0.89 RMSE/(°) 12.45 13.87 12.80 14.17 10.84 15.35 Correlation coefficient 0.99 0.99 0.99 0.99 1.00 0.99
下载: 导出CSV
Table 3. Statistics of the comparisons of the HY-2B scatterometer and ASCAT wind speeds and directions during November 2018–May 2021
Global Arctic Ocean
60°–90°NNorthern Ocean
10°–60°NTropical Ocean
10°S–10°NSouthern Ocean
10°–60°SAntarctic Ocean
60°–90°SNumber of data 1 261 753 1 085 240 11 956 2 232 20 712 141 613 Wind speed Bias/(m·s−1) −0.61 −0.51 0.05 0.13 −0.49 −0.86 RMSE/(m·s−1) 0.96 0.90 1.37 1.29 1.98 1.44 Correlation coefficient 0.97 0.96 0.88 0.79 0.85 0.96 Wind direction Bias/(m·s−1) 0.57 0.72 −1.09 3.43 −1.98 0.47 RMSE/(m·s−1) 15.47 15.19 24.38 22.24 23.78 14.46 Correlation coefficient 0.99 0.99 0.97 0.96 0.95 0.99
下载: 导出CSV
-
Bentamy A, Croize-Fillon D, Perigaud C. 2008. Characterization of ASCAT measurements based on buoy and QuikSCAT wind vector observations. Ocean Science, 4(4): 265–274. doi: 10.5194/os-4-265-2008 Chakraborty A, Kumar R, Stoffelen A. 2013. Validation of ocean surface winds from the OCEANSAT-2 scatterometer using triple collocation. Remote Sensing Letters, 4(1): 84–93. doi: 10.1080/2150704X.2012.693967 Chelton D B, Freilich M H. 2005. Scatterometer-based assessment of 10-m wind analyses from the operational ECMWF and NCEP numerical weather prediction models. Monthly Weather Review, 133(2): 409–429. doi: 10.1175/MWR-2861.1 Chen Kehai, Xie Xuetong, Zhang Jinlan, et al. 2020. Accuracy analysis of the retrieved wind from HY-2B scatterometer. Journal of Tropical Oceanography (in Chinese), 39(6): 30–40 Ebuchi N, Graber H C, Caruso M J. 2002. Evaluation of wind vectors observed by QuikSCAT/SeaWinds using ocean buoy data. Journal of Atmospheric and Oceanic Technology, 19(12): 2049–2062. doi: 10.1175/1520-0426(2002)019<2049:EOWVOB>2.0.CO;2 Freilich M H. 1986. Satellite scatterometer comparisons with surface measurements: techniques and Seasat results. In: Proceedings of an ESA Workshop on ERS-1 Wind and Wave Calibration. Paris: European Space Agency, 57–62 Freilich M H, Dunbar R S. 1999. The accuracy of the NSCAT 1 vector winds: comparisons with national data buoy center buoys. Journal of Geophysical Research: Oceans, 104(C5): 11231–11246. doi: 10.1029/1998JC900091 Isaksen L, Stoffelen A. 2000. ERS scatterometer wind data impact on ECMWF’s tropical cyclone forecasts. IEEE Transactions on Geoscience and Remote Sensing, 38(4): 1885–1892. doi: 10.1109/36.851771 Li Dawei, Shen Hui. 2015. Evaluation of wind vectors observed by HY-2A scatterometer using ocean buoy observations, ASCAT measurements, and numerical model data. Chinese Journal of Oceanology and Limnology, 33(5): 1191–1200. doi: 10.1007/s00343-015-4136-4 Liu W T, Tang Wenqing. 1996. Equivalent neutral wind. Pasadena, CA: California Institute of Technology Mu Bo, Lin Mingsen, Peng Hailong, et al. 2014. Validation of wind vectors retrieved by the HY–2 microwave scatterometer using NCEP model data. Engineering Sciences (in Chinese), 16(6): 39–45 Stoffelen A. 1998. Toward the true near-surface wind speed: error modeling and calibration using triple collocation. Journal of Geophysical Research: Oceans, 103(C4): 7755–7766. doi: 10.1029/97JC03180 Stoffelen A, van Beukering P. 1997. The impact of improved scatterometer winds on HIRLAM analyses and forecasts. Delft: IMET Verhoef A, Stoffelen A. 2012. Quality control of ku-band scatterometer winds. Darmstadt: EUMETSAT Wang Zhixiong, Stoffelen A, Zou Juhong, et al. 2020. Validation of new sea surface wind products from scatterometers onboard the HY-2B and MetOp-C satellites. IEEE Transactions on Geoscience and Remote Sensing, 58(6): 4387–4394. doi: 10.1109/TGRS.2019.2963690 Wang He, Zhu Jianhua, Lin Mingsen, et al. 2013. First six months quality assessment of HY-2A SCAT wind products using in situ measurements. Acta Oceanologica Sinica, 32(11): 27–33. doi: 10.1007/s13131-013-0374-5 Wentz F J. 1990. SBIR phase II report: west coast storm forecasting with SSM/I. Santa Rosa: Remote Sensing Systems Yang Jungang, Zhang Jie. 2019. Accuracy assessment of HY-2A scatterometer wind measurements during 2011–2017 by comparison with buoys, ASCAT, and ERA-interim data. IEEE Geoscience and Remote Sensing Letters, 16(5): 727–731. doi: 10.1109/LGRS.2018.2879909 Zhu Jintai, Dong Xiaolong, Yun Risheng. 2014. Calibration and validation of the HY-2 scatterometer backscatter measurements over ocean. In: 2014 IEEE Geoscience and Remote Sensing Symposium. Quebec City, Canada: IEEE, 4382–4385 -


 点击查看大图
计量
- 文章访问数: 299
- HTML全文浏览量: 116
- PDF下载量: 17
- 被引次数: 0

