

Construction and analysis of a coral reef trophic network for Qilianyu Islands, Xisha Islands
-
Abstract: Qilianyu Islands coral reefs (QICR), located in the northeastern part of the South China Sea, has been affected by human activities and natural disturbance. To characterize the trophic structure, ecosystem properties and keystone species of this region, a food-web model for the QICR is developed using methods involving a mass-balance approach with Ecopath with Ecosim software. Trophic levels range from 1.00 for detritus and primary producers to 3.80 for chondrichthyes. The mean trophic transfer efficiency for the entire ecosystem is 13.15%, with 55% of total energy flow originating from primary producers. A mixed trophic impact analysis indicates that coral strongly impacts most components of this ecosystem. A comparison of our QICR model with that for other coral reef ecosystems suggests that the QICR ecosystem is immature and/or is degraded.
-
Key words:
- South China Sea /
- Qilianyu Islands /
- coral reef /
- Ecopath model /
- food webs /
- ecosystem characteristic
-
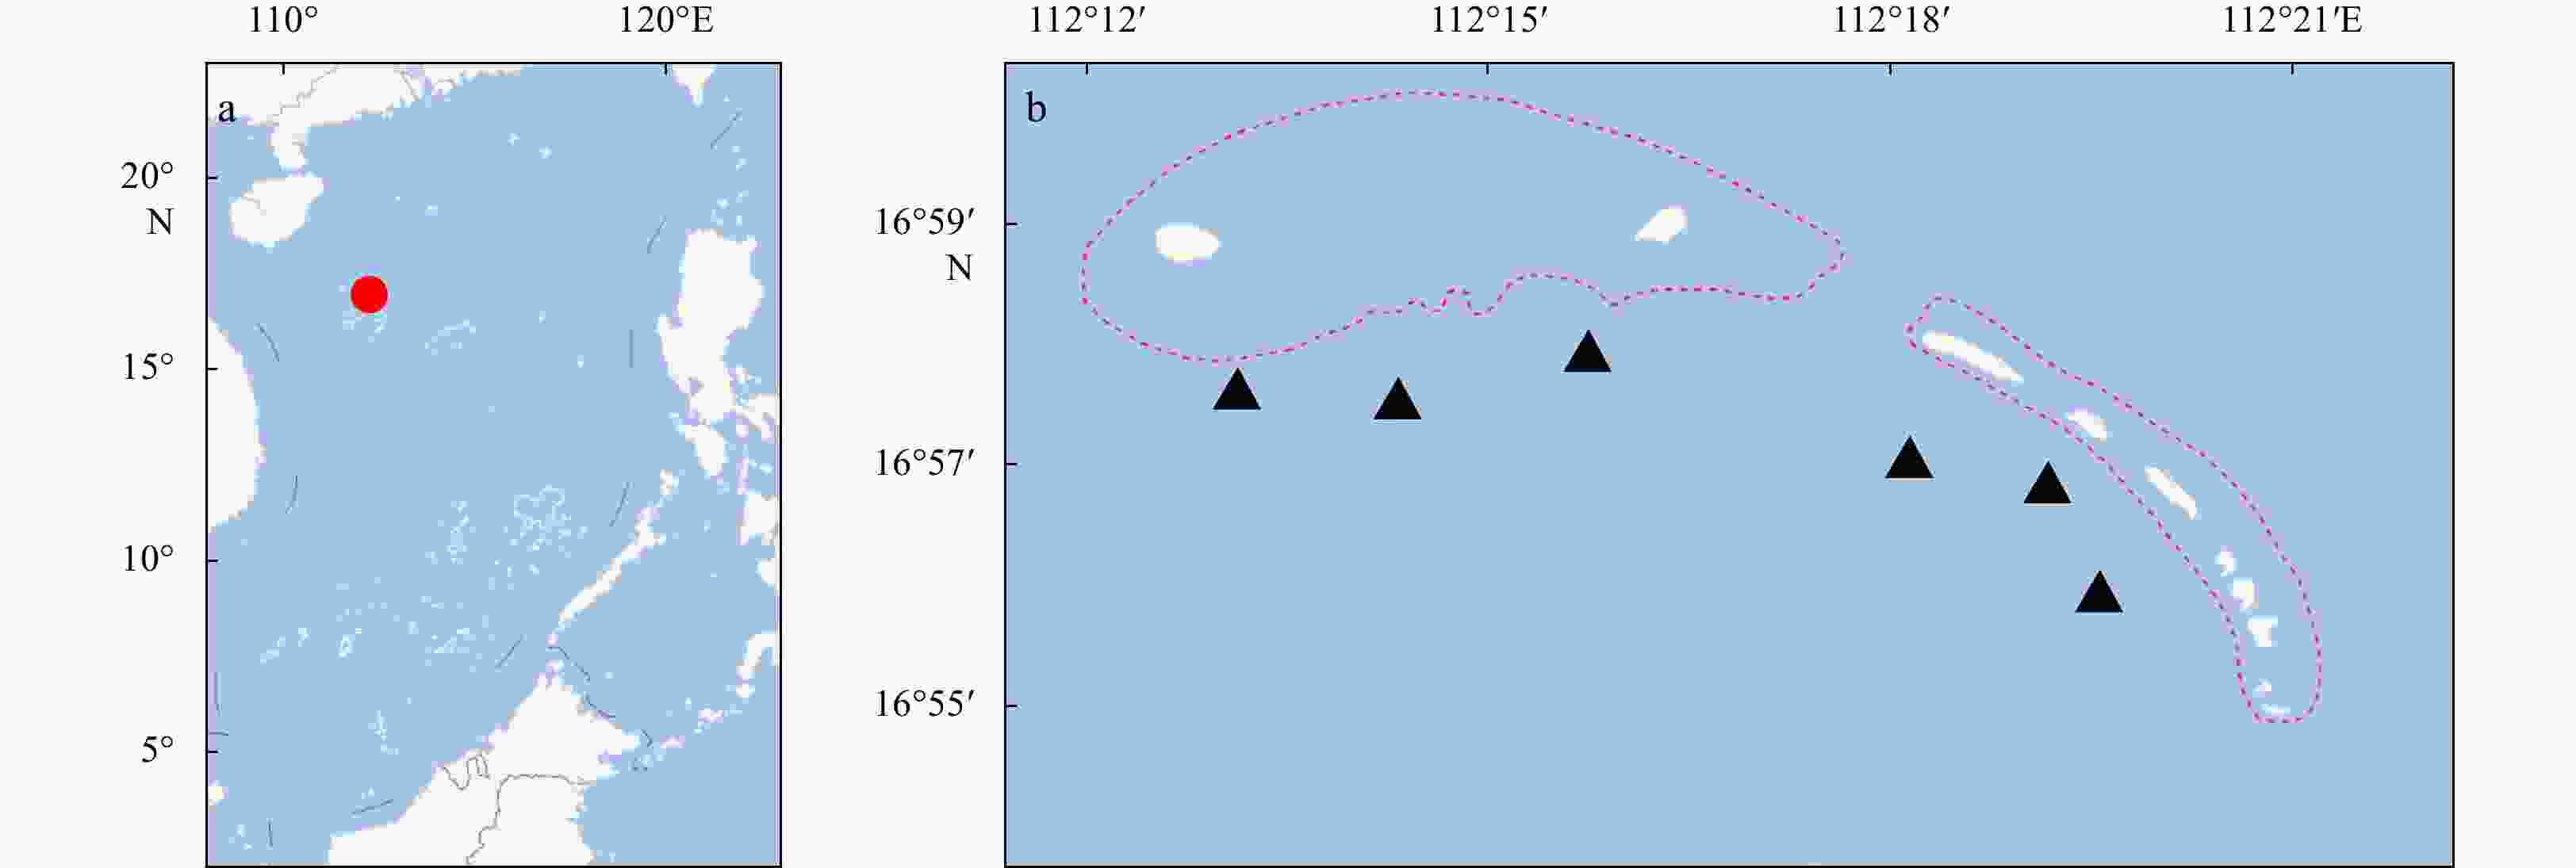
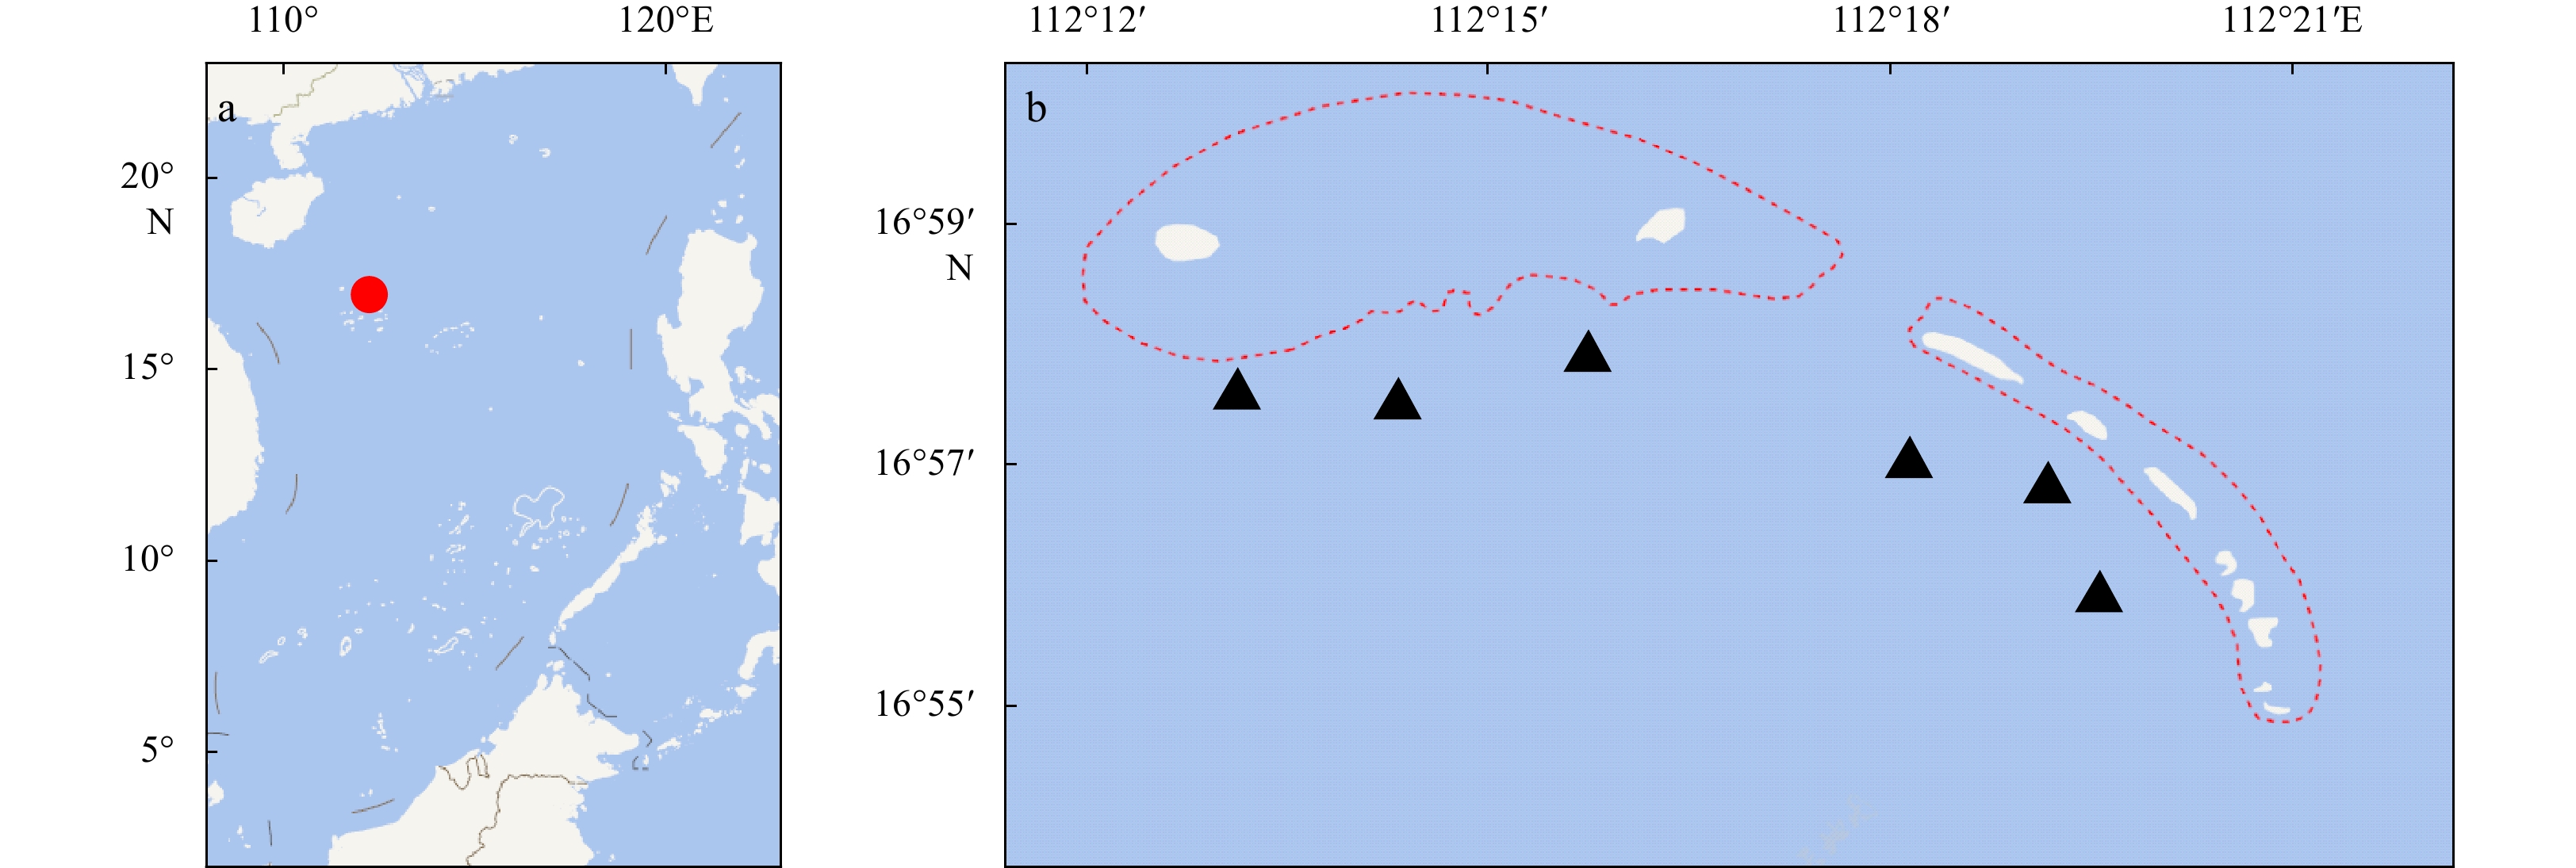
Figure 1. The study area (a) and the locations of the sampling stations (b). Black triangle markers are the sampling stations; red dotted lines represent the rang of table reefs.
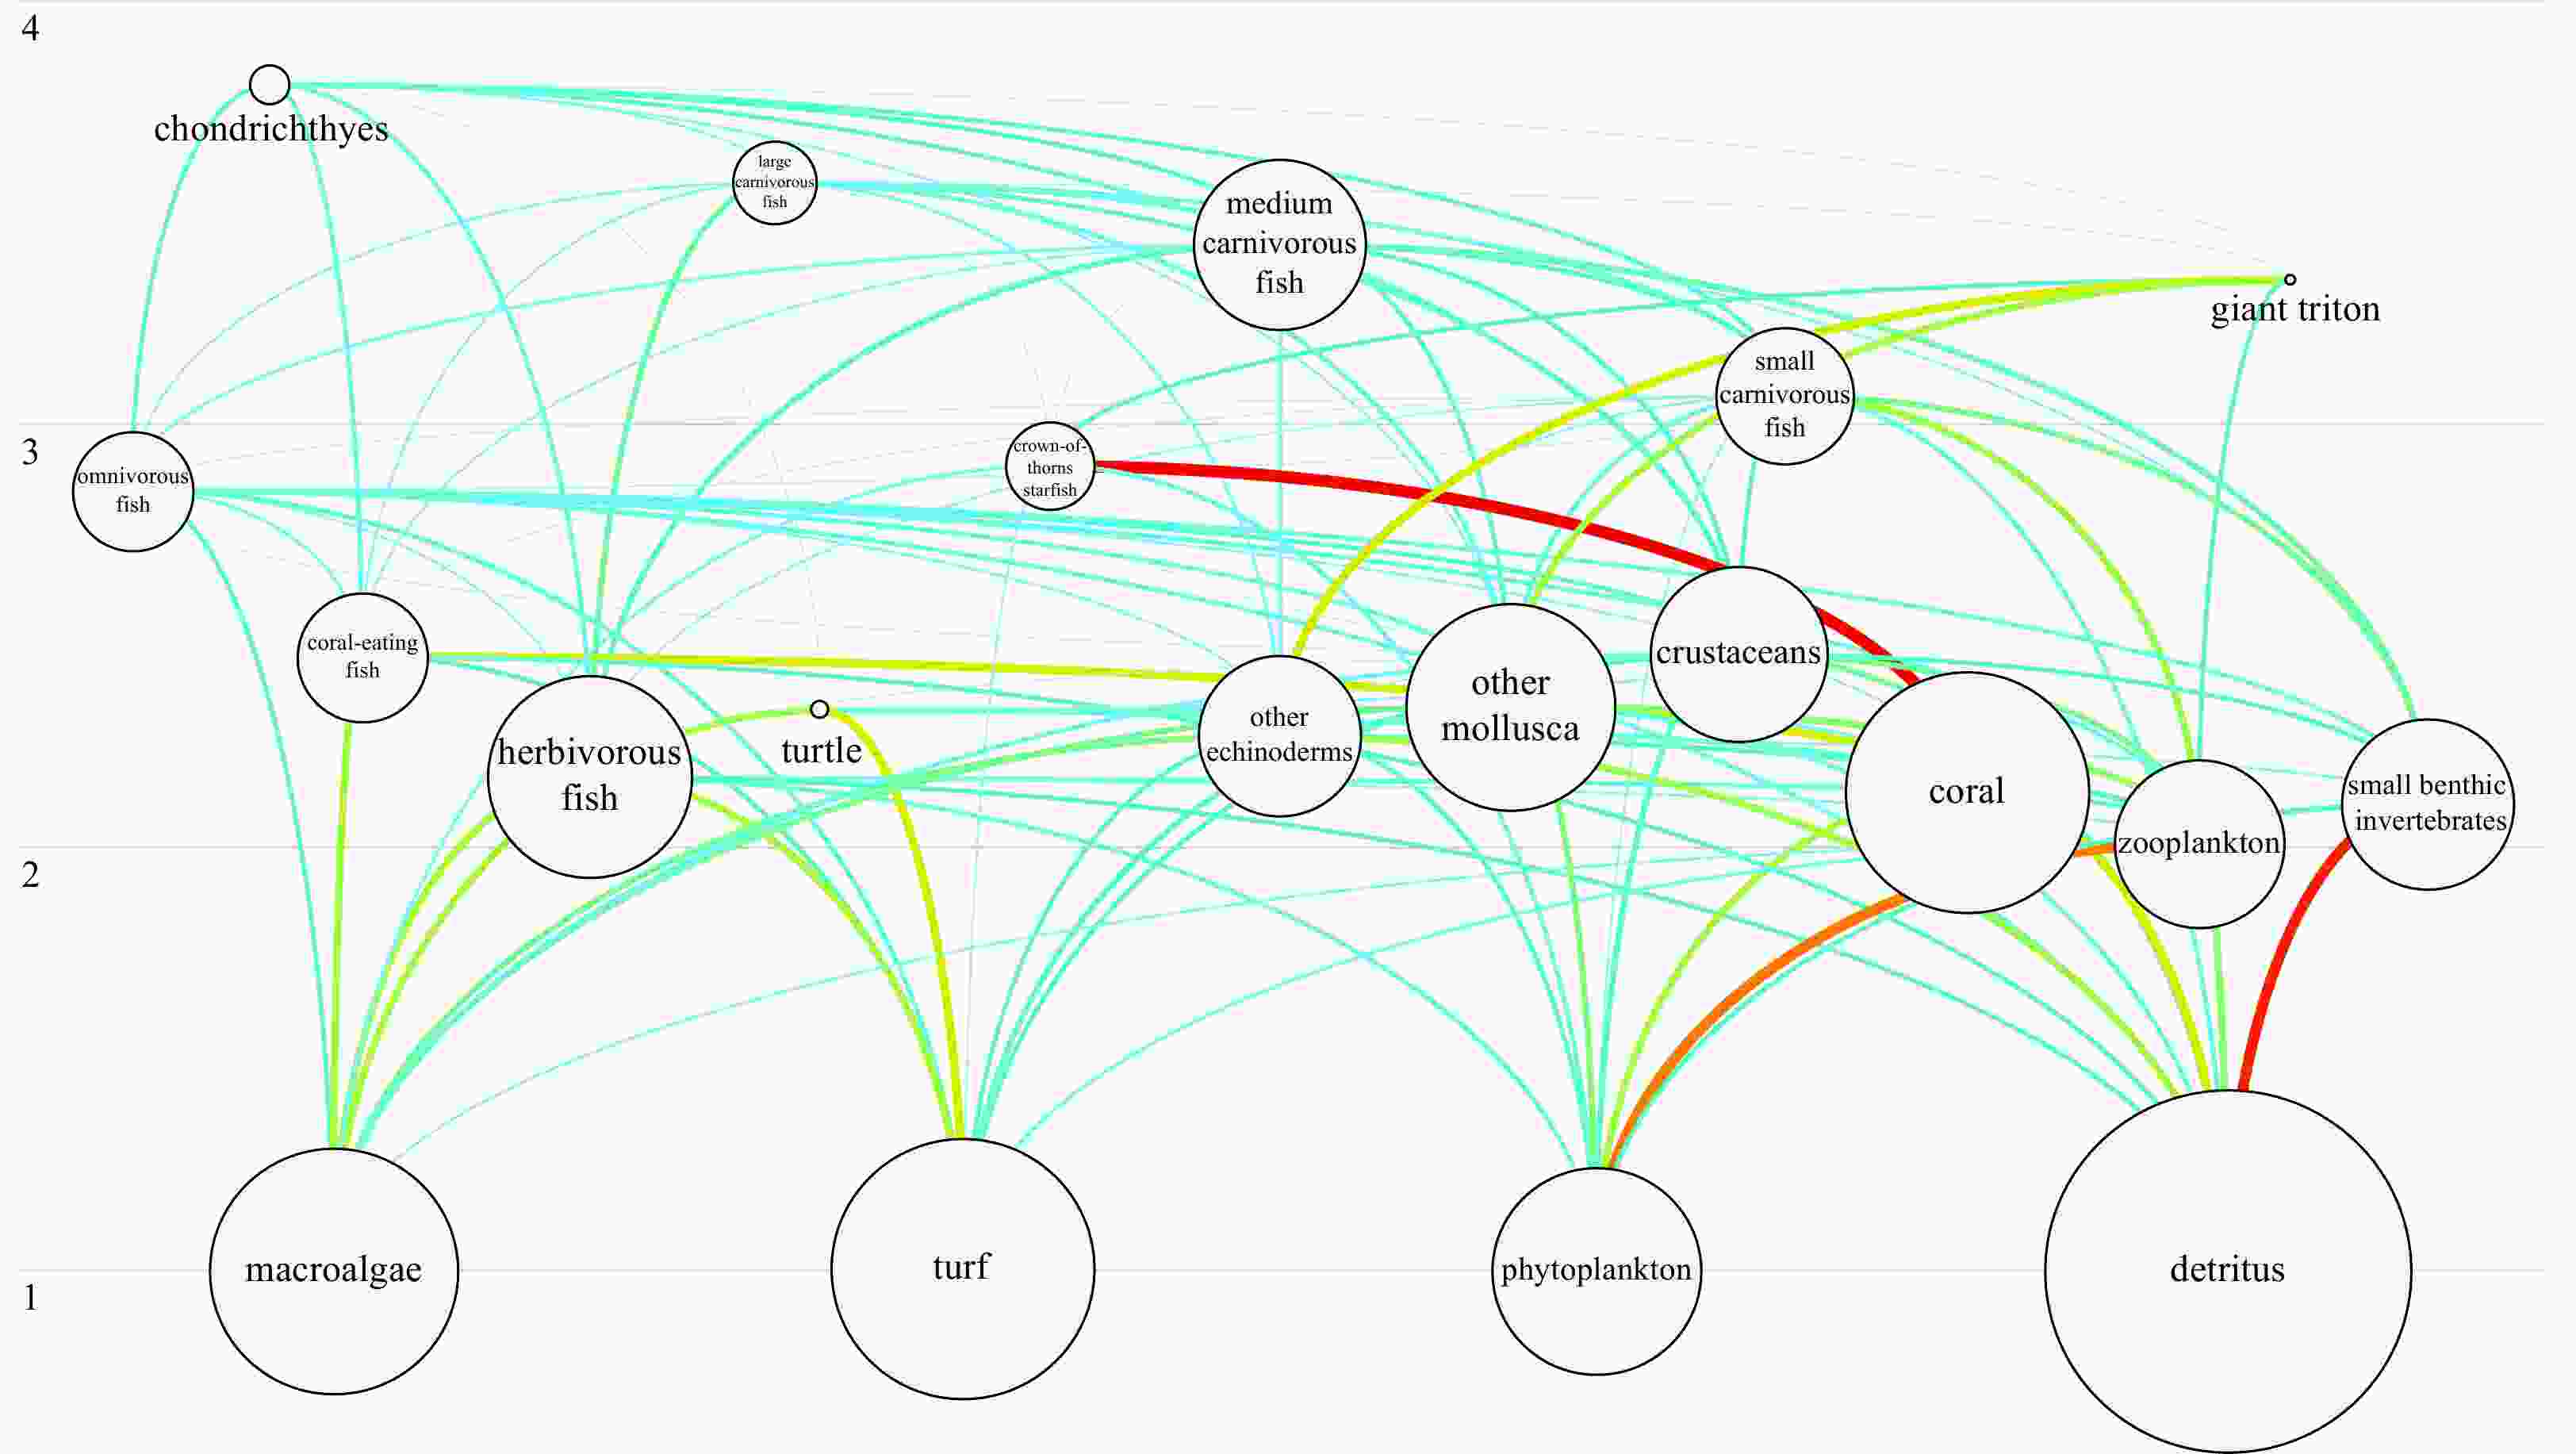
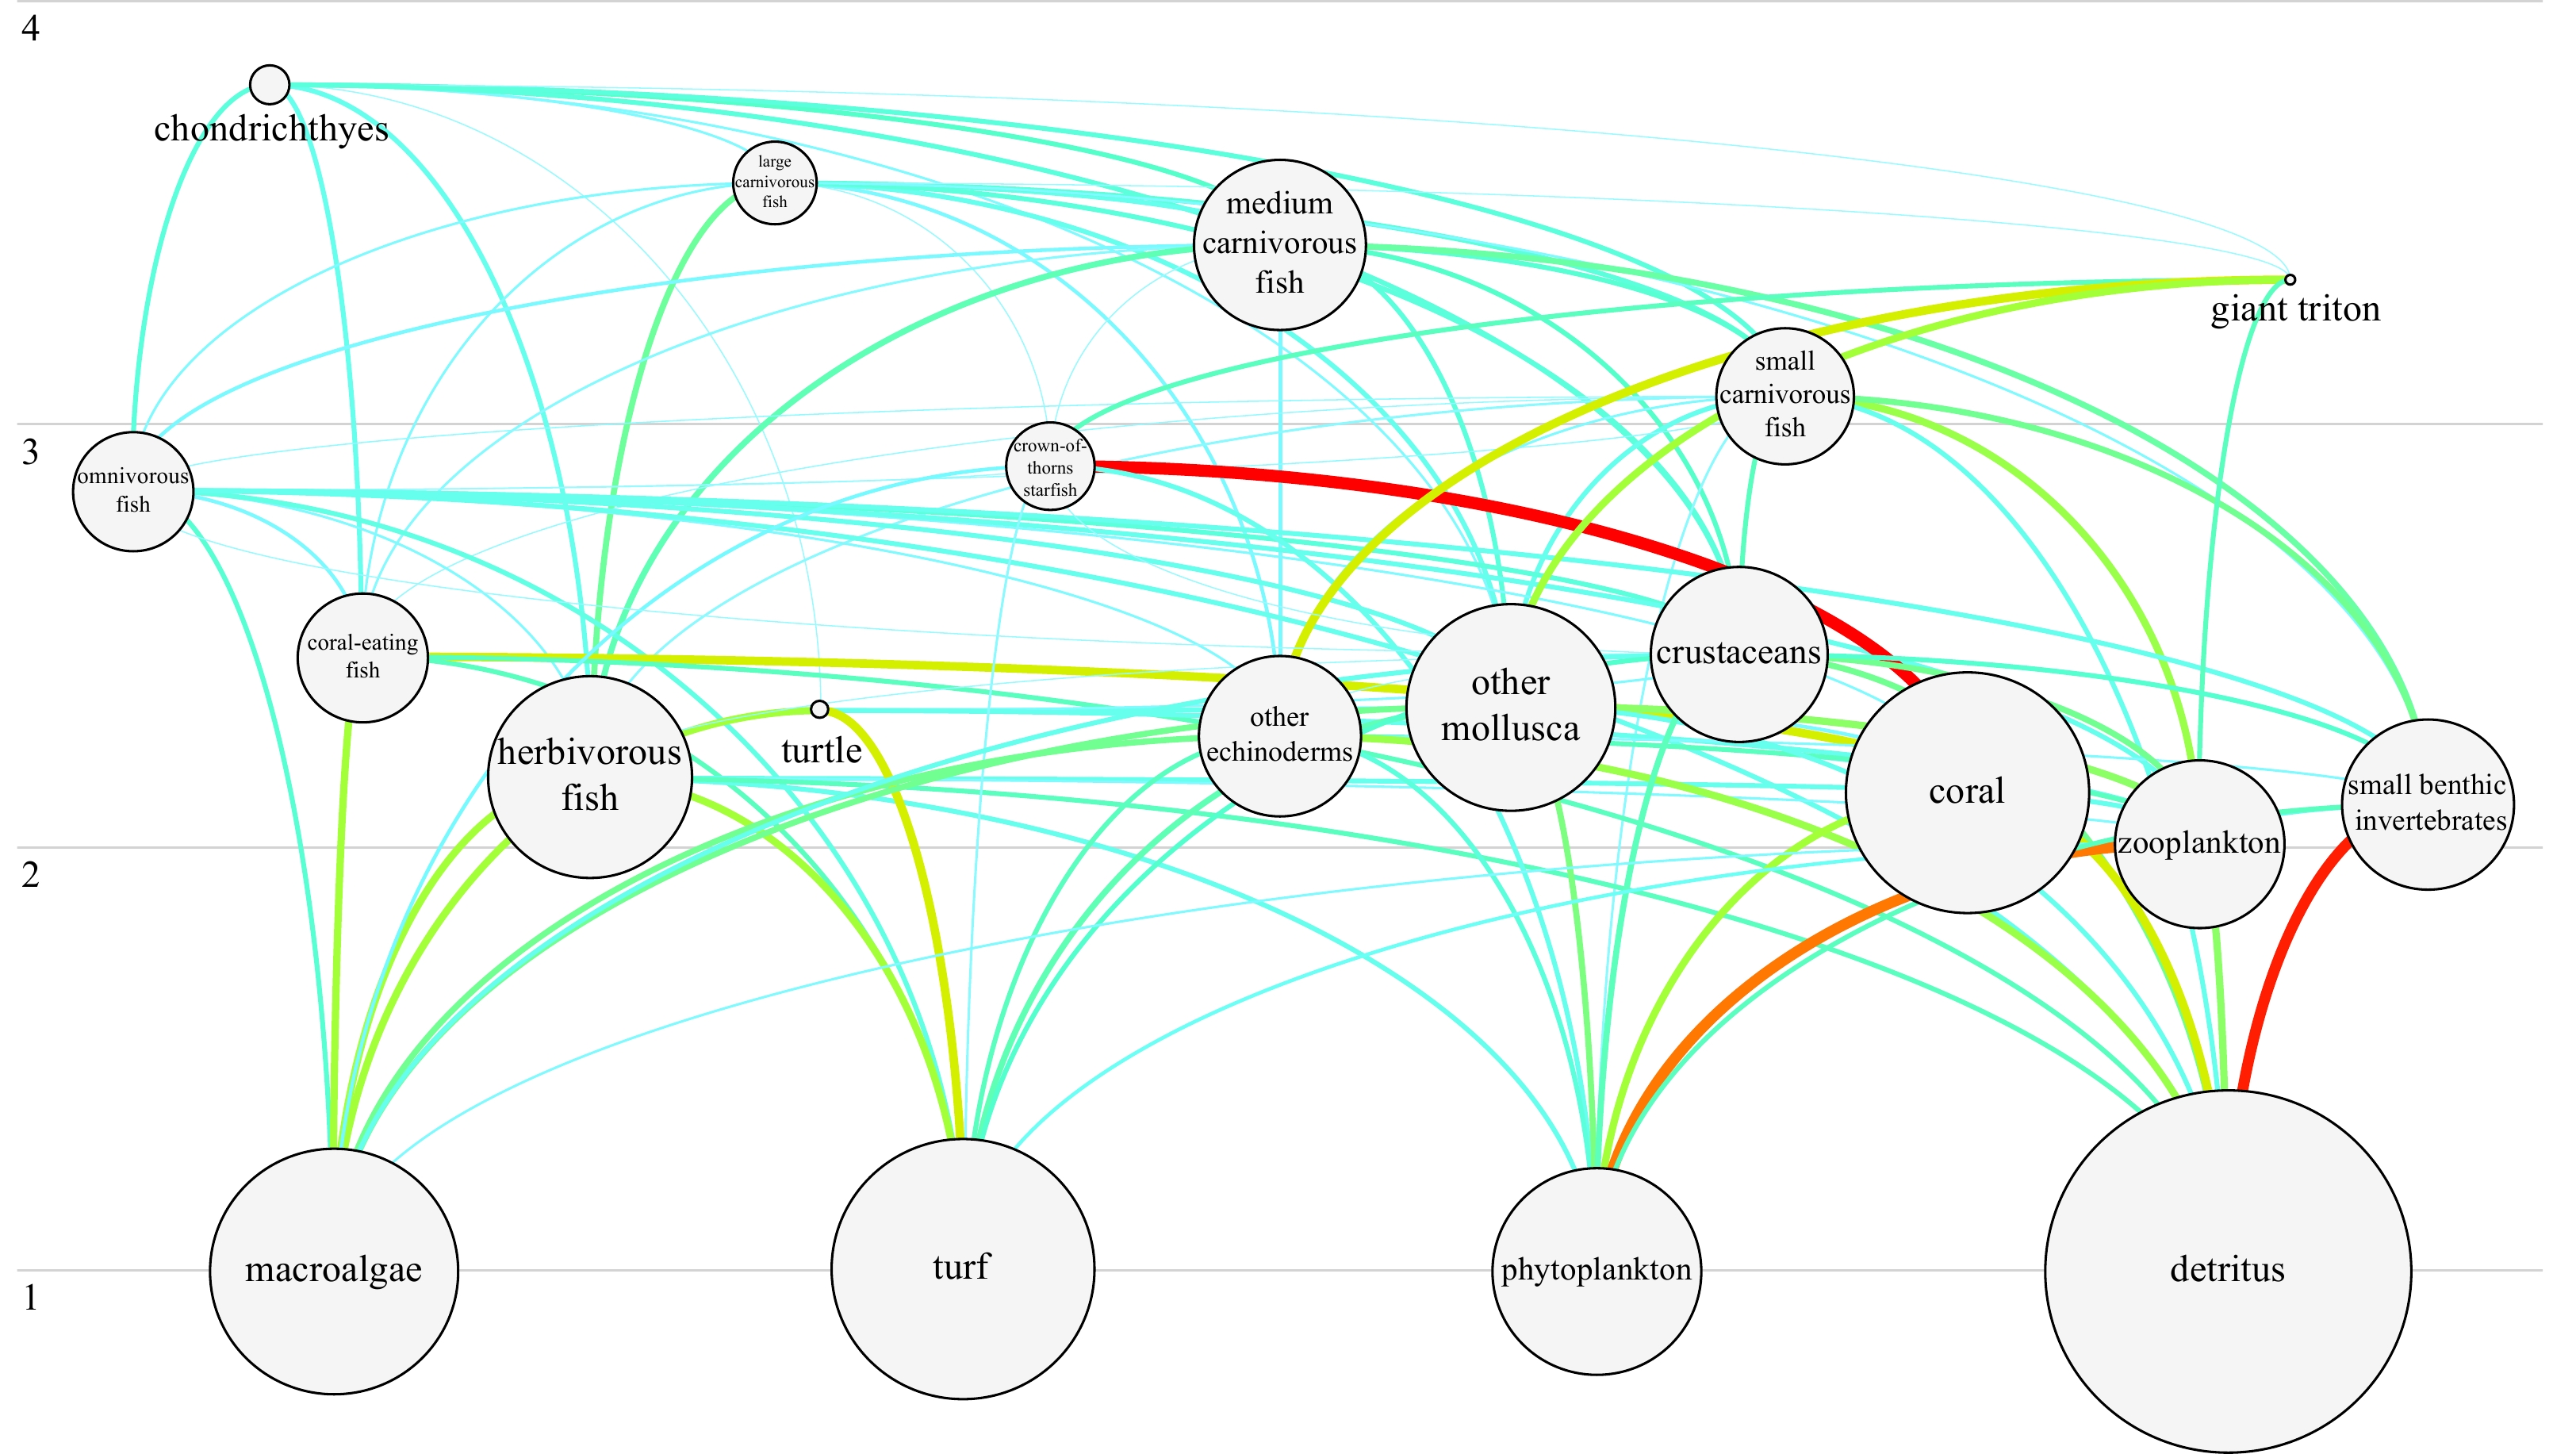
Figure 2. Qilianyu Islands coral reefs ecosystem flow diagram. Circles are proportional to the functional group biomass in the system.
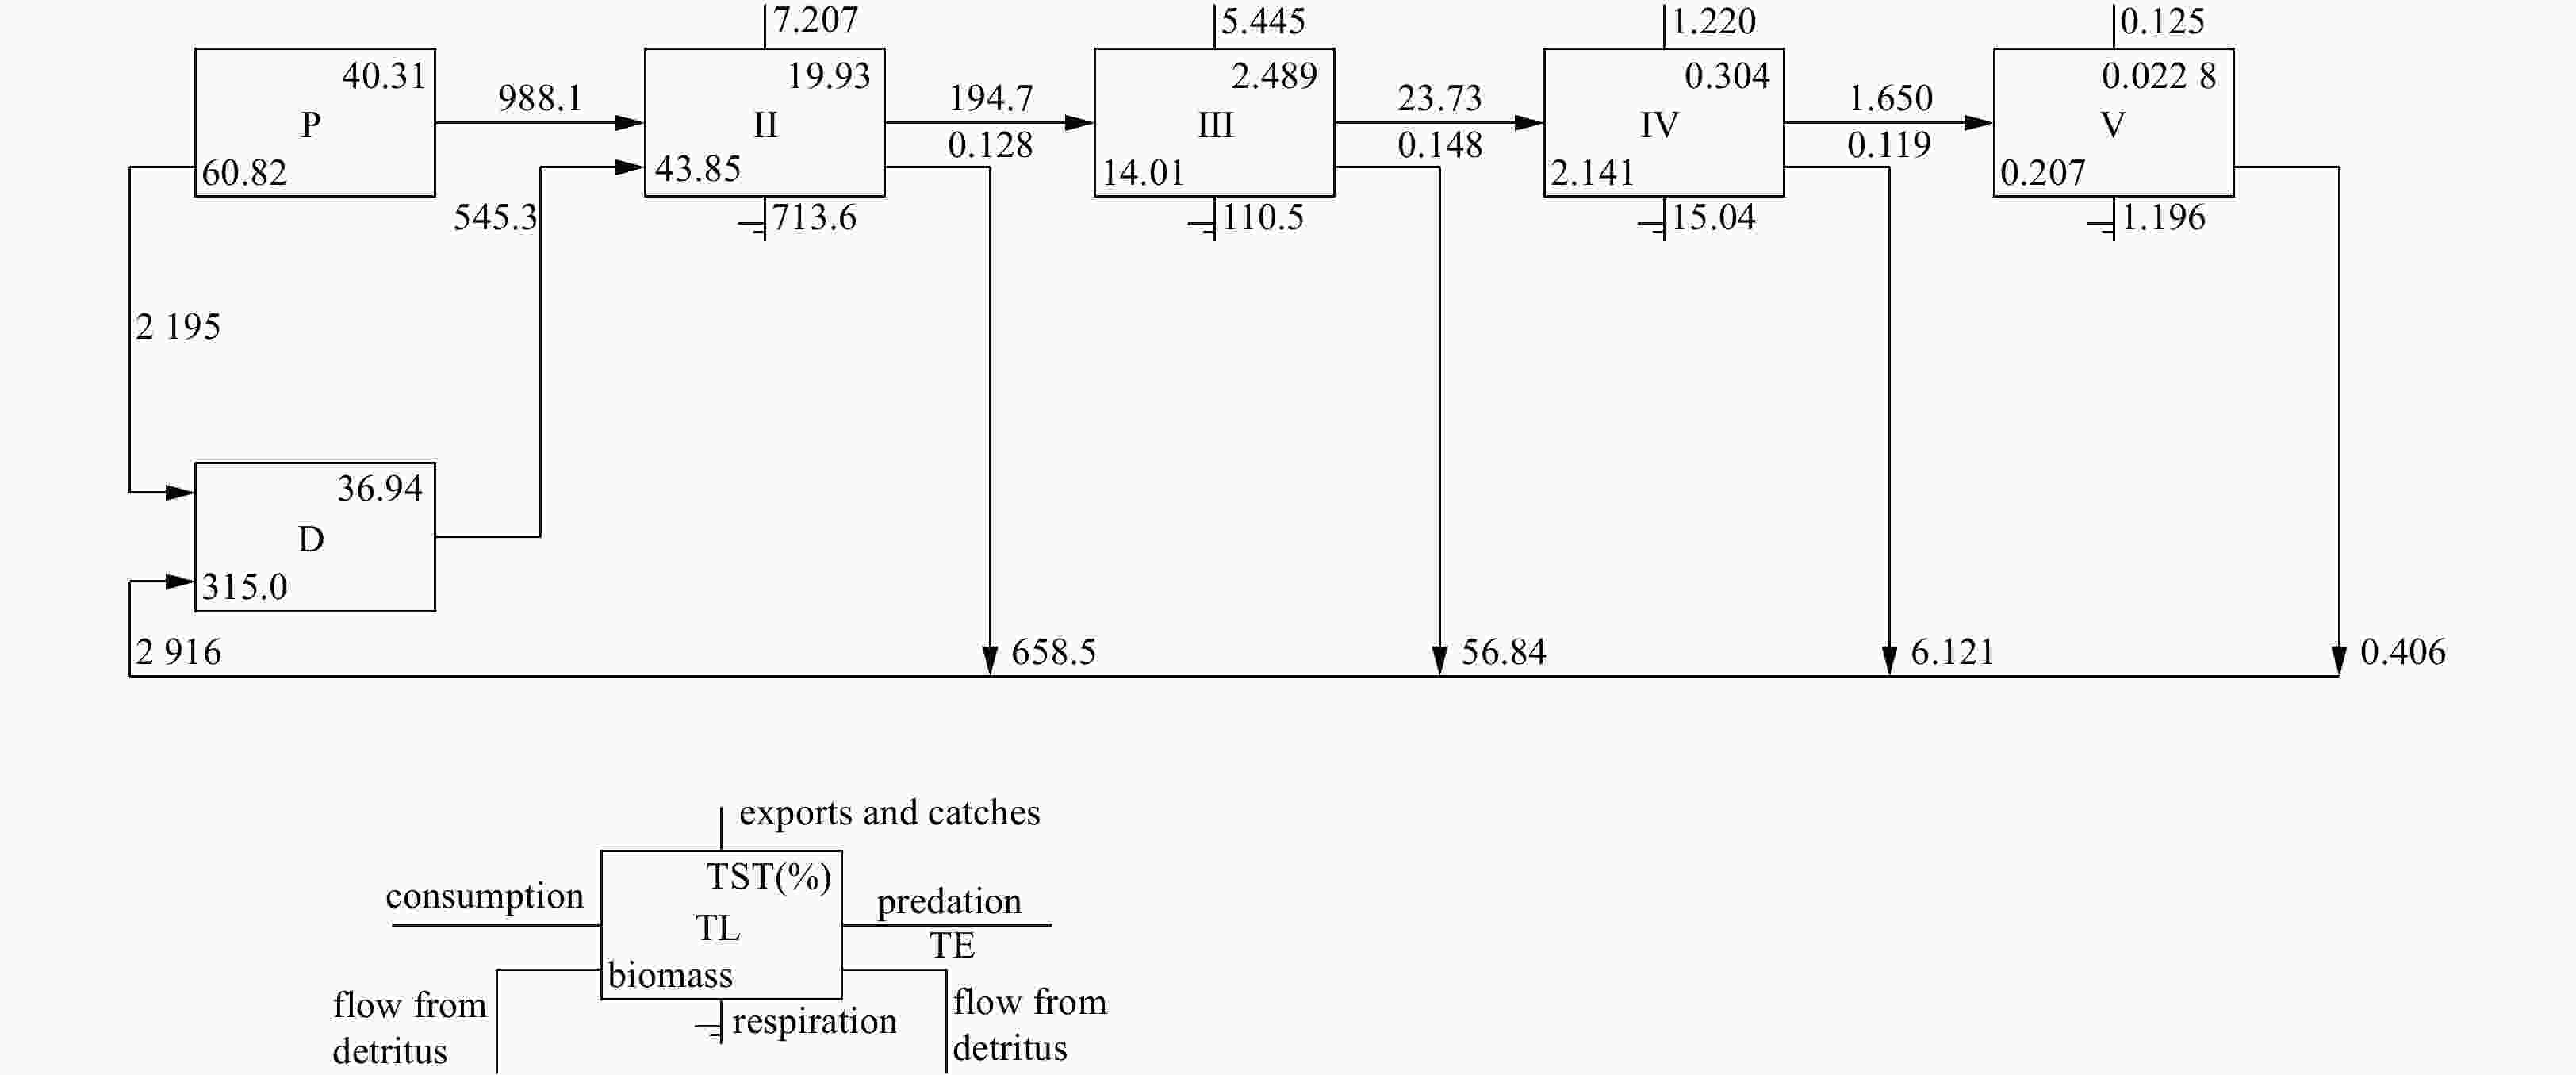
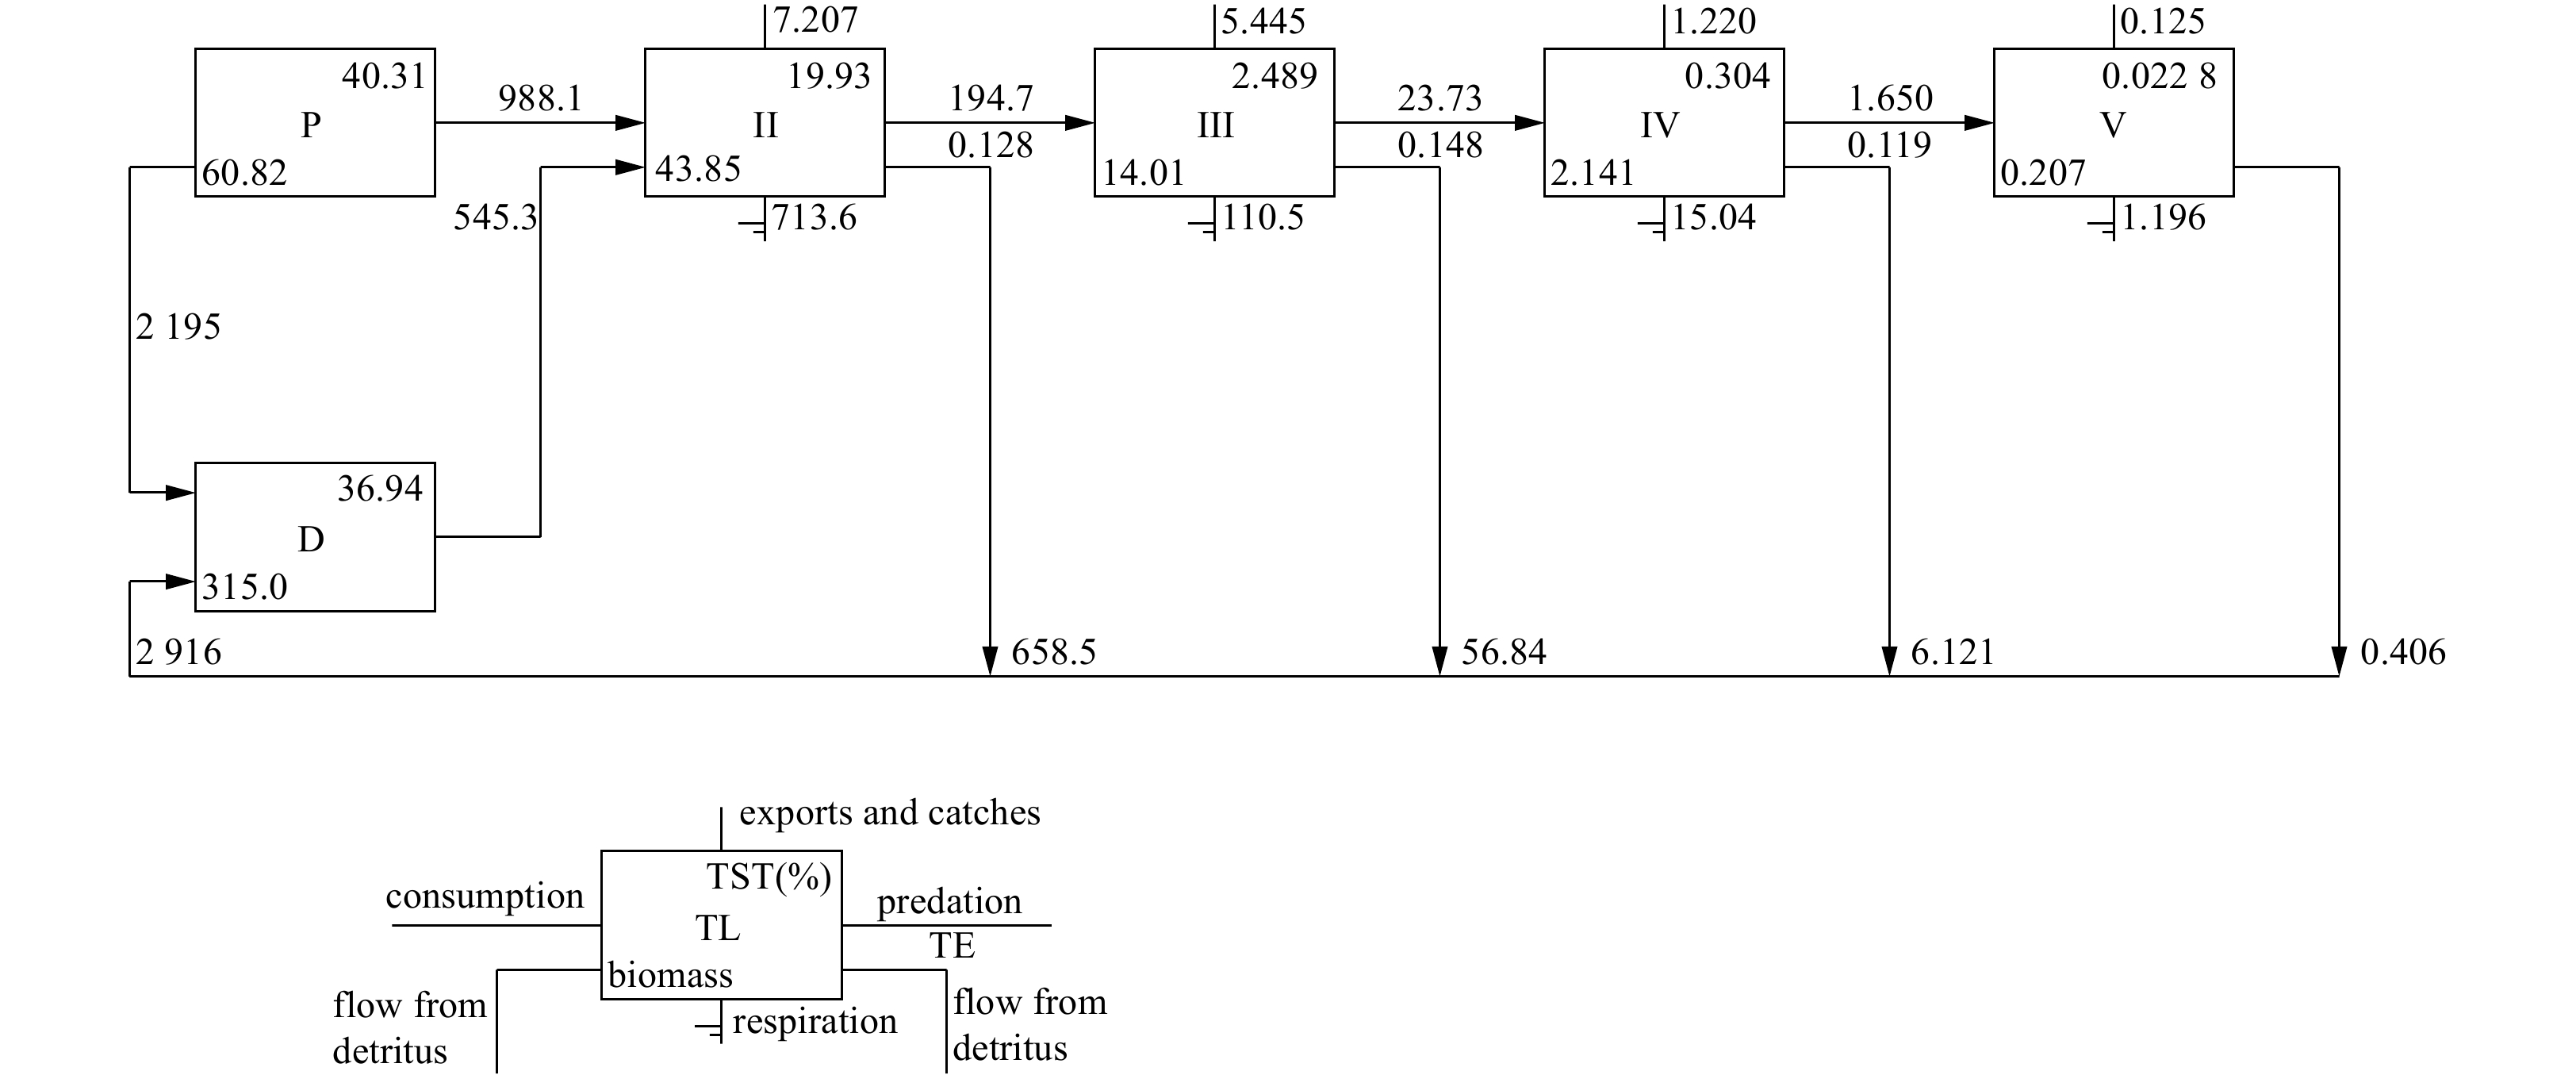
Figure 3. Lindeman spine representing of trophic flows from Qilianyu Islands coral reefs Ecopath model. P: primary producers; D: detritus; II–V: trophic levels; TST: total system throughput; TE: transfer efficiencies; TL: trophic level.

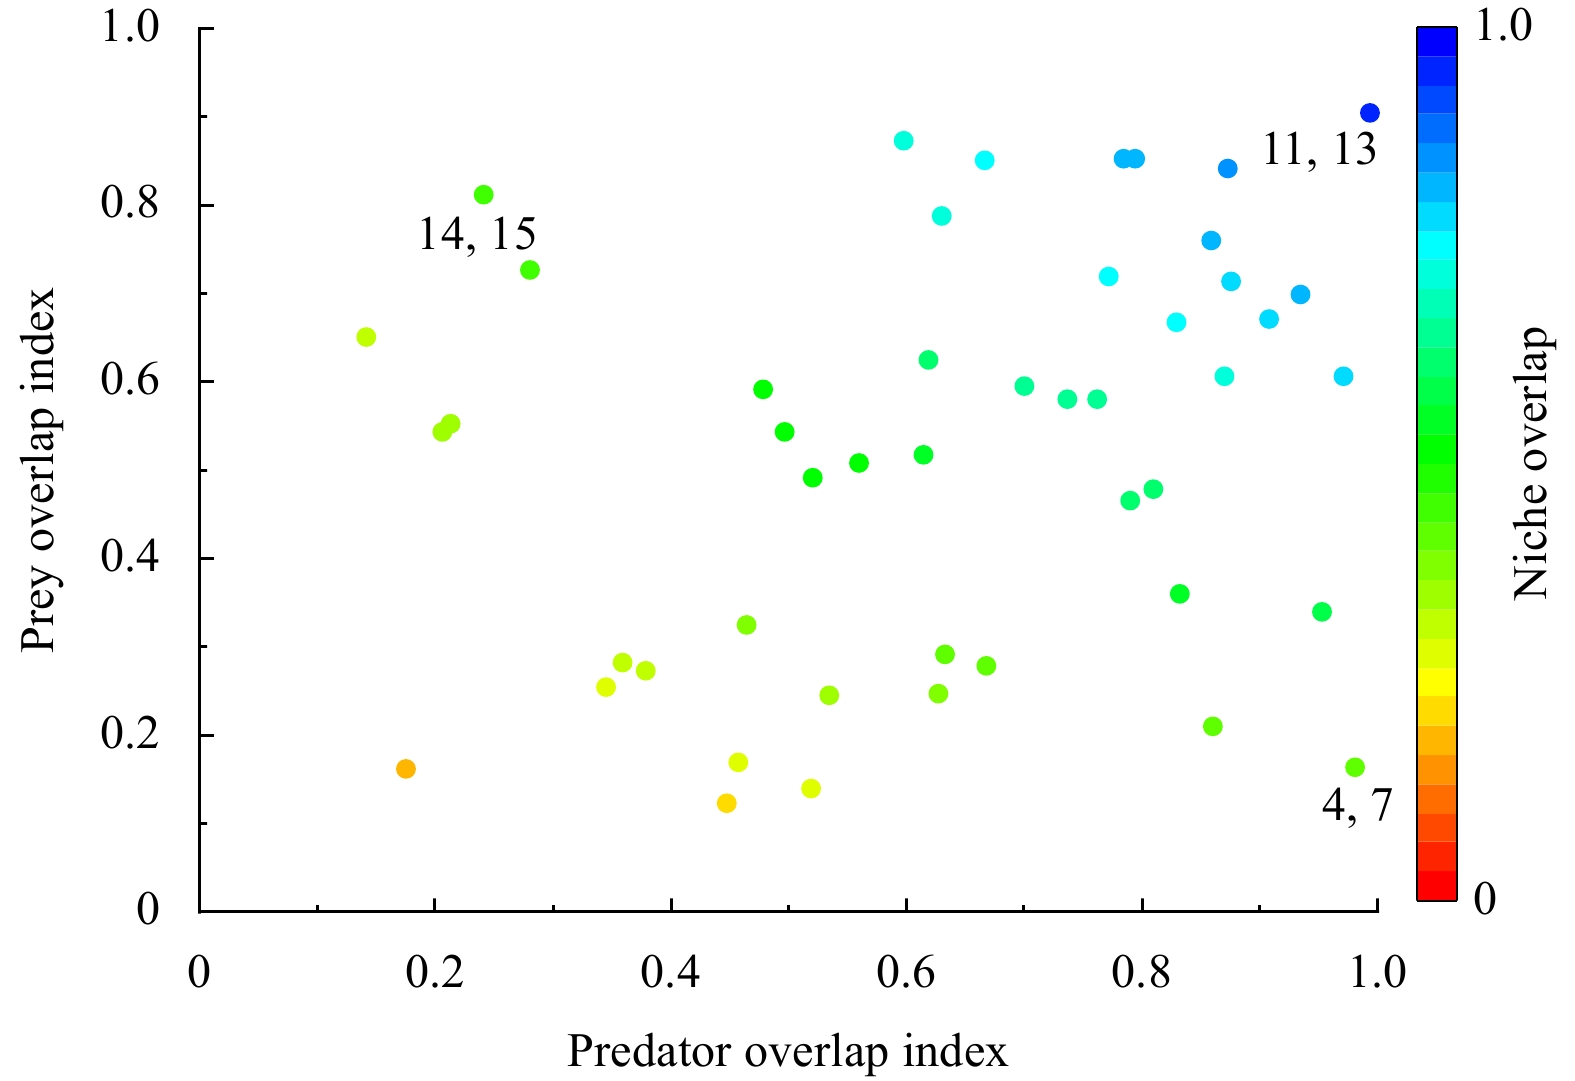
Figure 4. Qilianyu Islands coral reefs Ecopath model plot of functional group niche overlap. Point colors represent geometric mean of “prey overlap index” and “predator overlap index” (color scale to right); functional groups: 4, 7 small carnivorous and herbivorous fish; 14, 15 coral and zooplankton; 11, 13 other echinoderms and crustaceans.

Figure 5. Qilianyu Islands coral reefs model mixed trophic impact analysis. Positive (blue) and negative (red) values of mixed trophic impact index represent positive and negative effects, respectively. LCF, large carnivorous fish; MCF, medium carnivorous fish; SCF, small carnivorous fish; OF, omnivorous fish; CEF, coral-eating fish; HF, herbivorous fish; CTS, crown of thorns starfish; OE, other echinoderms; OM, other mollusca; SBI, small benthic invertebrates.
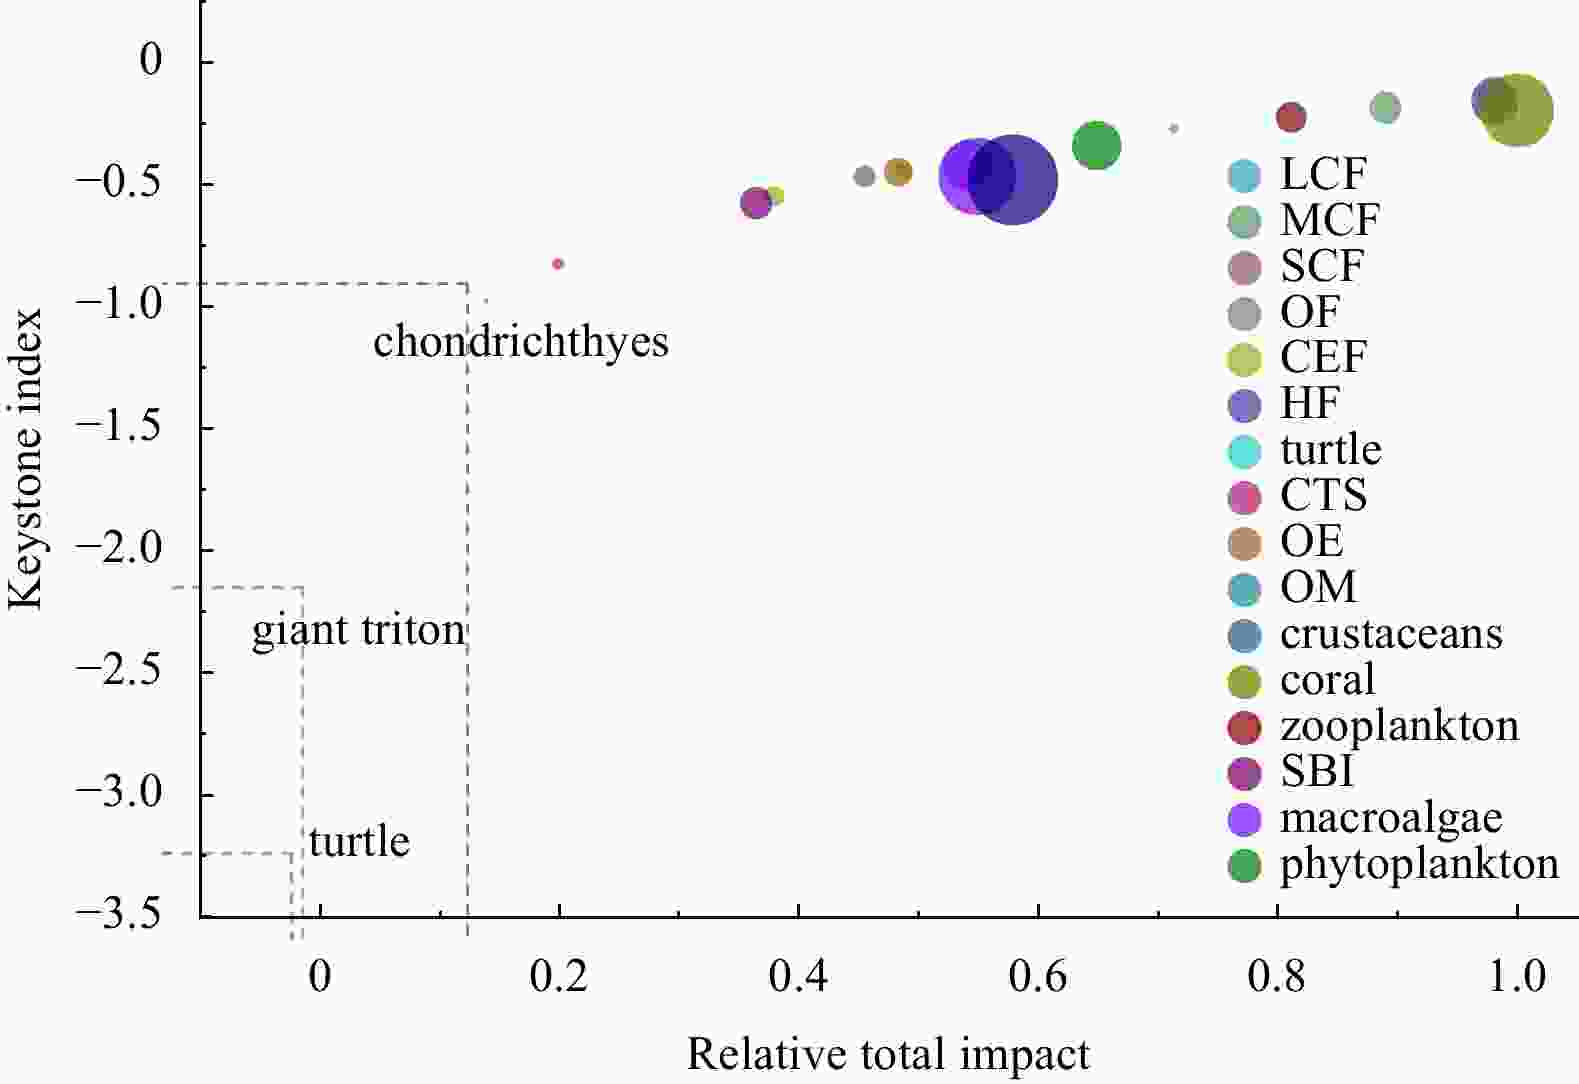
Figure 6. Keystone index for Qilianyu Islands coral reefs model functional groups. For each functional group, the keystone index (y-axis) is reported against their relative total impact on the trophic web (x-axis). Overall effects are relative to the maximum effect measured; the x-axis scale is between 0.0 and 1.0. The functional groups are ordered by decreasing keystone index; therefore, the key functional groups are those ranking among the first groups. Circles are proportional to the functional group biomass in the system.
Table 1. Qilianyu Islands coral reefs Ecopath model functional groups
Group name Composition of dominant species Chondrichthyes ray, skate, shark Large carnivorous fish Aprion virescens, Pristipomoides filamentosus, Aphareus rutilans, large grouper, etc. Medium carnivorous fish Labridae, Lethrinidae, Priacanthidae, Mullidae, etc. Small carnivorous fish Holocentridae, Apogonidae, Cephalopholis, Epinephelus merra, etc. Omnivorous fish Pomacentridae, Balistidae, etc. Coral-eating fish Scaridae, Chaetodontidae, etc. Herbivorous fish Pomacanthidae, Acanthuridae, Siganus, etc. Turtles Chelonia mydas, Eretmochelys imbricata, Dermochelys coriacea, etc. Crown-of-thorns starfish Acanthaster planci Giant triton Charonia tritonis Other echinoderms urchin, cucumber, brittle star, starsish Other mollusca bivalve, snail, etc. Crustaceans crab & shrimp Coral Pocillopora damicornis, Pocillopora verrucosa, Acropora humilis, Porites lutea, etc. Zooplankton copepoda, planula, juvenile fish, etc. Small benthic invertebrates polychaeta, etc. Macroalgae coralline algae Turf turf Phytoplankton Bacillariopyta, Pyrrophyta, Chrysophyta, Cyanophyta, etc. Detritus particulate organic carbon & dissolved organic carbon  下载: 导出CSV
Table 2. Estimates of Qilianyu Islands coral reefs ecosystem food intake for trophic groups
No. Prey (predator) 1 2 3 4 5 6 7 8 9 10 11 12 13 14 15 16 1 chondrichthyes 0.01 0 0 0 0 0 0 0 0 0 0 0 0 0 0 0 2 large carnivorous fish 0.05 0.008 0 0 0 0 0 0 0 0 0 0 0 0 0 0 3 medium carnivorous fish 0.14 0.1 0.009 0 0 0 0 0 0 0 0 0 0 0 0 0 4 small carnivorous fish 0.12 0.12 0.13 0.03 0.019 0 0 0 0 0 0 0 0 0 0 0 5 omnivorous fish 0.12 0.05 0.06 0.02 0.01 0 0 0 0 0 0 0 0.005 0 0 0 6 coral-eating fish 0.1 0.05 0.04 0.01 0.06 0 0 0 0 0 0 0 0 0 0 0 7 herbivorous fish 0.1 0.19 0.16 0.03 0.05 0 0 0 0 0 0 0 0.005 0 0 0 8 turtles 0.001 0 0 0 0 0 0 0 0 0 0 0 0 0 0 0 9 crown-of-thorns starfish 0 0.001 0.001 0 0.001 0 0 0 0 0.15 0 0 0.001 0 0 0 10 giant triton 1×10⁻⁵ 0.000 5 0 0 0 0 0 0 0 0 0 0 0 0 0 0 11 other echinoderms 0 0.06 0.06 0.05 0.05 0 0 0 0 0.4 0 0 0.005 0 0 0 12 other mollusca 0.05 0.1 0.12 0.1 0.1 0 0 0.1 0 0.3 0 0.01 0.05 0 0 0 13 crustaceans 0.12 0.12 0.14 0.15 0.12 0 0 0.05 0 0 0 0 0.012 0 0 0 14 coral 0 0 0 0 0.05 0.4 0.1 0 0.8 0 0.05 0.06 0 0 0 0 15 zooplankton 0 0 0 0.28 0.1 0 0.05 0.1 0 0.15 0.15 0.25 0.2 0.1 0.01 0.1 16 small benthic invertebrates 0 0.05 0.18 0.2 0.1 0 0 0 0 0 0.05 0 0.133 0 0 0 17 macroalgae 0 0 0 0 0.13 0.3 0.3 0.3 0.07 0 0.2 0.2 0.1 0 0.05 0 18 turf 0 0 0 0 0.11 0.15 0.3 0.4 0.03 0 0.15 0.16 0.135 0 0.09 0 19 phytoplankton 0 0 0 0.03 0 0 0.1 0 0.1 0 0.12 0.22 0.154 0.3 0.6 0.15 20 detritus 0 0 0 0.1 0.1 0.15 0.15 0 0 0 0.28 0.1 0.2 0.4 0.25 0.75 Import 0.189 0.150 05 0.1 0 0 0 0 0.05 0 0 0 0 0 0.2 0 0 Sum 1.000 01 0.999 55 1 1 1 1 1 1 1 1 1 1 1 1 1 1
下载: 导出CSV
Table 3. Basic Ecopath model functional group input and estimated output parameters
No. Group name TL B/(t·km−2·a−1) P:B/(a−1) Q:B/(a−1) Un. Q Catch EE P/Q NE OI 1 chondrichthyes 3.80 0.097 0.25 4.72 0.20 − 0.189 0.05 0.07 0.41 2 large carnivorous fish 3.57 0.430 0.79 6.64 0.20 0.200 0.723 0.12 0.15 0.30 3 medium carnivorous fish 3.42 3.781 1.00 8.50 0.20 2.500 0.830 0.12 0.15 0.16 4 small carnivorous fish 3.07 1.700 4.00 13.50 0.20 0.800 0.942 0.30 0.37 0.22 5 omnivorous fish 2.84 1.103 4.50 16.30 0.20 1.500 0.981 0.28 0.35 0.40 6 coral-eating fish 2.45 1.415 2.40 20.00 0.20 0.200 0.878 0.12 0.15 0.30 7 herbivorous fish 2.16 8.156 3.00 28.00 0.40 1.800 0.397 0.11 0.18 0.15 8 turtles 2.32 0.020 0.14 3.50 0.20 0.002 0.878 0.04 0.05 0.29 9 crown-of-thorns starfish 2.90 0.485 1.20 5.00 0.20 − 0.300 0.24 0.30 0.20 10 giant triton 3.34 0.002 1.22 4.08 0.20 0.001 0.950 0.30 0.37 0.07 11 other echinoderms 2.26 3.035 2.20 7.80 0.20 0.500 0.786 0.28 0.35 0.21 12 other mollusca 2.33 8.700 2.50 5.60 0.20 6.000 0.955 0.45 0.56 0.24 13 crustaceans 2.46 4.300 3.20 28.00 0.25 0.500 0.904 0.11 0.15 0.31 14 coral 2.13 19.574 3.00 10.00 0.20 − 0.700 0.30 0.38 0.13 15 zooplankton 2.01 3.510 76.00 242.50 0.30 − 0.416 0.31 0.45 0.01 16 small benthic invertebrates 2.10 3.911 12.00 60.00 0.25 − 0.629 0.20 0.27 0.09 17 macroalgae 1.00 22.000 18.00 − − − 0.375 − − − 18 turf 1.00 30.000 25.00 − − − 0.239 − − − 19 phytoplankton 1.00 8.817 231.00 − − − 0.324 − − − 20 detritus 1.00 315.000 − − − − 0.187 − − 0.24 Note: B: biomass; OI: omnivory index; TL: trophic level; P/B: production/biomass; Q/B: consumption/biomass; Un. Q: unassim. consumption; EE: ecotrophic efficiency; P/Q: production/consumption; NE: net efficiency. Values in bold are estimated by the present model. − reprsents no data.
下载: 导出CSV
Table 4. Distribution of Qilianyu Islands coral reefs ecosystem flow
Trophic level Consumption
by predatorsExport Flow to
detritusRespiration Throughput V 0.070 0.125 0.406 1.196 1.798 IV 1.650 1.220 6.121 15.040 24.030 III 23.730 5.445 56.840 110.500 196.500 II 194.700 7.207 658.500 713.600 1 574.000 I 1 533.000 2 371.000 2 195.000 0.000 6 099.000 Sum 1 754.000 2 385.000 2 916.000 840.400 7 896.000
下载: 导出CSV
Table 5. Transfer efficiency of Qilianyu Islands coral reefs ecosystem trophic levels
Source Trophic level II III IV V Producer 12.37 15.53 11.84 11.1 Detritus 13.64 13.73 12.13 10.43 All flows 12.83 14.84 11.94 10.87 Note: Proportion of total flow originating from detritus: 0.45; transfer efficiencies (mTE, calculated as geometric mean for TL II–IV); from primary producers: 13.15%; from detritus: 13.14%; total: 13.15%.
下载: 导出CSV
Table 6. Comparison of Qilianyu Islands coral reefs ecosystem characteristics with other coral reefs
Area Qilianyu
IslandsHawaii
IslandCocos
IslandDarwin &Wolf
IslandNanwan
BayUvea
AtollCaribbean Sea Cayos Cochinos Media Luna Group number 20 26 31 32 18 25 22 21 Sum of all consumption/(t·km−2·a−1) 1 810 5 332 22 978 8 880 8 373 292 31 013 27 381 Sum of all exports/(t·km−2·a−1) 2 385 520 20 344 16 200 185 81 700 9 779 Sum of all respiratory flows/(t·km−2·a−1) 840 3 477 12 050 5 278 4 629 86 17 096 16 264 Sum of all flows into detritus/(t·km−2·a−1) 2 916 1 700 6 136 2 151 20 115 346 90 17 881 TST/(t·km−2·a−1) 7 952 11 030 41 184 16 652 49 317 909 220 232 71 305 Sum of all production/(t·km−2·a−1) 3 642 − 978 5 235 21 553 325 10 6510 31 684 TLc 2.62 2.59 3.55 3.02 2.40 3.50 3.64 2.97 GE 0.00 4 0.000 09 2.00×10⁻⁶ 0.001 0.000 36 0.000 15 1.01×10⁻⁹ 1.20×10⁻⁵ Net p.p./(t·km−2·a−1) 3 182.73 3 895.09 4 583.59 3 408.00 20 199.00 265.30 98 796.00 26 043.00 TPP/TR 3.79 1.12 0.38 0.65 4.40 3.10 5.78 1.60 NSP/(t·km−2·a−1) 2 342.30 417.78 −7 466.37 −1 898.00 15 570.00 179.40 81 700.00 9 779.00 TPP/TB 26.30 5.57 2.32 3.64 9.90 19.95 11.82 10.21 TB:TST/(a−1) 0.015 0.06 0.05 0.06 0.04 0.01 0.04 0.04 Total catch/(t·km−2·a−1) 14.003 0.350 0.010 3.841 7.300 0.039 1.00×10⁻⁴ 0.311 CI 0.33 − 0.17 0.15 − − 0.30 0.26 SOI 0.21 − 0.40 0.32 − − 0.21 0.20 FCI/% 3.64 6.13 6.50 4.75 3.50 − 1.60 6.95 MPL 2.47 − − − − − 6.65 5.65 A:C/% 27.71 31.50 24.80 29.80 − − 47.00 31.00 mTE/% 13.15 − 12.20 10.70 7.80 − − − Note: GE: Gross efficiency (total catch/net p.p.); net p.p.: calculated total net primary production; NSP: net system production; TST: total system throughput; TLc: mean trophic level of the catch; TPP/TR: total primary production/total respiration; NSP: net system production; TPP/TB: total primary production/total biomass; TB/TST: total biomass/total throughput; CI: connectance index; SOI: system omnivory index; FCI: Finn's cycling index; MPL: Finn's mean path length; A/C: ascendency/capacity; mTE: mean transfer efficiencies. −represent no data.
下载: 导出CSV
-
Adey W H, Goertemiller T. 1987. Coral reef algal turfs: master producers in nutrient poor seas. Phycologia, 26(3): 374–386. doi: 10.2216/i0031-8884-26-3-374.1 Ainsworth C H, Mumby P J. 2015. Coral–algal phase shifts alter fish communities and reduce fisheries production. Global Change Biology, 21(1): 165–172. doi: 10.1111/gcb.12667 Albouy C, Mouillot D, Rocklin D, et al. 2010. Simulation of the combined effects of artisanal and recreational fisheries on a Mediterranean MPA ecosystem using a trophic model. Marine Ecology Progress Series, 412: 207–221. doi: 10.3354/meps08679 Allen K R. 1971. Relation between production and biomass. Journal of the Fisheries Research Board of Canada, 28(10): 1573–1581. doi: 10.1139/f71-236 Alva-Basurto J C, Arias-González J E. 2014. Modelling the effects of climate change on a Caribbean coral reef food web. Ecological Modelling, 289: 1–14. doi: 10.1016/j.ecolmodel.2014.06.014 Anthony K R N, Kline D I, Diaz-Pulido G, et al. 2008. Ocean acidification causes bleaching and productivity loss in coral reef builders. Proceedings of the National Academy of Sciences of the United States of America, 105(45): 17442–17446. doi: 10.1073/pnas.0804478105 Arias-González J E, Delesalle B, Salvat B, et al. 1997. Trophic functioning of the Tiahura reef sector, Moorea Island, French Polynesia. Coral Reefs, 16(4): 231–246. doi: 10.1007/s003380050079 Arias-González J E, Nuñez-Lara E, González-Salas C, et al. 2004. Trophic models for investigation of fishing effect on coral reef ecosystems. Ecological Modelling, 172(2–4): 197–212, Bahr K D, Rodgers K S, Jokiel P L, et al. 2020. Pulse sediment event does not impact the metabolism of a mixed coral reef community. Ocean & Coastal Management, 184: 105007. doi: 10.1016/j.ocecoaman.2019.105007 Baums I B. 2008. A restoration genetics guide for coral reef conservation. Molecular Ecology, 17(12): 2796–2811. doi: 10.1111/j.1365-294X.2008.03787.x Bello-Pineda J, Ponce-Hernández R, Liceaga-Correa M A. 2006. Incorporating GIS and MCE for suitability assessment modelling of coral reef resources. Environmental Monitoring and Assessment, 114(1–3): 225–256, Bellwood D R, Hughes T P, Folke C, et al. 2004. Confronting the coral reef crisis. Nature, 429(6994): 827–833. doi: 10.1038/nature02691 Botha E J, Brando V E, Anstee J M, et al. 2013. Increased spectral resolution enhances coral detection under varying water conditions. Remote Sensing of Environment, 131: 247–261. doi: 10.1016/j.rse.2012.12.021 Bozec Y M, Gascuel D, Kulbicki M. 2004. Trophic model of lagoonal communities in a large open atoll (Uvea, Loyalty Islands, New Caledonia). Aquatic Living Resources, 17(2): 151–162. doi: 10.1051/alr:2004024 Bozec Y M, O’Farrell S, Bruggemann J H, et al. 2016. Tradeoffs between fisheries harvest and the resilience of coral reefs. Proceedings of the National Academy of Sciences of the United States of America, 113(16): 4536–4541. doi: 10.1073/pnas.1601529113 Brandl S J, Emslie M J, Ceccarelli D M, et al. 2016. Habitat degradation increases functional originality in highly diverse coral reef fish assemblages. Ecosphere, 7(11): e01557. doi: 10.1002/ecs2.1557 Brown P C, Painting S J, Cochrane K L. 1991. Estimates of phytoplankton and bacterial biomass and production in the northern and southern Benguela ecosystems. South African Journal of Marine Science, 11(1): 537–564. doi: 10.2989/025776191784287673 Cáceres I, Ortiz M, Cupul-Magaña A L, et al. 2016. Trophic models and short-term simulations for the coral reefs of Cayos Cochinos and Media Luna (Honduras): a comparative network analysis, ecosystem development, resilience, and fishery. Hydrobiologia, 770(1): 209–224. doi: 10.1007/s10750-015-2592-7 Cheal A J, MacNeil M A, Cripps E, et al. 2010. Coral–macroalgal phase shifts or reef resilience: links with diversity and functional roles of herbivorous fishes on the Great Barrier Reef. Coral Reefs, 29(4): 1005–1015. doi: 10.1007/s00338-010-0661-y Chen Zuozhi, Qiu Yongsong. 2010. Assessment of the food-web structure, energy flows, and system attribute of northern South China Sea ecosystem. Acta Ecologica Sinica, 30(18): 4855–4865 Chen Zuozhi, Xu Shannan, Qiu Yongsong. 2015. Using a food-web model to assess the trophic structure and energy flows in Daya Bay, China. Continental Shelf Research, 111: 316–326. doi: 10.1016/j.csr.2015.08.013 Chen Xiaoyan, Yu Kefu, Huang Xueyong, et al. 2019. Atmospheric nitrogen deposition increases the possibility of macroalgal dominance on remote coral reefs. Journal of Geophysical Research: Biogeosciences, 124(5): 1355–1369. doi: 10.1029/2019jg005074 Chen Biao, Yu Kefu, Liao Zhiheng, et al. 2021. Microbiome community and complexity indicate environmental gradient acclimatisation and potential microbial interaction of endemic coral holobionts in the South China Sea. Science of the Total Environment, 765: 142690. doi: 10.1016/j.scitotenv.2020.142690 Chesher R H. 1969. Destruction of Pacific corals by the sea star Acanthaster planci. Science, 165(3890): 280–283. doi: 10.1126/science.165.3890.280 Chong-Seng K M, Nash K L, Bellwood D R, et al. 2014. Macroalgal herbivory on recovering versus degrading coral reefs. Coral Reefs, 33(2): 409–419. doi: 10.1007/s00338-014-1134-5 Christensen V, Pauly D. 1992. ECOPATH II—a software for balancing steady-state ecosystem models and calculating network characteristics. Ecological Modelling, 61(3–4): 169–185, Christensen V, Walters C J. 2004. Ecopath with Ecosim: methods, capabilities and limitations. Ecological Modelling, 172(2–4): 109–139, Christensen V, Walters C J, Pauly D. 2005. Ecopath with Ecosim: A User’s Guide. Vancouver: University of British Columbia Christensen V, Walters C, Pauly D, et al. 2008. Ecopath with Ecosim Version 6 User Guide. Vancouver: University of British Columbia Cook C B, Logan A, Ward J, et al. 1990. Elevated temperatures and bleaching on a high latitude coral reef: the 1988 Bermuda event. Coral Reefs, 9(1): 45–49. doi: 10.1007/BF00686721 Darling E S, D’Agata S. 2017. Coral reefs: fishing for sustainability. Current Biology, 27(2): R65–R68. doi: 10.1016/j.cub.2016.12.005 Darnell R M. 1967. Organic detritus in relation to the estuarine ecosystem. In: Lauff G H, ed. Estuaries. Washington: American Association for the Advancement of Science, 376–382 Dove S G, Brown K T, Van Den Heuvel A, et al. 2020. Ocean warming and acidification uncouple calcification from calcifier biomass which accelerates coral reef decline. Communications Earth & Environment, 1(1): 55. doi: 10.1038/s43247-020-00054-x Du Jianguo, Makatipu P C, Tao L S R, et al. 2020. Comparing trophic levels estimated from a tropical marine food web using an ecosystem model and stable isotopes. Estuarine, Coastal and Shelf Science, 233: 106518, Du Feiyan, Wang Xuehui, Lin Zhaojin. 2015. The characteristics of summer zooplankton community in the Meiji coral reef, Nansha Islands, South China Sea. Acta Ecologica Sinica, 35(4): 1014–1021 Eyre B D, Cyronak T, Drupp P, et al. 2018. Coral reefs will transition to net dissolving before end of century. Science, 359(6378): 908–911. doi: 10.1126/science.aao1118 Fabricius K E, Okaji K, De’ath G. 2010. Three lines of evidence to link outbreaks of the crown-of-thorns seastar Acanthaster planci to the release of larval food limitation. Coral Reefs, 29(3): 593–605. doi: 10.1007/s00338-010-0628-z Ferrier-Pagès C, Hoogenboom M, Houlbrèque F. 2011. The role of plankton in coral trophodynamics. In: Dubinsky Z, Stambler N, eds. Coral Reefs: An Ecosystem in Transition. Dordrecht: Springer, Finn J T. 1976. Measures of ecosystem structure and function derived from analysis of flows. Journal of Theoretical Biology, 56(2): 363–380. doi: 10.1016/S0022-5193(76)80080-X Fox H E, Caldwell R L. 2006. Recovery from blast fishing on coral reefs: a tale of two scales. Ecological Applications, 16(5): 1631–1635. doi: 10.1890/1051-0761(2006)016[1631:RFBFOC]2.0.CO;2 Frank K T, Petrie B, Shackell N L. 2007. The ups and downs of trophic control in continental shelf ecosystems. Trends in Ecology & Evolution, 22(5): 236–242. doi: 10.1016/j.tree.2007.03.002 Gaither M R, Bowen B W, Bordenave T R, et al. 2011. Phylogeography of the reef fish Cephalopholis argus (Epinephelidae) indicates Pleistocene isolation across the Indo-Pacific Barrier with contemporary overlap in the Coral Triangle. BMC Evolutionary Biology, 11: 189. doi: 10.1186/1471-2148-11-189 Gates R D. 1990. Seawater temperature and sublethal coral bleaching in Jamaica. Coral Reefs, 8(4): 193–197. doi: 10.1007/BF00265010 Glynn P W, Enochs I C. 2011. Invertebrates and their roles in coral reef ecosystems. In: Dubinsky Z, Stambler N, eds. Coral Reefs: An Ecosystem in Transition. Dordrecht: Springer, 273–325 Godinot C, Houlbrèque F, Grover R, et al. 2011. Coral uptake of inorganic phosphorus and nitrogen negatively affected by simultaneous changes in temperature and pH. PLoS ONE, 6(9): e25024. doi: 10.1371/journal.pone.0025024 González-Rivero M, Bongaerts P, Beijbom O, et al. 2014. The catlin seaview survey-kilometre-scale seascape assessment, and monitoring of coral reef ecosystems. Aquatic Conservation: Marine and Freshwater Ecosystems, 24(S2): 184–198. doi: 10.1002/aqc.2505 Heenan A, Williams I D, Acoba T, et al. 2017. Long-term monitoring of coral reef fish assemblages in the western central Pacific. Scientific Data, 4: 170176. doi: 10.1038/sdata.2017.176 Heymans J. 2003. Comparing the Newfoundland marine ecosystem models using Information Theory. Fisheries Centre Research Reports, 11(5): 62–71 Heymans J J, Coll M, Libralato S, et al. 2011. Ecopath theory, modeling, and application to coastal ecosystems. Treatise on Estuarine and Coastal Science, 9: 93–113 Heymans J J, Coll M, Link J S, et al. 2016. Best practice in Ecopath with Ecosim food-web models for ecosystem-based management. Ecological Modelling, 331: 173–184. doi: 10.1016/j.ecolmodel.2015.12.007 Hixon M A, Randall J E. 2019. Coral reef fishes. Encyclopedia of Ocean Sciences, 2: 142–150 Hodgson G. 1999. A global assessment of human effects on coral reefs. Marine Pollution Bulletin, 38(5): 345–355. doi: 10.1016/S0025-326X(99)00002-8 Hoegh-Guldberg O, Mumby P J, Hooten A J, et al. 2007. Coral reefs under rapid climate change and ocean acidification. Science, 318(5857): 1737–1742. doi: 10.1126/science.1152509 Houlbrèque F, Tambutté E, Ferrier-Pagès C. 2003. Effect of zooplankton availability on the rates of photosynthesis, and tissue and skeletal growth in the scleractinian coral Stylophora pistillata. Journal of Experimental Marine Biology and Ecology, 296(2): 145–166. doi: 10.1016/S0022-0981(03)00259-4 Huang Zirong, Chen Zuozhi, Zeng Xiaoguang. 2009. Species composition and resources density of Chondrichthyes in the continental shelf of northern South China Sea. Journal of Oceanography in Taiwan Strait, 28(1): 38–44 Huang Danwei, Licuanan W Y, Hoeksema B W, et al. 2015. Extraordinary diversity of reef corals in the South China Sea. Marine Biodiversity, 45(2): 157–168. doi: 10.1007/s12526-014-0236-1 Huang Jianhong, Wang Fengxia, Zhao Hongwei, et al. 2020. Reef benthic composition and coral communities at the Wuzhizhou Island in the South China Sea: the impacts of anthropogenic disturbance. Estuarine, Coastal and Shelf Science, 243: 106863, Huang Hui, Zhang Chenglong, Yang Jianhui, et al. 2012. Scleractinian coral community characteristics in Zhubi reef sea area of Nansha Islands. Journal of Oceanography in Taiwan Strait, 31(1): 79–84 Hughes T P, Rodrigues M J, Bellwood D R, et al. 2007. Phase shifts, herbivory, and the resilience of coral reefs to climate change. Current Biology, 17(4): 360–365. doi: 10.1016/j.cub.2006.12.049 Ippolito S, Naudot V, Noonburg E G. 2016. Alternative stable states, coral reefs, and smooth dynamics with a kick. Bulletin of Mathematical Biology, 78(3): 413–435. doi: 10.1007/s11538-016-0148-2 Jiao Nianzhi, Chen Dake, Luo Yongming, et al. 2015. Climate change and anthropogenic impacts on marine ecosystems and countermeasures in China. Advances in Climate Change Research, 6(2): 118–125. doi: 10.1016/j.accre.2015.09.010 Jokiel P L. 2016. Predicting the impact of ocean acidification on coral reefs: evaluating the assumptions involved. ICES Journal of Marine Science, 73(3): 550–557. doi: 10.1093/icesjms/fsv091 Karim E, Liu Qun, Xue Ying, et al. 2019. Trophic structure and energy flow of the resettled maritime area of the Bay of Bengal, Bangladesh through ECOPATH. Acta Oceanologica Sinica, 38(10): 27–42. doi: 10.1007/s13131-019-1423-5 Ke Zhixin, Tan Yehui, Huang Liangmin, et al. 2018. Spatial distribution patterns of phytoplankton biomass and primary productivity in six coral atolls in the central South China Sea. Coral Reefs, 37(3): 919–927. doi: 10.1007/s00338-018-1717-7 Kim T W, Lee K, Duce R, et al. 2014. Impact of atmospheric nitrogen deposition on phytoplankton productivity in the South China Sea. Geophysical Research Letters, 41(9): 3156–3162. doi: 10.1002/2014gl059665 Knowlton N. 2001. Coral reef biodiversity-habitat size matters. Science, 292(5521): 1493–1495. doi: 10.1126/science.1061690 Landi P, Minoarivelo H O, Brännström Å, et al. 2018. Complexity and stability of ecological networks: a review of the theory. Population Ecology, 60(4): 319–345. doi: 10.1007/s10144-018-0628-3 Li Yuanjie, Chen Zuozhi, Zhang Jun, et al. 2020. Species and taxonomic diversity of Qilianyu Island reef fish in the Xisha Islands. Journal of Fishery Sciences of China, 27(7): 815–823 Li Yuanchao, Chen Shiquan, Zheng Xinqing, et al. 2018. Analysis of the change of hermatypic corals in Yongxing Island and Qilianyu Island in nearly a decade. Haiyang Xuebao (in Chinese), 40(8): 97–109 Li Yuanchao, Liang Jilin, Wu Zhongjie, et al. 2019a. Outbreak and prevention of Acanthaster planci. Ocean Development and Management, 36(8): 9–12 Li Xiong, Wang Hao, Zhang Zheng, et al. 2014. Mathematical analysis of coral reef models. Journal of Mathematical Analysis and Applications, 416(1): 352–373. doi: 10.1016/j.jmaa.2014.02.053 Li Yuanchao, Wu Zhongjie, Chen Shiquan, et al. 2017. Discussion of the diversity of the coral reef fish in the shallow reefs along the Yongxing and Qilianyu Island. Marine Environmental Science, 36(4): 509–516 Li Yuanchao, Wu Zhongjie, Liang Jilin, et al. 2019b. Analysis on the outbreak period and cause of Acanthaster planci in Xisha Islands in recent 15 years. Chinese Science Bulletin, 64(33): 3478–3484. doi: 10.1360/tb-2019-0152 Libralato S, Christensen V, Pauly D. 2006. A method for identifying keystone species in food web models. Ecological Modelling, 195(3–4): 153–171, Lindeman R L. 1942. The trophic-dynamic aspect of ecology. Ecology, 23(4): 399–417. doi: 10.2307/1930126 Link J S. 2010. Adding rigor to ecological network models by evaluating a set of pre-balance diagnostics: a plea for PREBAL. Ecological Modelling, 221(12): 1580–1591. doi: 10.1016/j.ecolmodel.2010.03.012 Liu P J, Shao K T, Jan R Q, et al. 2009. A trophic model of fringing coral reefs in Nanwan Bay, southern Taiwan suggests overfishing. Marine Environmental Research, 68(3): 106–117. doi: 10.1016/j.marenvres.2009.04.009 Lough J M. 2011. Climate change and coral reefs. In: Hopley D, ed. Encyclopedia of Modern Coral Reefs. Encyclopedia of Earth Sciences Series. Dordrecht: Springer, Luo Zhongyuan, Li Jiangtao, Jia Guodong. 2019. The geochemical significance of deep-water coral and their food source. Advances in Earth Science, 34(12): 1234–1242. doi: 10.11867/j.issn.1001-8166.2019.12.1234 MacNeil M A, Graham N A J, Cinner J E, et al. 2015. Recovery potential of the world’s coral reef fishes. Nature, 520(7547): 341–344. doi: 10.1038/nature14358 Mak K K W, Yanase H, Renneberg R. 2005. Cyanide fishing and cyanide detection in coral reef fish using chemical tests and biosensors. Biosensors and Bioelectronics, 20(12): 2581–2593. doi: 10.1016/j.bios.2004.09.015 Mantyka C S, Bellwood D R. 2007. Direct evaluation of macroalgal removal by herbivorous coral reef fishes. Coral Reefs, 26(2): 435–442. doi: 10.1007/s00338-007-0214-1 Mason P, Varnell L M. 1996. Detritus: mother nature’s rice cake. Wetlands Program Technical Report no. 96-10. Gloucester Point, Virginia: Virginia Institute of Marine Science, College of William and Mary, McCook L J, Almany G R, Berumen M L, et al. 2009. Management under uncertainty: guide-lines for incorporating connectivity into the protection of coral reefs. Coral Reefs, 28(2): 353–366. doi: 10.1007/s00338-008-0463-7 McCormick M I, Barry R P, Allan B J M. 2017. Algae associated with coral degradation affects risk assessment in coral reef fishes. Scientific Reports, 7(1): 16937. doi: 10.1038/s41598-017-17197-1 Melbourne-Thomas J, Johnson C R, Fung T, et al. 2011. Regional-scale scenario modeling for coral reefs: a decision support tool to inform management of a complex system. Ecological Applications, 21(4): 1380–1398. doi: 10.1890/09-1564.1 Mills M M, Lipschultz F, Sebens K P. 2004. Particulate matter ingestion and associated nitrogen uptake by four species of scleractinian corals. Coral Reefs, 23(3): 311–323. doi: 10.1007/s00338-004-0380-3 Mouillot D, Graham N A J, Villéger S, et al. 2013. A functional approach reveals community responses to disturbances. Trends in Ecology & Evolution, 28(3): 167–177. doi: 10.1016/j.tree.2012.10.004 Muallil R N, Tambihasan A M, Enojario M J, et al. 2020. Inventory of commercially important coral reef fishes in Tawi-Tawi Islands, Southern Philippines: the Heart of the Coral Triangle. Fisheries Research, 230: 105640. doi: 10.1016/j.fishres.2020.105640 Mumby P J, Dahlgren C P, Harborne A R, et al. 2006. Fishing, trophic cascades, and the process of grazing on coral reefs. Science, 311(5757): 98–101. doi: 10.1126/science.1121129 Nixon S W, Oviatt C A, Frithsen J, et al. 1986. Nutrients and the productivity of estuarine and coastal marine ecosystems. Journal of the Limnological Society of Southern Africa, 12(1–2): 43–71, Odum E P. 1969. The strategy of ecosystem development. Science, 164(3877): 262–270. doi: 10.1126/science.164.3877.262 Ortiz M, Berrios F, Campos L, et al. 2015. Mass balanced trophic models and short-term dynamical simulations for benthic ecological systems of Mejillones and Antofagasta Bays (SE Pacific): comparative network structure and assessment of human impacts. Ecological Modelling, 309–310: 153–162, Palomares M L D, Pauly D. 1998. Predicting food consumption of fish populations as functions of mortality, food type, morphometrics, temperature and salinity. Marine and Freshwater Research, 49(5): 447–453. doi: 10.1071/MF98015 Pauly D, Christensen V, Dalsgaard J, et al. 1998. Fishing down marine food webs. Science, 279(5352): 860–863. doi: 10.1126/science.279.5352.860 Pauly D, Christensen V, Walters C. 2000. Ecopath, Ecosim, and Ecospace as tools for evaluating ecosystem impact of fisheries. ICES Journal of Marine Science, 57(3): 697–706. doi: 10.1006/jmsc.2000.0726 Pauly D, Palomares M L D. 2005. Fishing down marine food web: it is far more pervasive than we thought. Bulletin of Marine Science, 76(2): 197–211 Pauly D, Soriano-Bartz M L, Palomares M L D. 1993. Improved construction, parametrization and interpretation of steady-state ecosystem models. In: Christensen V, Pauly D, eds. Trophic Models of Aquatic Ecosystems. Manila: ICLARM Conference Proceeding Pérez-Ruzafa A, Morkune R, Marcos C, et al. 2020. Can an oligotrophic coastal lagoon support high biological productivity? Sources and pathways of primary production. Marine Environmental Research, 153: 104824. doi: 10.1016/j.marenvres.2019.104824 Petit T, Bajjouk T, Mouquet P, et al. 2017. Hyperspectral remote sensing of coral reefs by semi-analytical model inversion—Comparison of different inversion setups. Remote Sensing of Environment, 190: 348–365. doi: 10.1016/j.rse.2017.01.004 Pimm S L, Lawton J H, Cohen J E. 1991. Food web patterns and their consequences. Nature, 350(6320): 669–674. doi: 10.1038/350669a0 Polovina J J. 1984. Model of a coral reef ecosystem. Coral Reefs, 3(1): 1–11. doi: 10.1007/BF00306135 Qin Zhenjun, Yu Kefu, Chen Shuchang, et al. 2021. Microbiome of juvenile corals in the outer reef slope and lagoon of the South China Sea: insight into coral acclimatization to extreme thermal environments. Environmental Microbiology, 23(8): 4389–4404. doi: 10.1111/1462-2920.15624 Reimer J D, Kise H, Wee H B, et al. 2019. Crown-of-thorns starfish outbreak at oceanic Dongsha Atoll in the northern South China Sea. Marine Biodiversity, 49(6): 2495–2497. doi: 10.1007/s12526-019-01021-2 Ruiz D J, Banks S, Wolff M. 2016. Elucidating fishing effects in a large-predator dominated system: the case of Darwin and Wolf Islands (Galápagos). Journal of Sea Research, 107: 1–11. doi: 10.1016/j.seares.2015.11.001 Russo G F, Fasulo G, Toscano A, et al. 1990. On the presence of triton species (Charonia spp. ) (Mollusca Gastropoda) in the Mediterranean Sea: ecological considerations. Bollettino Malacologico, 26: 91–104 Shang Yiwei, Xiao Wupeng, Liu Xin, et al. 2018. Variations of pico-phytoplankton groups and carbon to chlorophyll-a ratios in the South China Sea at the SEATS station. Journal of Xiamen University (Natural Science), 57(6): 811–818 Shao K T, Ho H C, Lin P L, et al. 2008. A checklist of the fishes of southern Taiwan, northern South China Sea. The Raffles Bulletin of Zoology, 19: 233–271 Spillman C M, Alves O. 2009. Dynamical seasonal prediction of summer sea surface temperatures in the Great Barrier Reef. Coral Reefs, 28(1): 197–206. doi: 10.1007/s00338-008-0438-8 Steel E A, McElhany P, Yoder N J, et al. 2009. Making the best use of modeled data: multiple approaches to sensitivity analysis of a fish-habitat model. Fisheries, 34(7): 330–339. doi: 10.1577/1548-8446-34.7.330 Tang Shilin, Chen Chuqun, Zhan Haigang, et al. 2007. Retrieval of euphotic layer depth of South China Sea by remote sensing. Journal of Tropical Oceanography, 26(1): 9–15 Tebbett S B, Bellwood D R. 2020. Sediments ratchet-down coral reef algal turf productivity. Science of the Total Environment, 713: 136709. doi: 10.1016/j.scitotenv.2020.136709 Tebbett S B, Goatley C H R, Streit R P, et al. 2020. Algal turf sediments limit the spatial extent of function delivery on coral reefs. Science of the Total Environment, 734: 139422. doi: 10.1016/j.scitotenv.2020.139422 Ulanowicz R E, Puccia C J. 1990. Mixed trophic impacts in ecosystems. Coenoses, 5(1): 7–16 Wabnitz C C C, Balazs G, Beavers S, et al. 2010. Ecosystem structure and processes at Kaloko Honokohau, focusing on the role of herbivores, including the green sea turtle Chelonia mydas, in reef resilience. Marine Ecology Progress Series, 420: 27–44. doi: 10.3354/meps08846 Walters C J, Martell S J D. 2004. Fisheries Ecology and Management. Princeton: Princeton University Press Walters C, Martell S J D, Christensen V, et al. 2008. An ecosim model for exploring gulf of Mexico ecosystem management options: implications of including multistanza life-history models for policy predictions. Bulletin of Marine Science, 83(1): 251–271 Wang Geng, Guan Xiaoxi. 2020. Research status and hot spot analysis of a coral reef ecosystem model. Acta Ecologica Sinica, 40(4): 1496–1503 Williams G J, Gove J M, Eynaud Y, et al. 2015. Local human impacts decouple natural biophysical relationships on Pacific coral reefs. Ecography, 38(8): 751–761. doi: 10.1111/ecog.01353 Wilmes J C, Schultz D J, Hoey A S, et al. 2020. Habitat associations of settlement-stage crown-of-thorns starfish on Australia’s Great Barrier Reef. Coral Reefs, 39(4): 1163–1174. doi: 10.1007/s00338-020-01950-6 Wu Zhongjie, Wang Daoru, Tu Zhigang, et al. 2011. The analysis on the reason of hermatypic coral degradation in Xisha. Acta Oceanologica Sinica, 33(4): 140–146 Wu Dan, Zhang Fenfen, Zhang Xiaodi, et al. 2021. Stable isotopes (δ13C and δ15 N) in black coral as new proxies for environmental record. Marine Pollution Bulletin, 164: 112007. doi: 10.1016/j.marpolbul.2021.112007 Xie Fuwu, Liang Jilin, Xing Kongmin, et al. 2019. Characteristics of zooplankton community structure in the eastern and southern offshore coral reef areas of Hainan in summer. Marine Sciences, 43(7): 87–95 Xu Shendong, Zhang Zhinan, Yu Kefu, et al. 2021. Spatial variations in the trophic status of Favia palauensis corals in the South China Sea: insights into their different adaptabilities under contrasting environmental conditions. Science China Earth Sciences, 64(6): 839–852. doi: 10.1007/s11430-020-9774-0 Yang Junyi. 2017. Spectral analysis and classification of coral reefs around Qilian Yu in the Xisha Islands (in Chinese)[dissertation]. Guangzhou: Guangzhou University Yang Rui. 2019. The study of microbial communities and their potentiality to be environmental indicators of surface layer sediments in Xuande Atoll, the South China Sea (in Chinese)[dissertation]. Beijing: China University of Geosciences (Beijing) Yu Kefu. 2012. Coral reefs in the South China Sea: their response to and records on past environmental changes. Science China Earth Sciences, 55(8): 1217–1229. doi: 10.1007/s11430-012-4449-5 Zhang Jun, Chen Guobao, Chen Zuozhi, et al. 2016. Application of hydroacoustics to investigate the distribution, diel movement, and abundance of fish on Zhubi Reef, Nansha Islands, South China Sea. Chinese Journal of Oceanology and Limnology, 34(5): 964–976. doi: 10.1007/s00343-016-5019-z Zhang Jun, Chen Zuozhi, Dong Junde, et al. 2020a. Variation in the population characteristics of blue-striped snapper Lutjanus kasmira in the South China Sea in recent 20 years. Oceanologia et Limnologia Sinica, 51(1): 114–124 Zhang Ting, Lin Liu, Jian Li, et al. 2020b. Investigation of beach debris at spawning ground of Green Sea Turtles (Chelonia mydas) at Qilianyu Islands, northeastern Xisha Islands. Chinese Journal of Ecology, 39(7): 2408–2415 Zhang Lüping, Xia Jianjun, Peng Pengfei, et al. 2013. Characterization of embryogenesis and early larval development in the Pacific triton, Charonia tritonis (Gastropoda: Caenogastropoda). Invertebrate Reproduction & Development, 57(3): 237–246. doi: 10.1080/07924259.2012.753472 -


 点击查看大图
计量
- 文章访问数: 466
- HTML全文浏览量: 139
- PDF下载量: 27
- 被引次数: 0

