

Impacts of human activities on morphological evolution in the Modaomen Estuary, China
-
Abstract: The morphology of the Modaomen Estuary (ME) has undergone drastic changes in recent decades, and quantifying the contribution of human activities and natural processes is crucial for estuary management. Using Landsat images, chart data, and hydrological and meteorological data, this study analyzed the evolution of the shoreline and subaqueous topography of the ME and attempted to quantify the extent of the contributions of human activities. The results show that local human activities dominated morphological evolution in some periods. From 1973 to 2003, the shoreline advanced rapidly seaward, resulting in approximately half of the water area being converted into land. Human activity is critical to this process, with the direct contribution of local land reclamation projects reaching more than 85%. After 2003, the shoreline remained relatively stable, probably due to a decrease in land reclamation projects. Regarding the evolution of subaqueous topography, the shoals in the estuary were heavily silted and gradually disappeared during 1983–2003, and the waterways narrowed and deepened. The average siltation rate decreased from 15.43 mm/a to −1.02 mm/a, indicating that the ME changed from sedimentation to slight erosion. By detecting variations of sediment load, we found that upstream human activities reduced river sediment, while downstream human activities significantly increased sediment input to the ME, leaving little change in the actual sediment input to the ME for a relatively long period. In addition, based on the empirical relationship between the sediment input and siltation rate, local human activities influenced the shift in the siltation state more than upstream and downstream human activities did. These findings suggest that more attention should be paid to local human activities to improve the estuarine management in the ME.
-
Key words:
- Modaomen Estuary /
- morphological evolution /
- human activity /
- quantitative analysis
-

Figure 1. Geographical location of the study area. The Zhujiang River Delta (ZRD) comprises the marked study area and the study region with detailed geographic information. The three major tributaries of the Zhujiang River (Dongjiang River, Beijiang River, and Xijiang River) and eight main outlets (Humen, Jiaomen, Hongqimen, Hengmen, Modaomen, Jitimen, Hutiaomen, and Yamen) are shown. The major cities in the ZRD are marked. Blue triangles represent the Makou, Gaoyao, Tianhe, Left Denglongshan, and Right Denglongshan hydrological stations. The bottom right panel exhibits the geographic information of Modaomen Estuary where this study is focused. N.: North; S.: South; I.: Island.
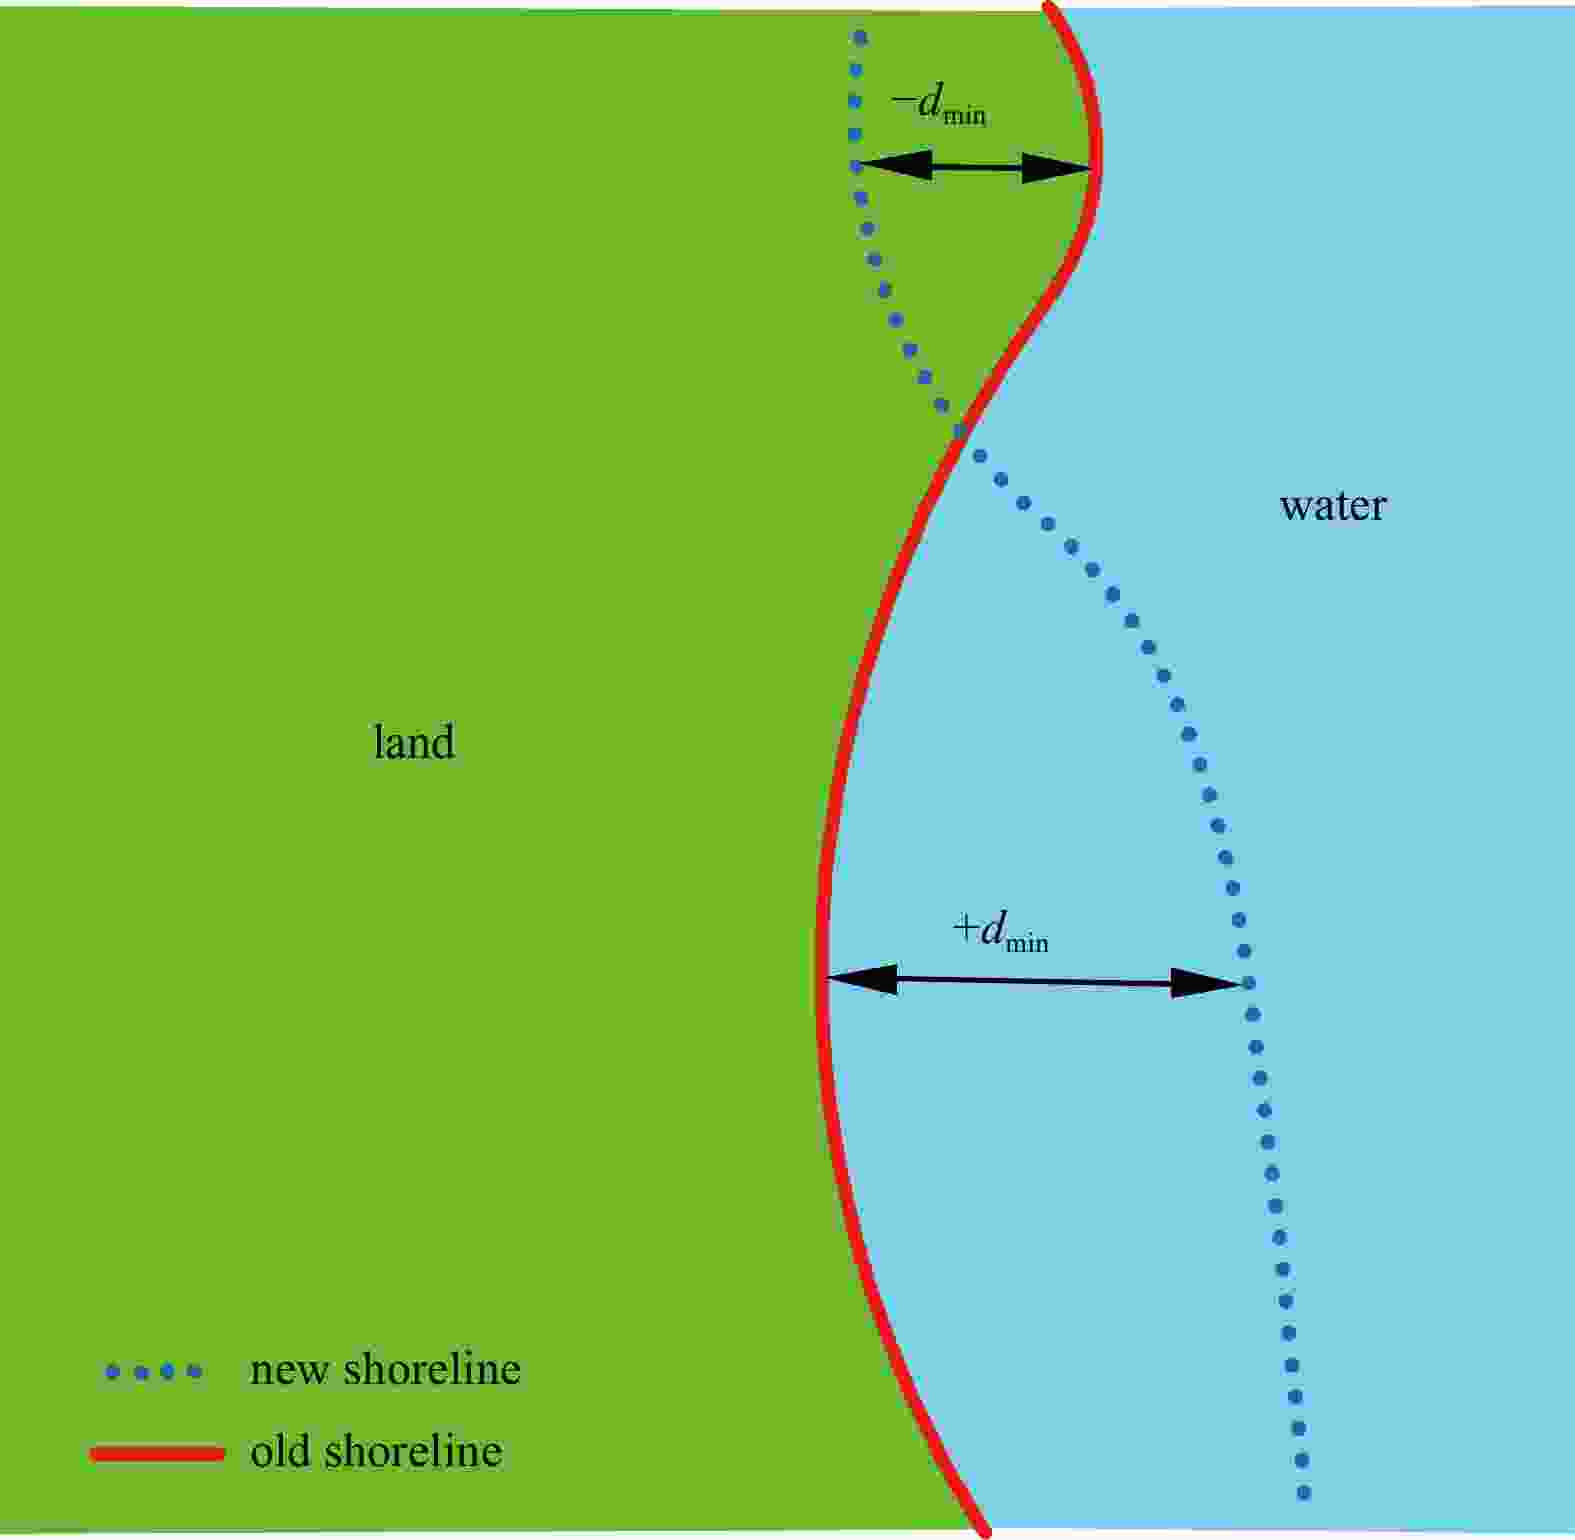
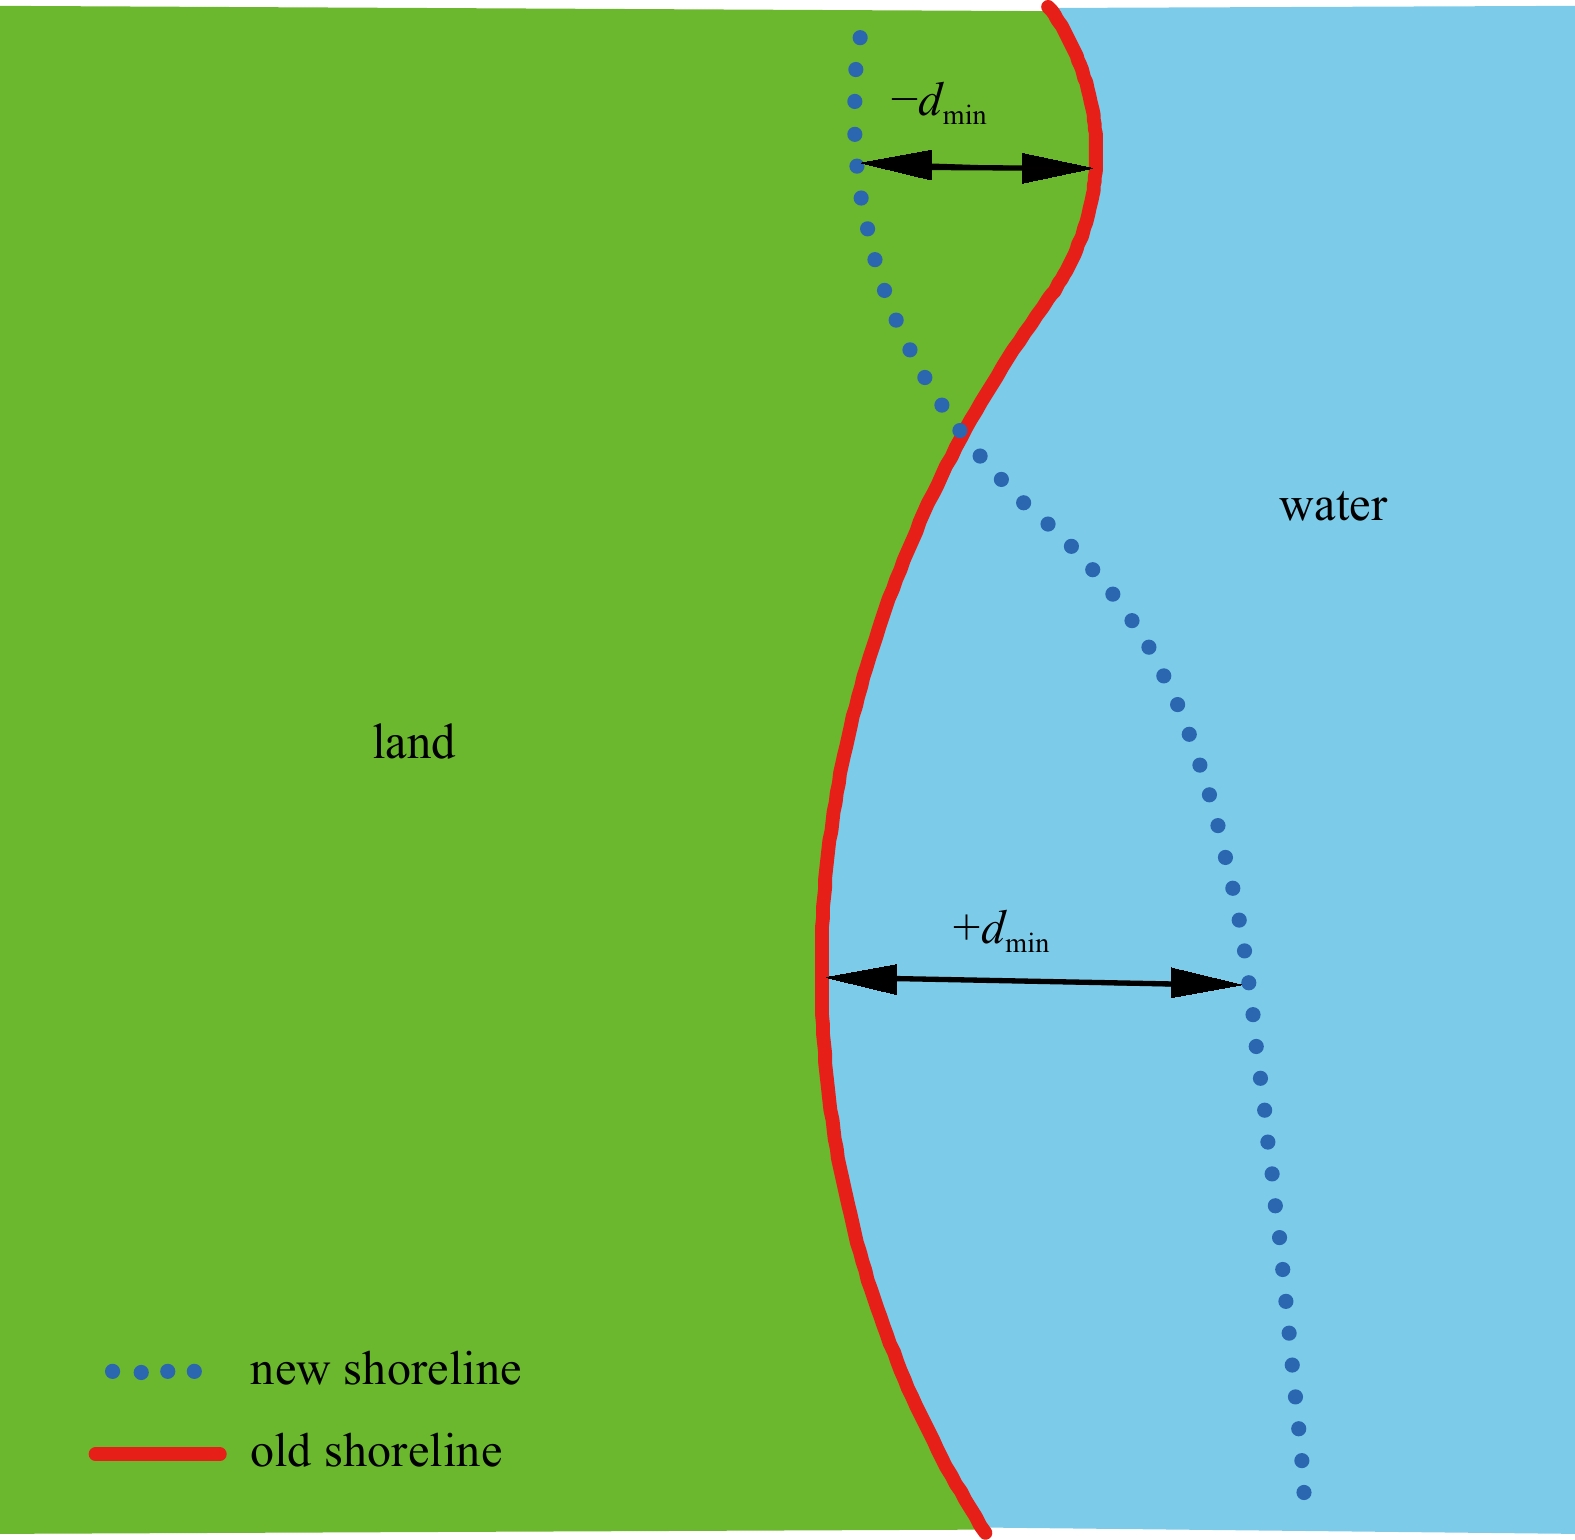
Figure 2. Parameter definition of the point-based algorithm for calculating shoreline change rate.
$ {d}_{\mathrm{m}\mathrm{i}\mathrm{n}} $ indicates the minimum distance between the point on the new shoreline and the old shoreline.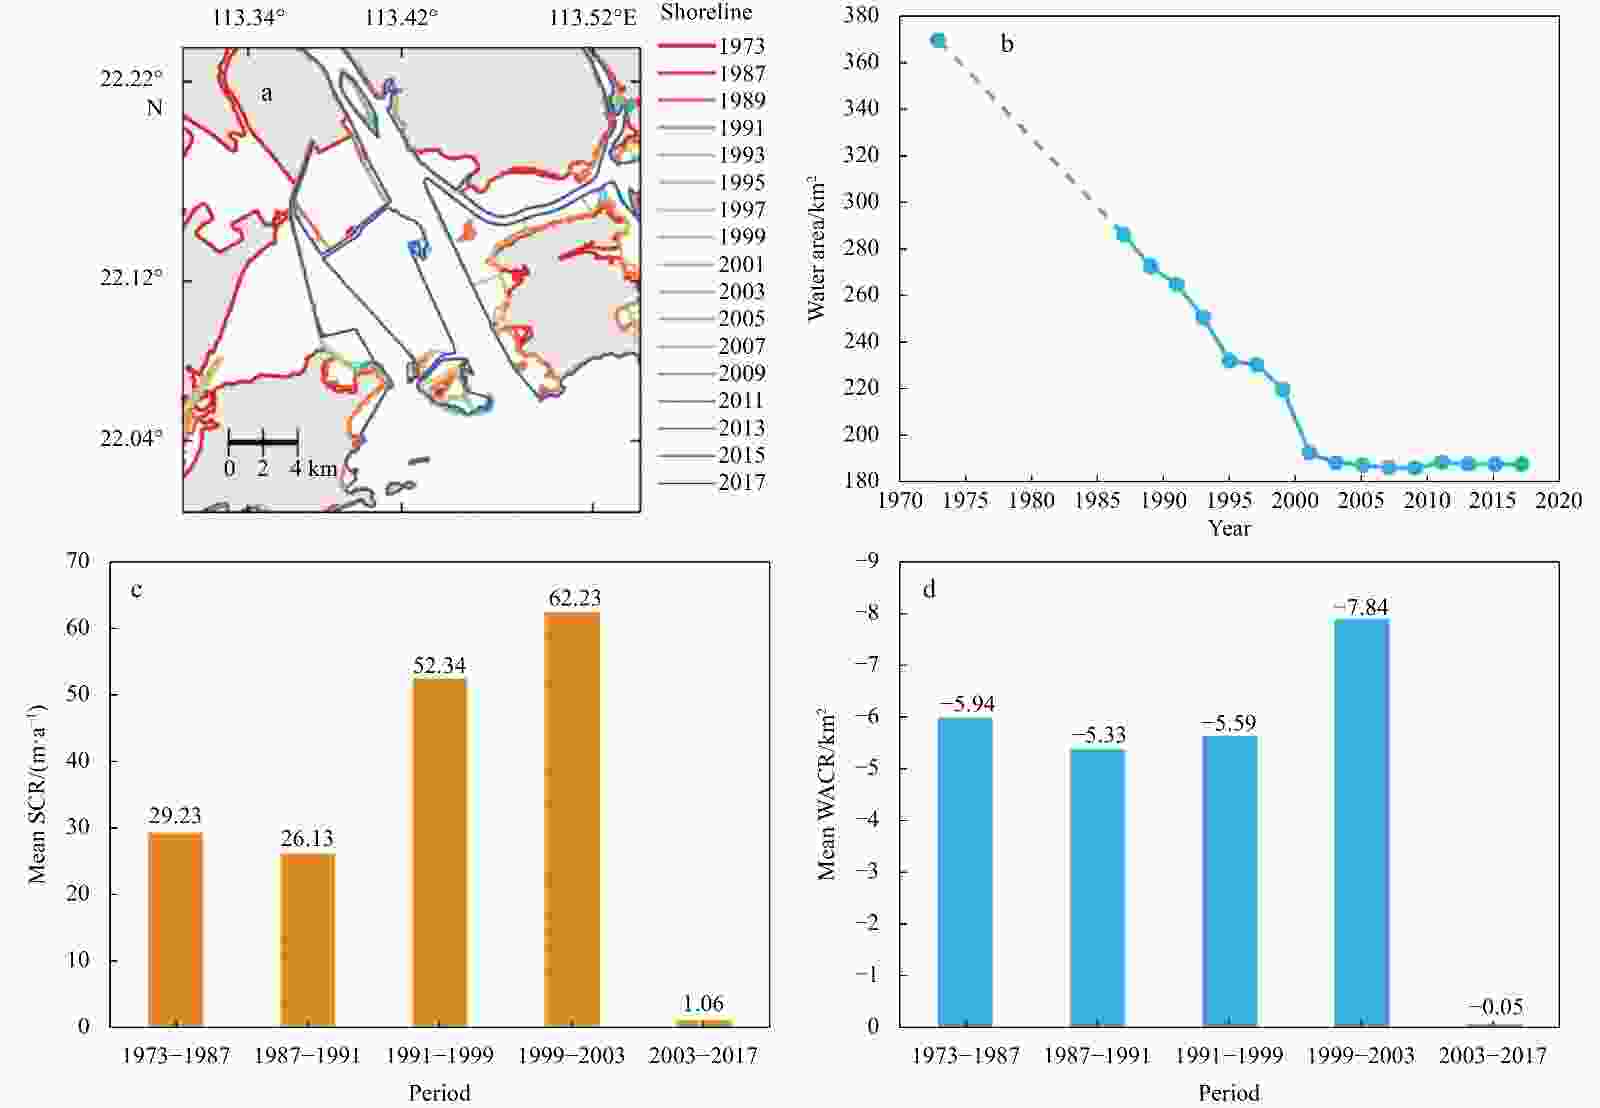
Figure 3. Historical shoreline position (a), water area with study region in each year (b), mean shoreline change rate (SCR) in five intervals (c), and surface mean water area change rates in five intervals (d). WACR: water area change rate.
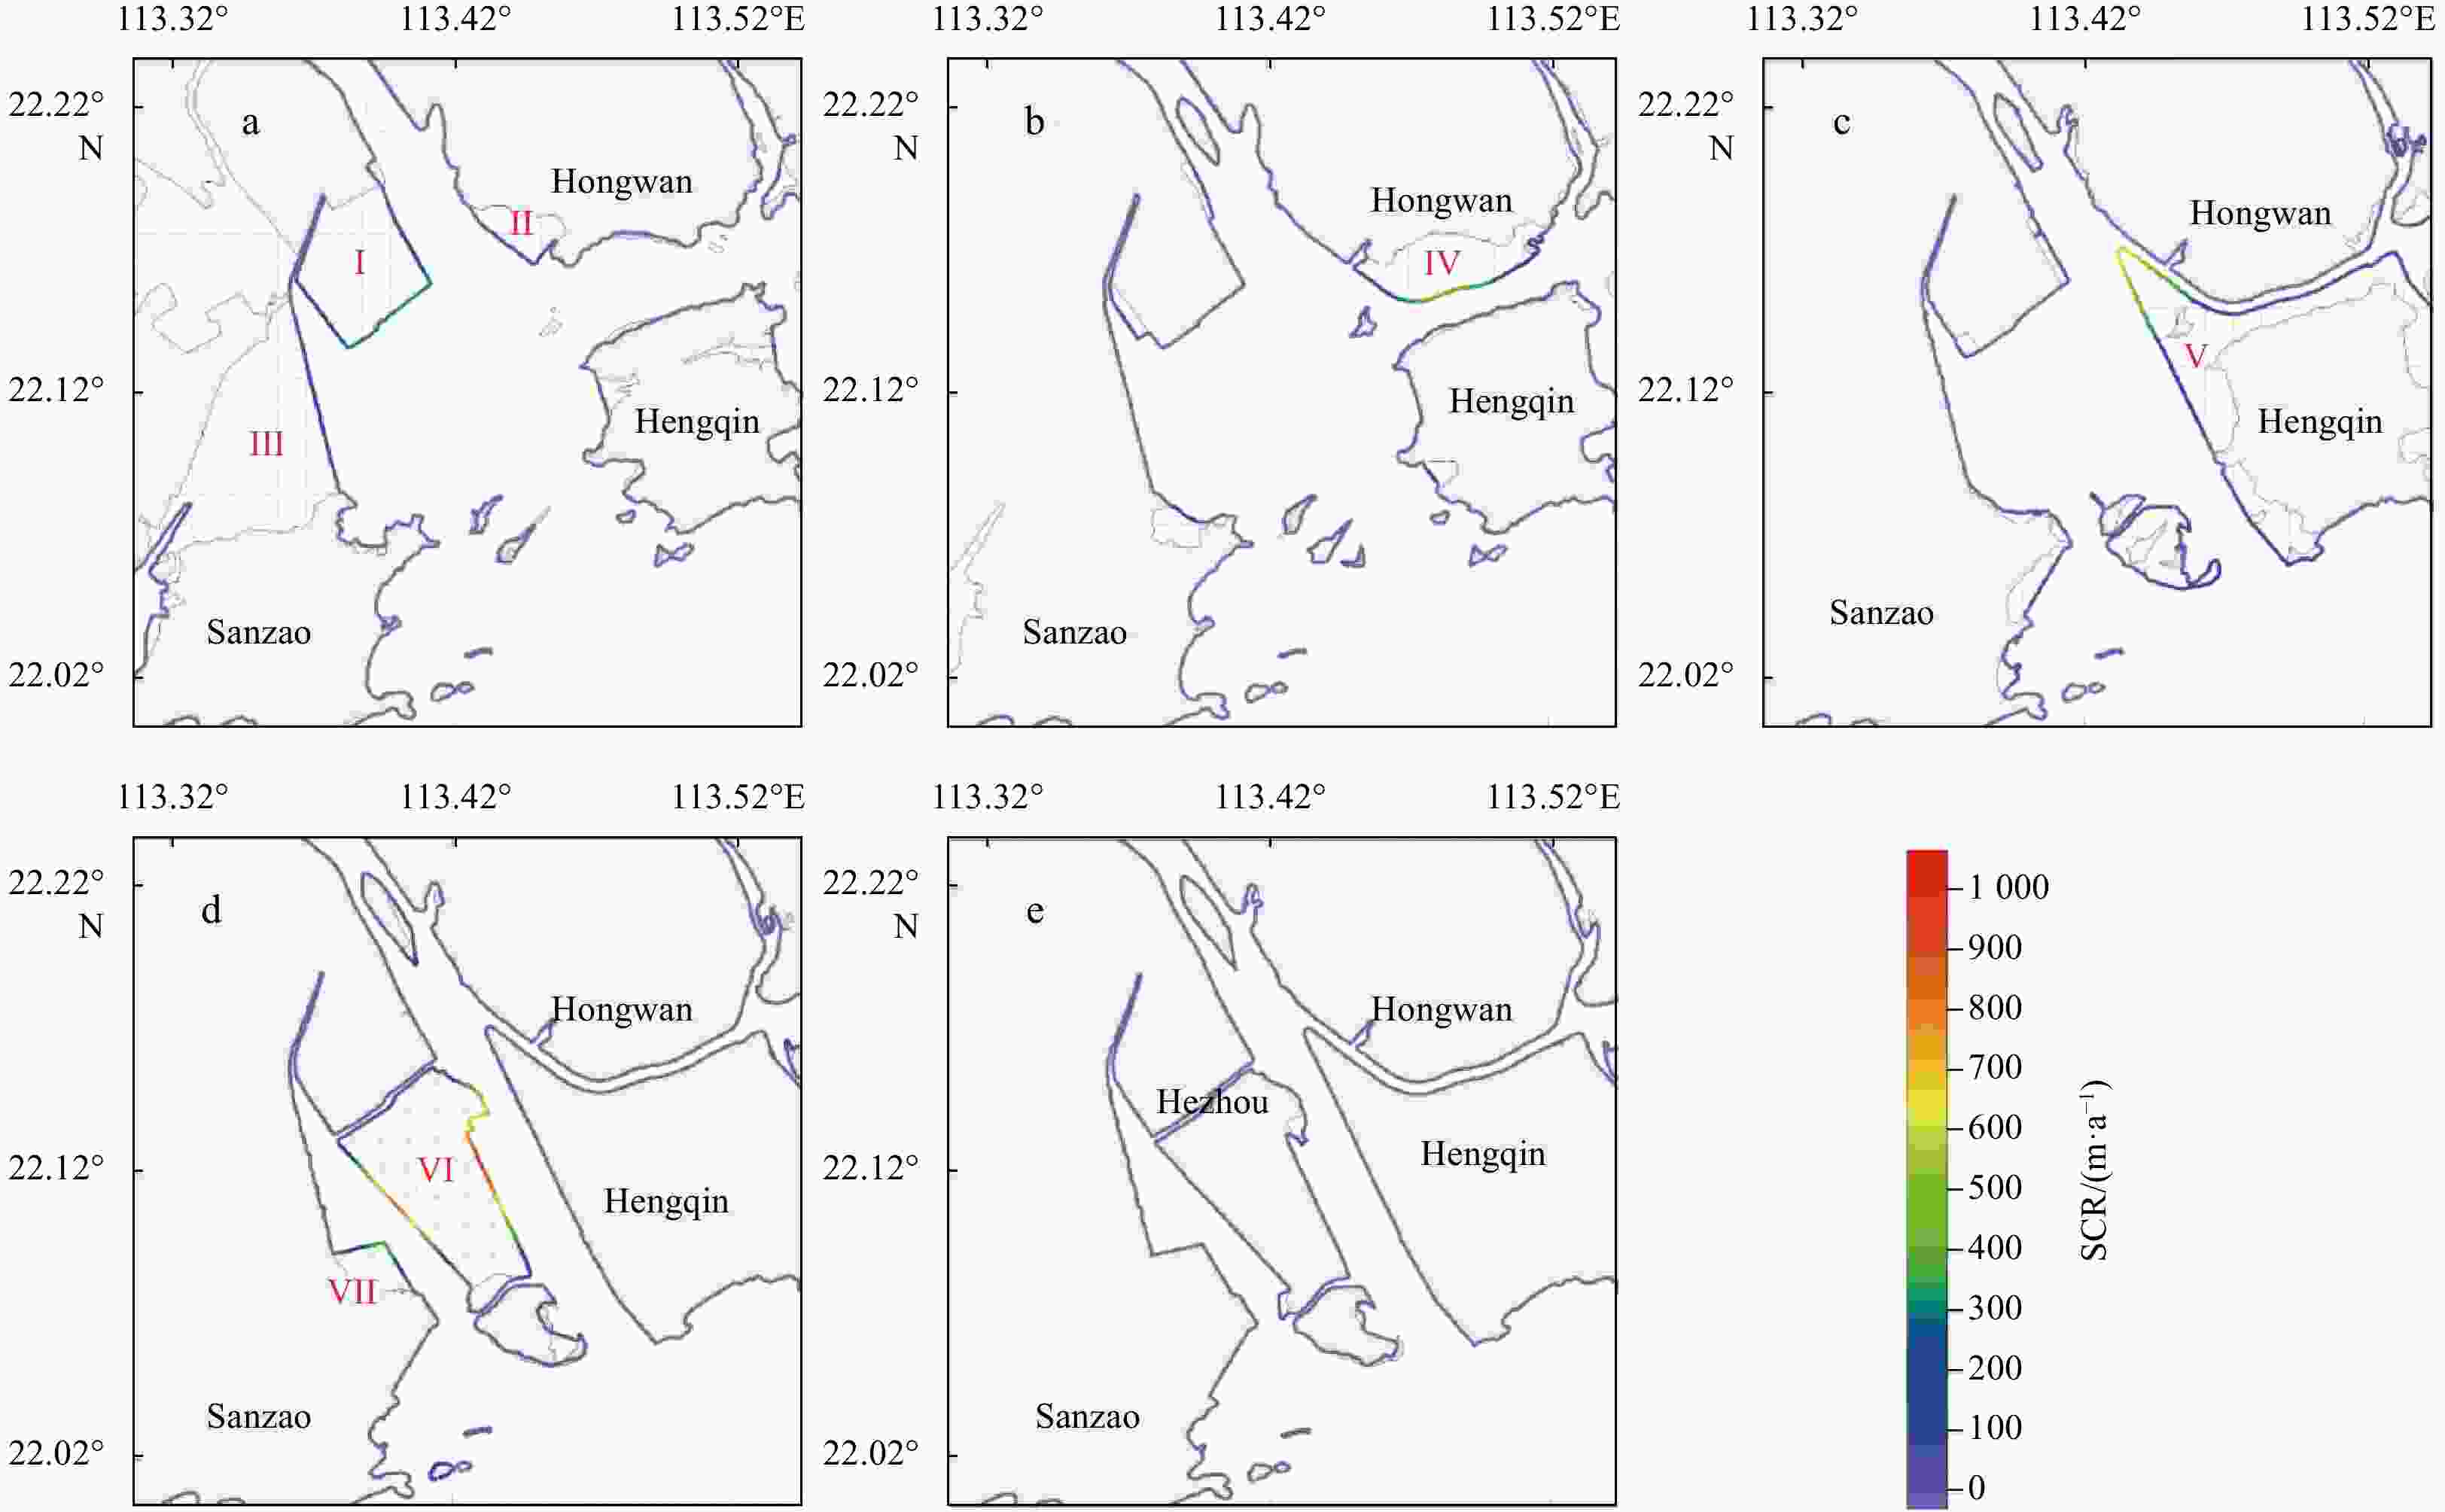
Figure 4. Spatial distribution of shoreline change rate (SCR) in the Modaomen Estuary during the five divided periods. From a to e, the panels denote 1973–1987, 1987–1991, 1991–1999, 1999–2003, and 2003–2017, respectively.
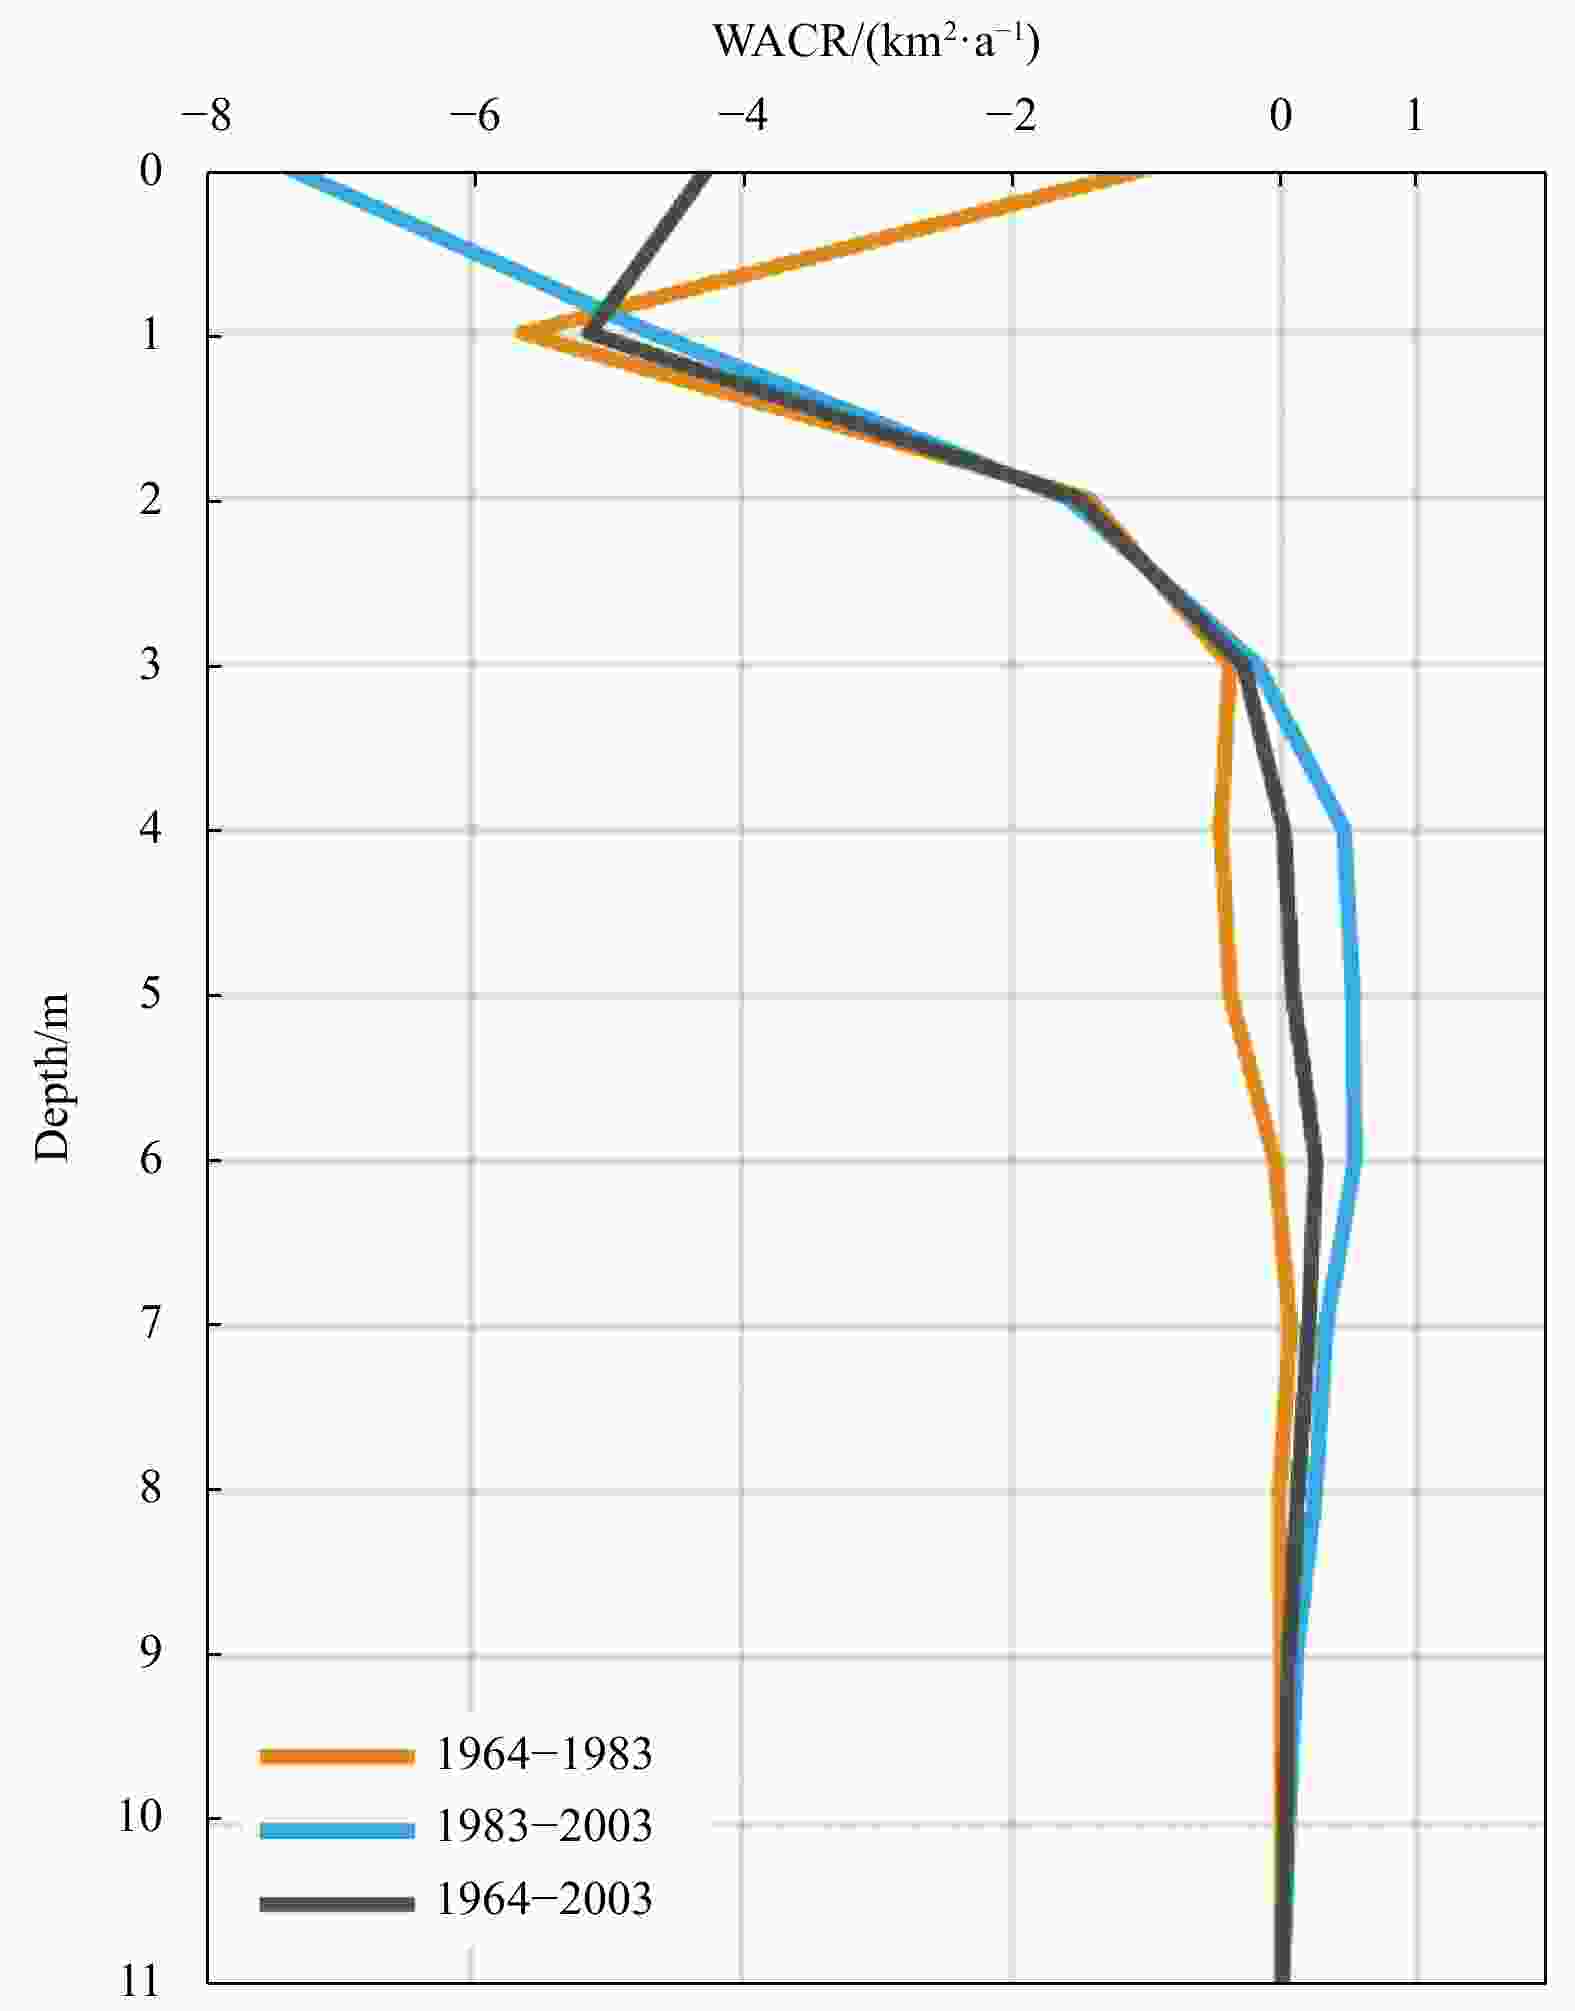
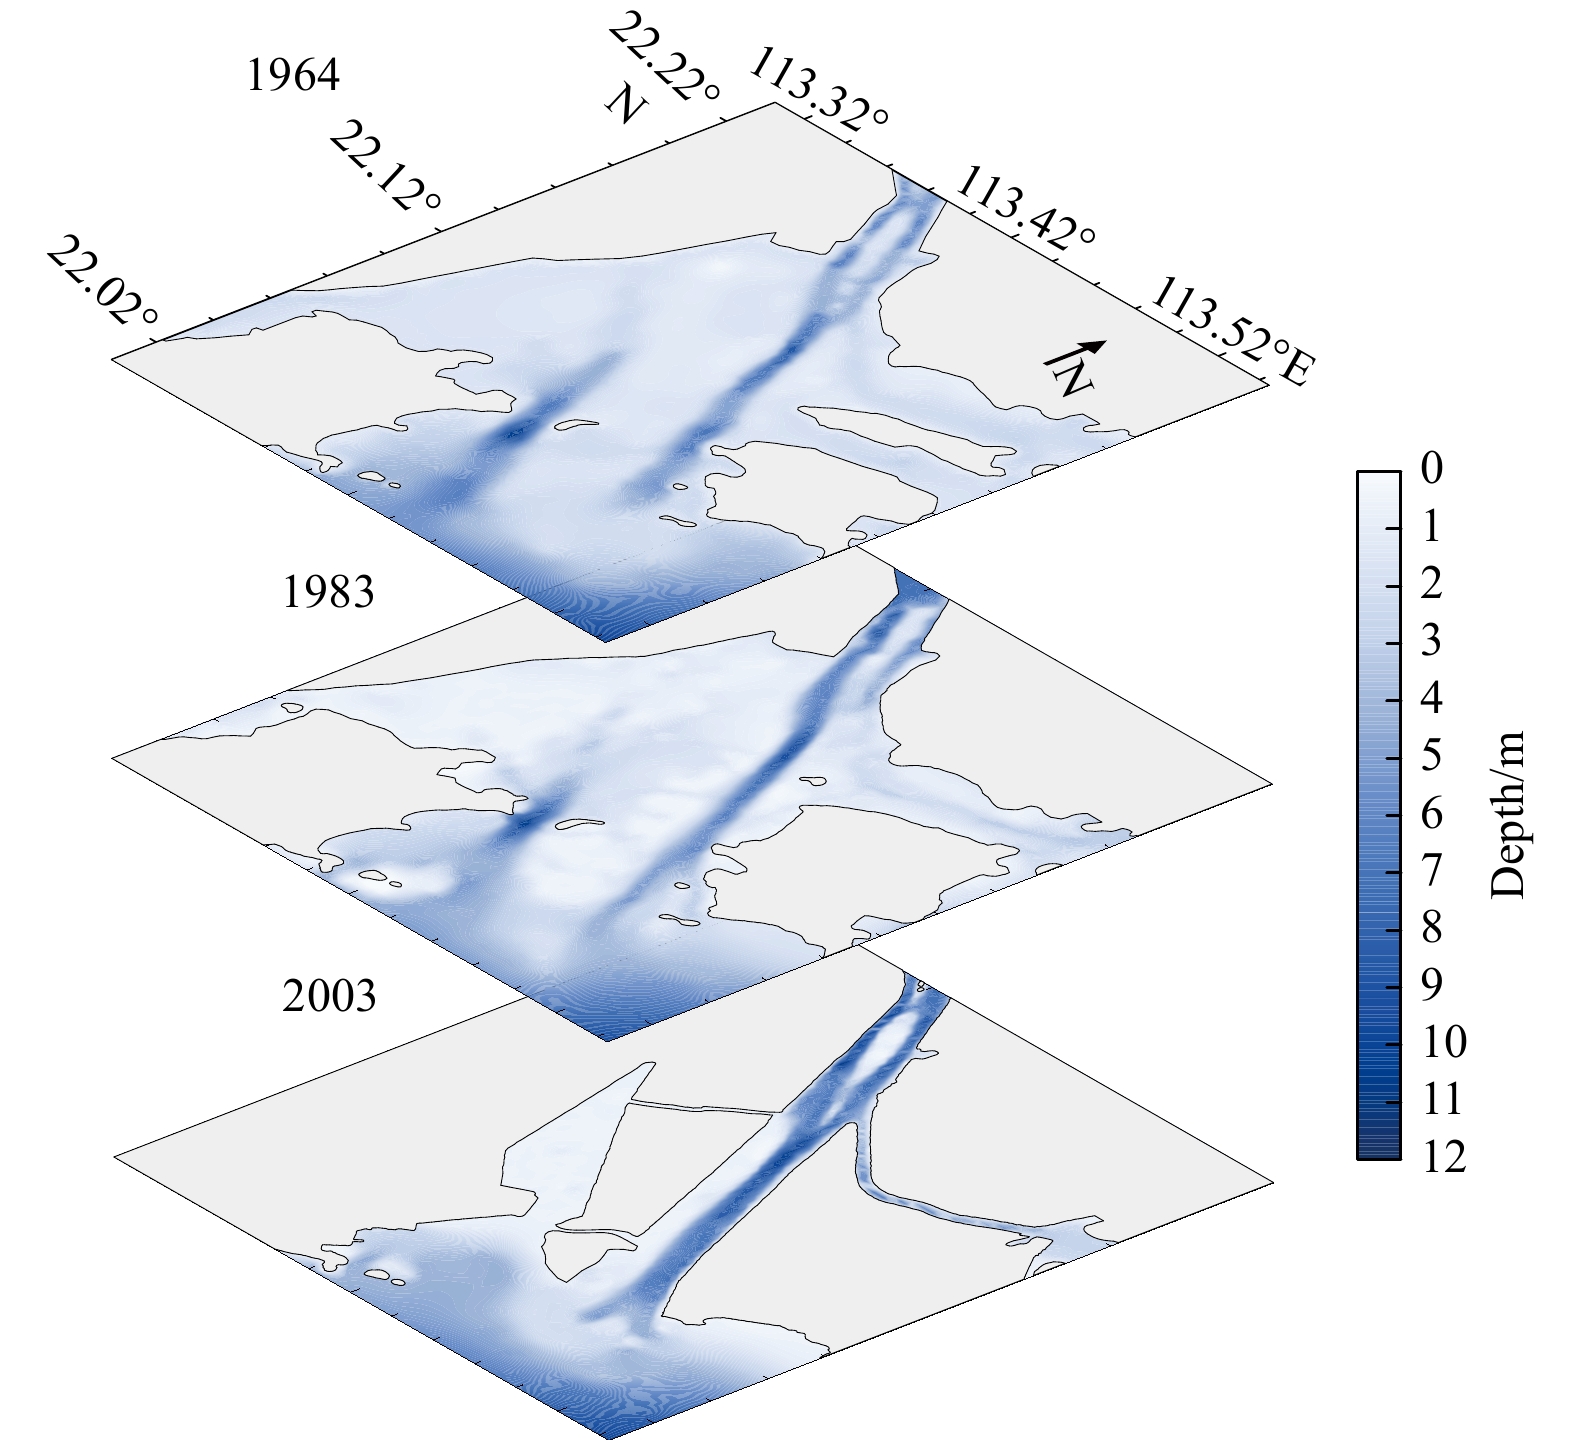
Figure 6. Water area change rate (WACR) at different depths for three periods: 1964–1983, 1983–2003, 1964–2003.

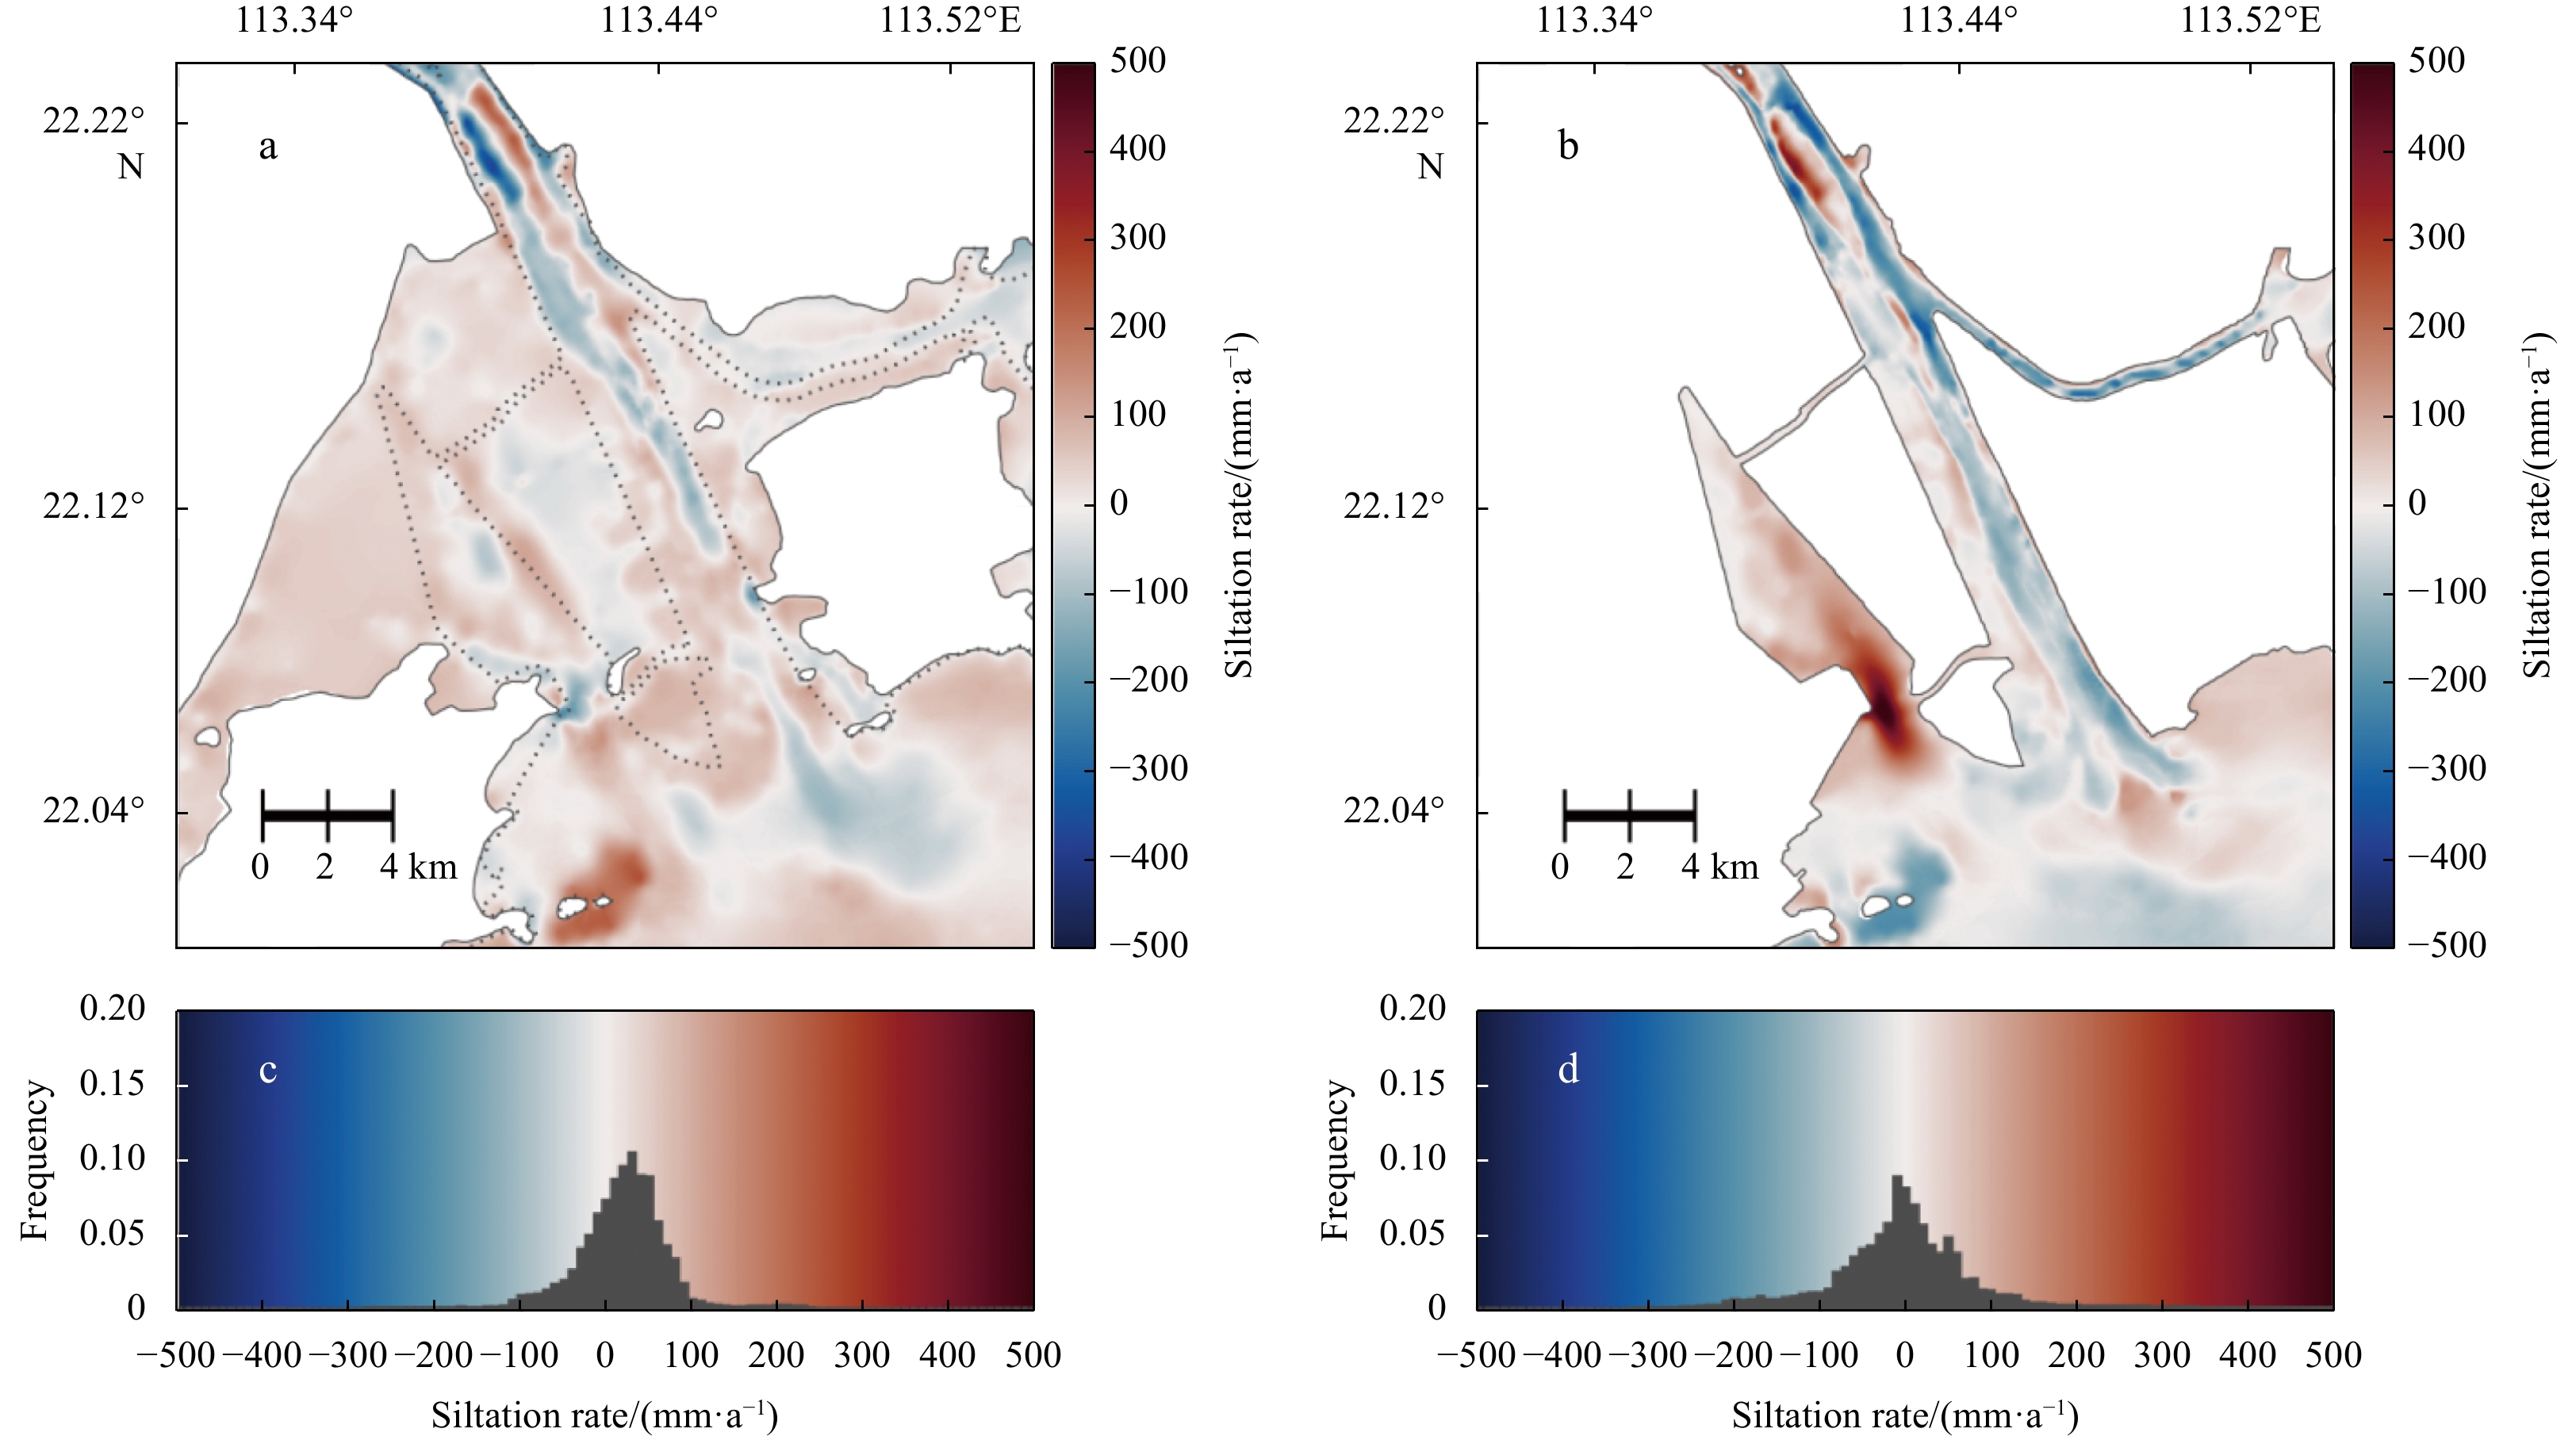
Figure 7. Spatial distribution and corresponding frequency distribution of siltation rates in the Modaomen Estuary for 1964−1983 (a, c) and 1983−2003 (b, d). Dotted lines in a are the shorelines in 2003.
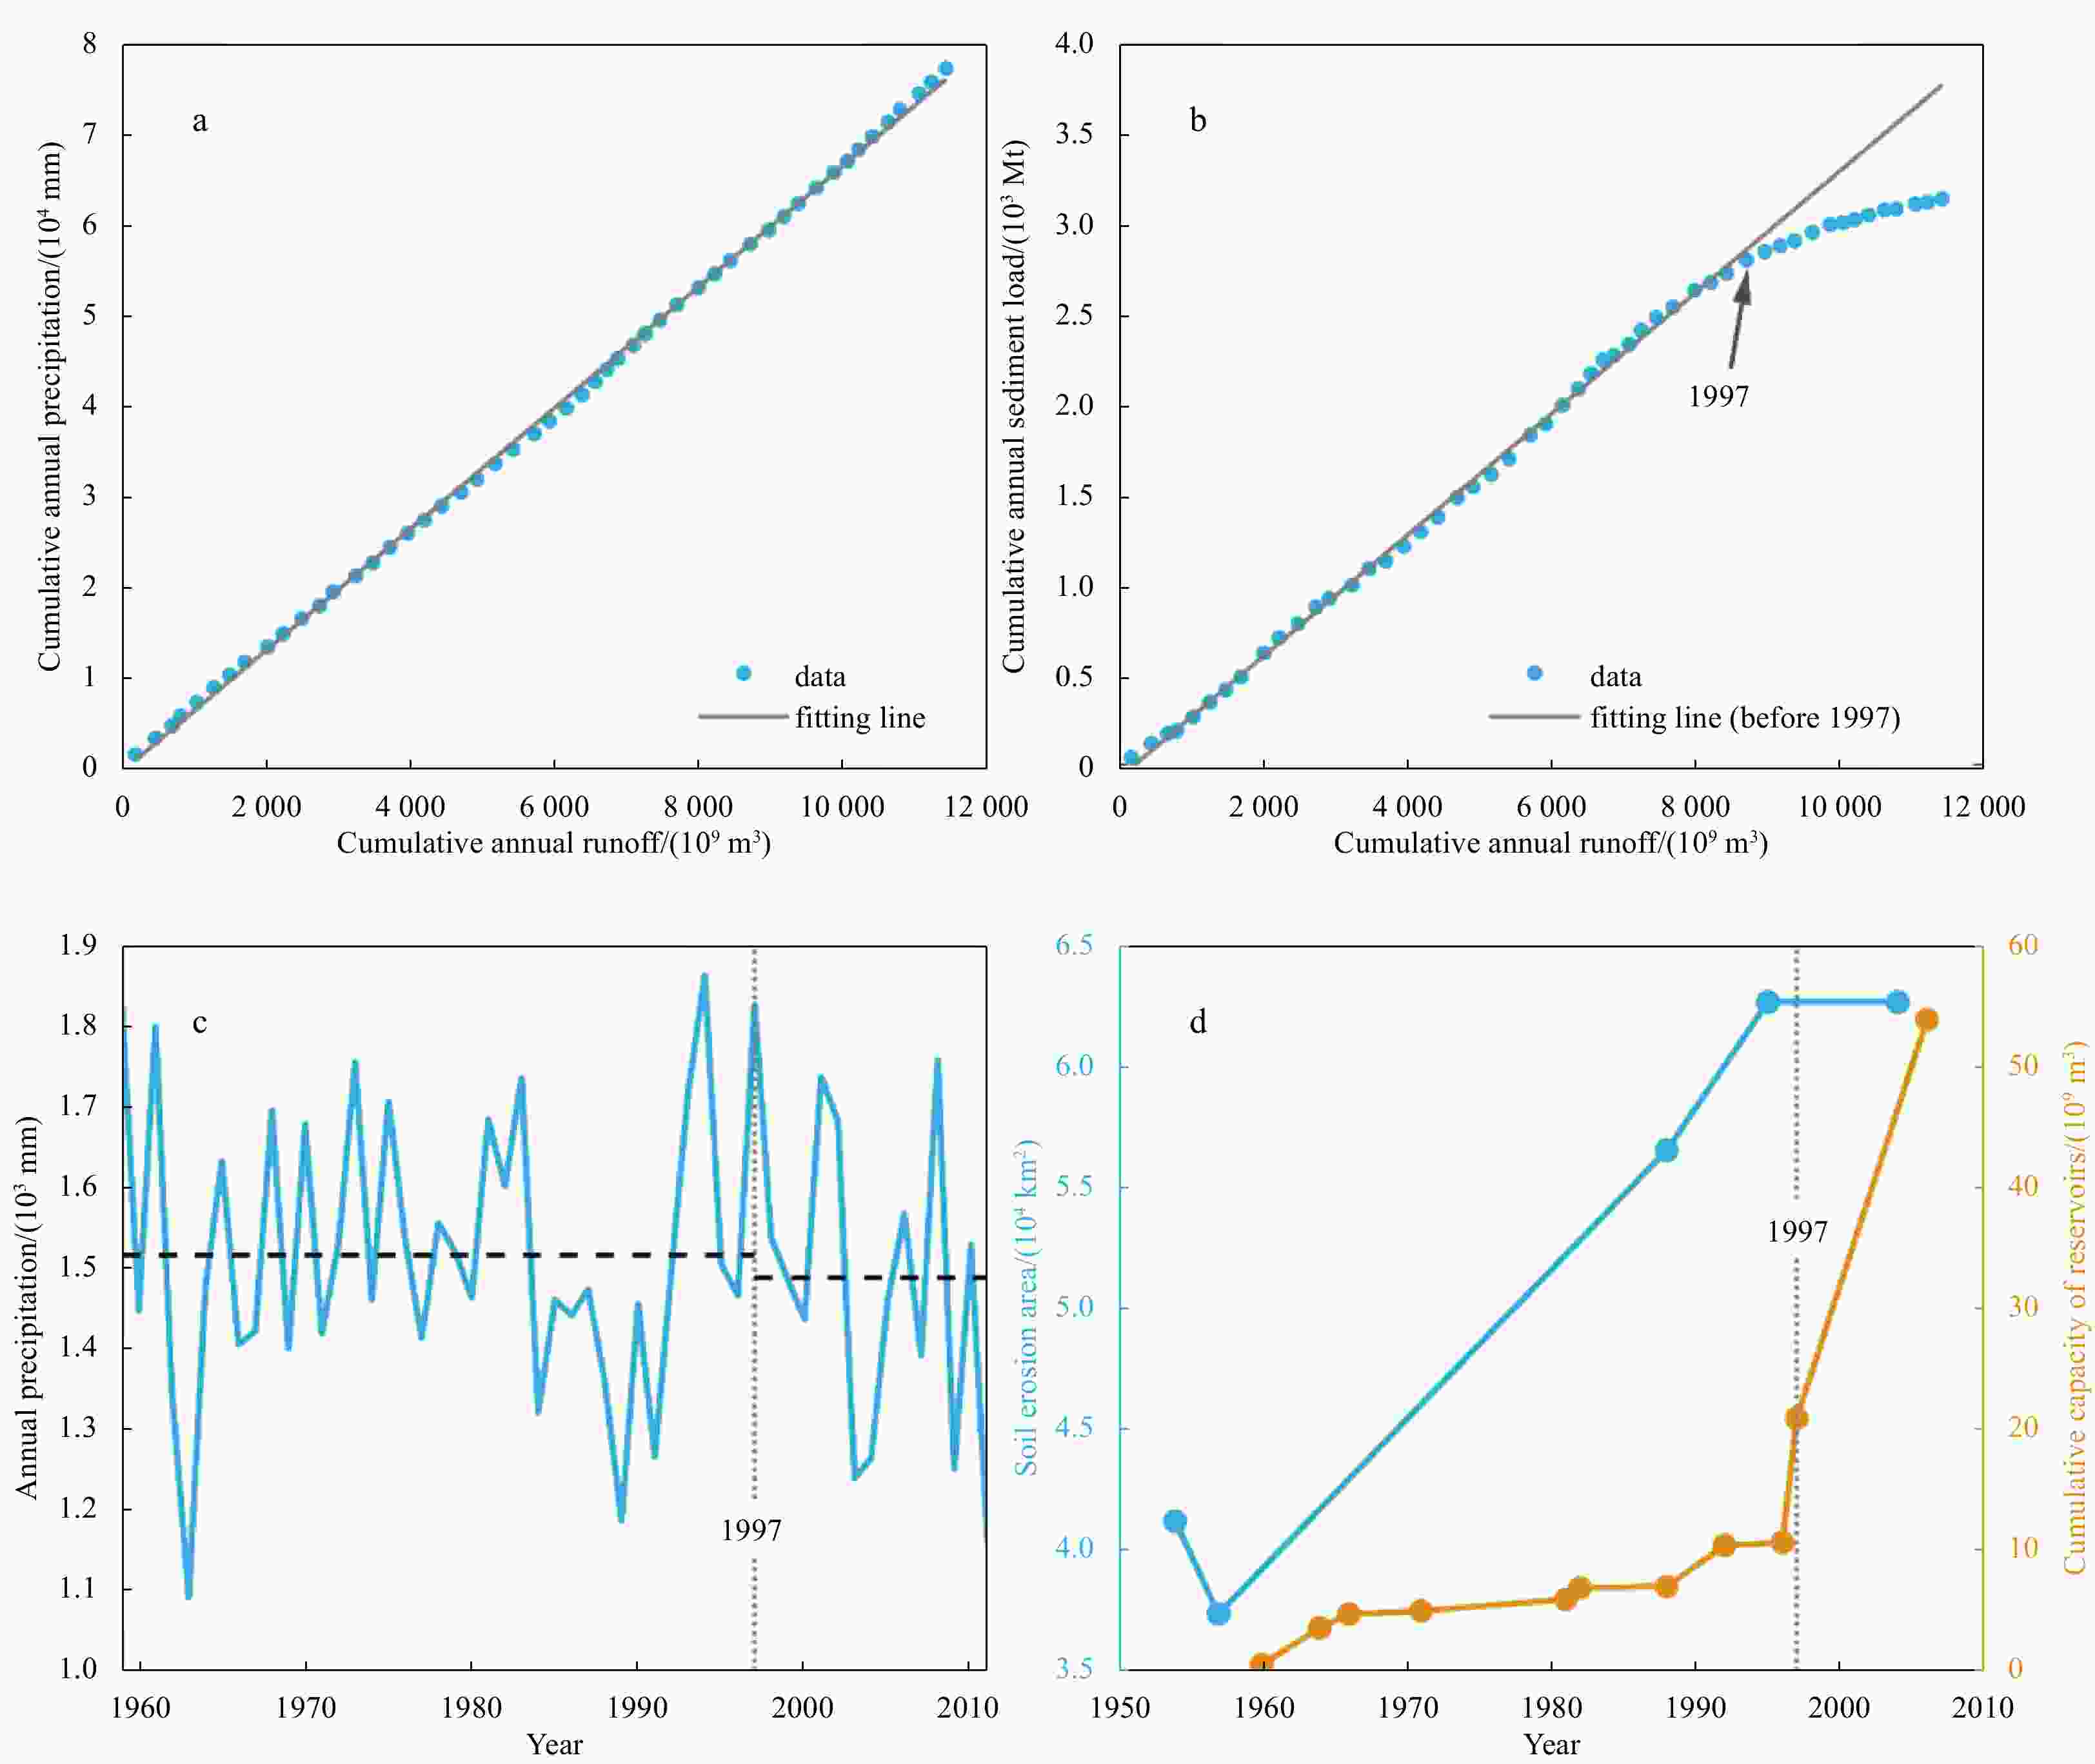
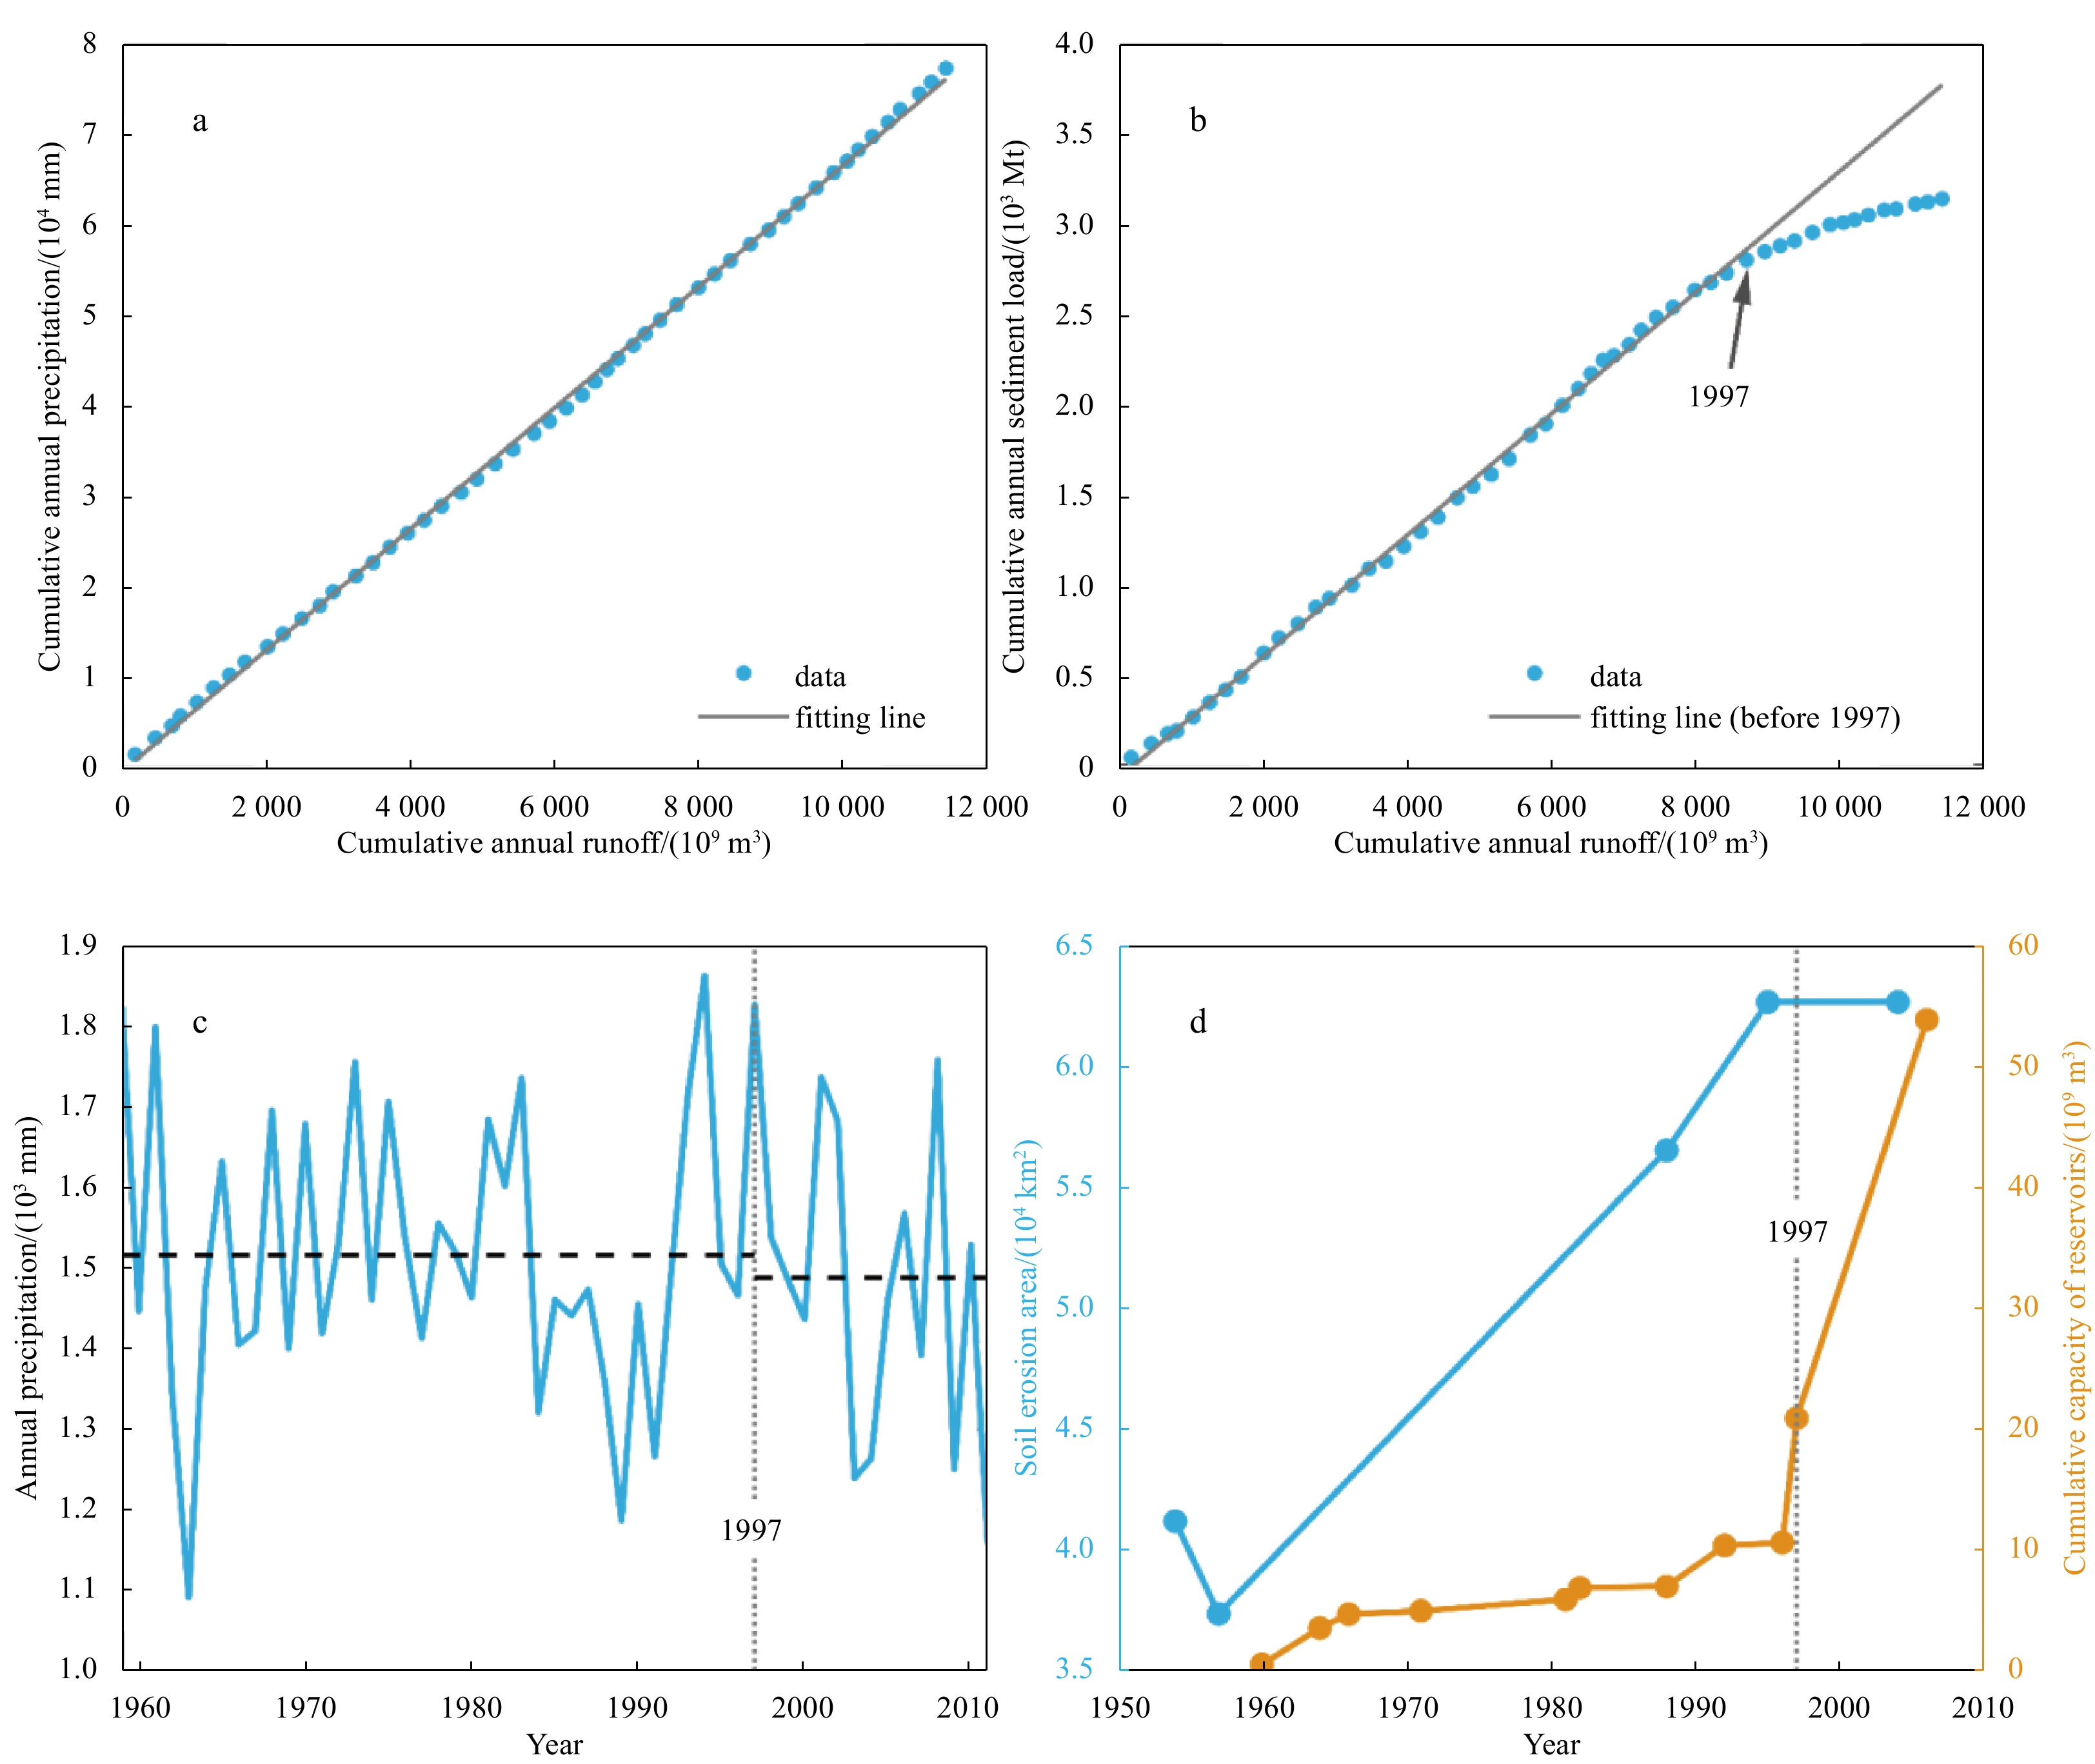
Figure 8. Double mass curve in cumulative values of annual runoff and annual precipitation from 1960 to 2010 (a); double mass curve in cumulative values of annual runoff and annual sediment load for 1960–2010 (b); annual precipitation from 1959 to 2011 (c); area of soil eroded land and total storage capacity of reservoirs (d).
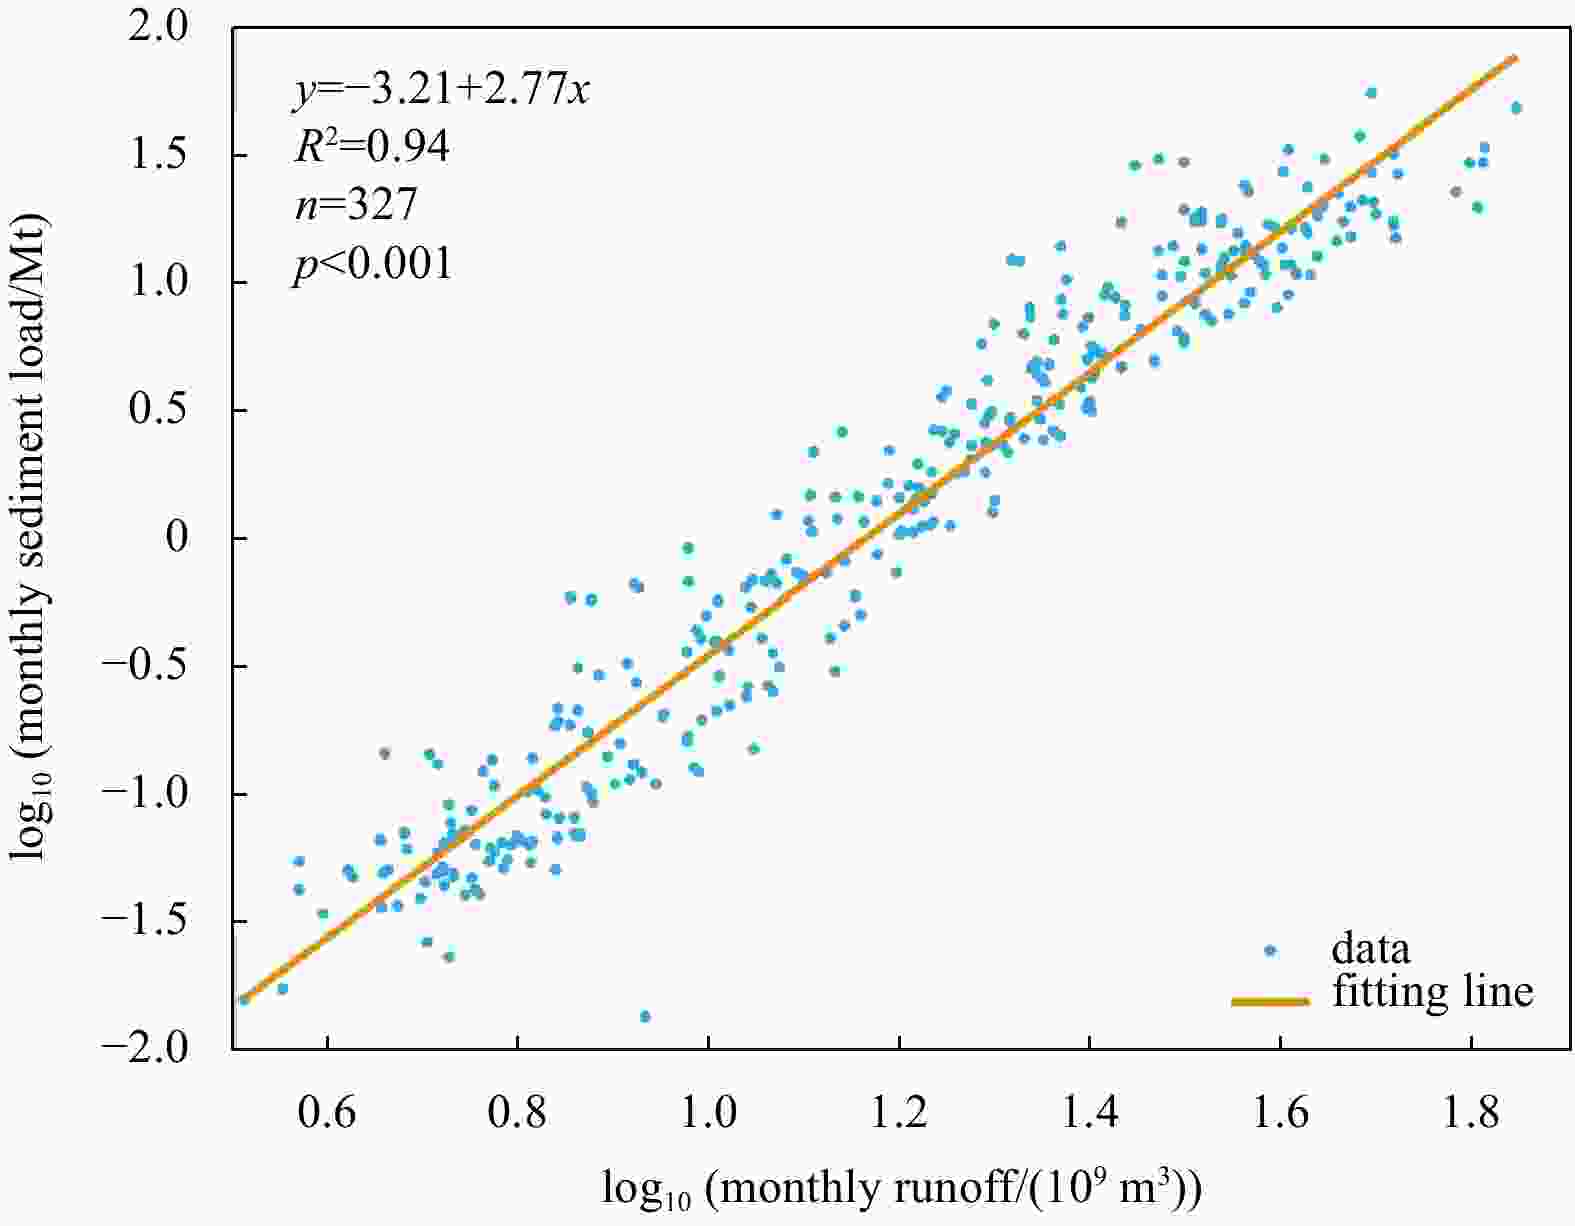
Figure 9. Correlational relationship between logarithmic monthly runoff and logarithmic monthly sediment load.
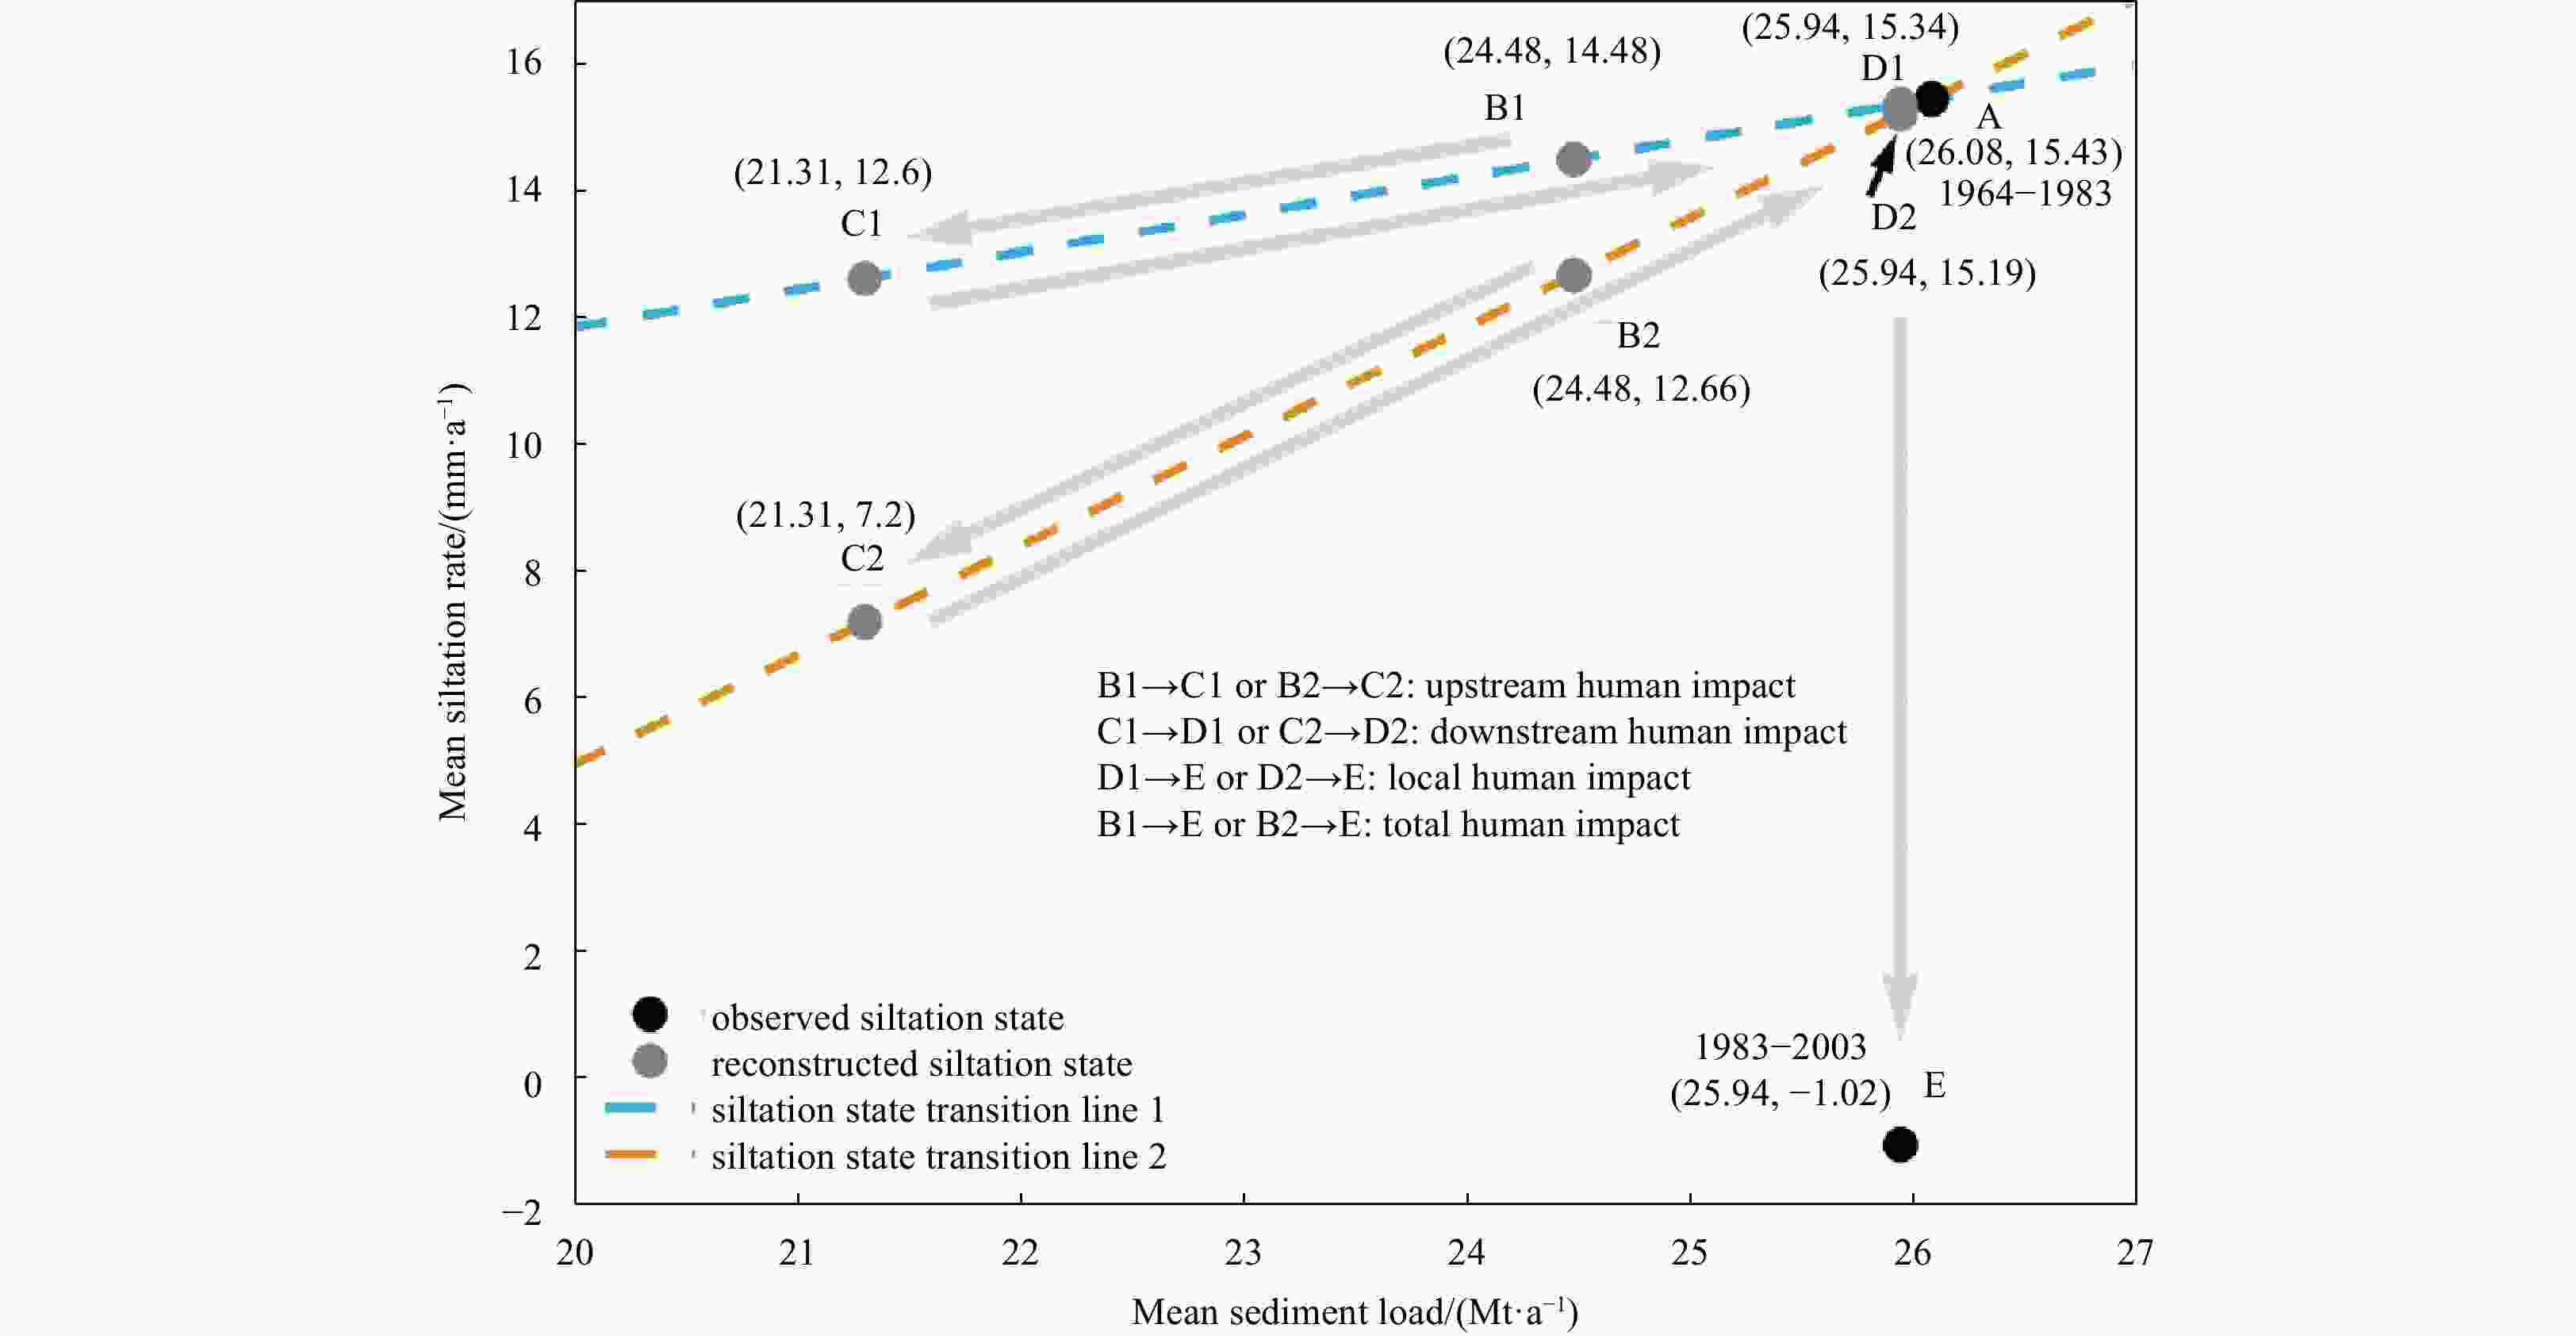
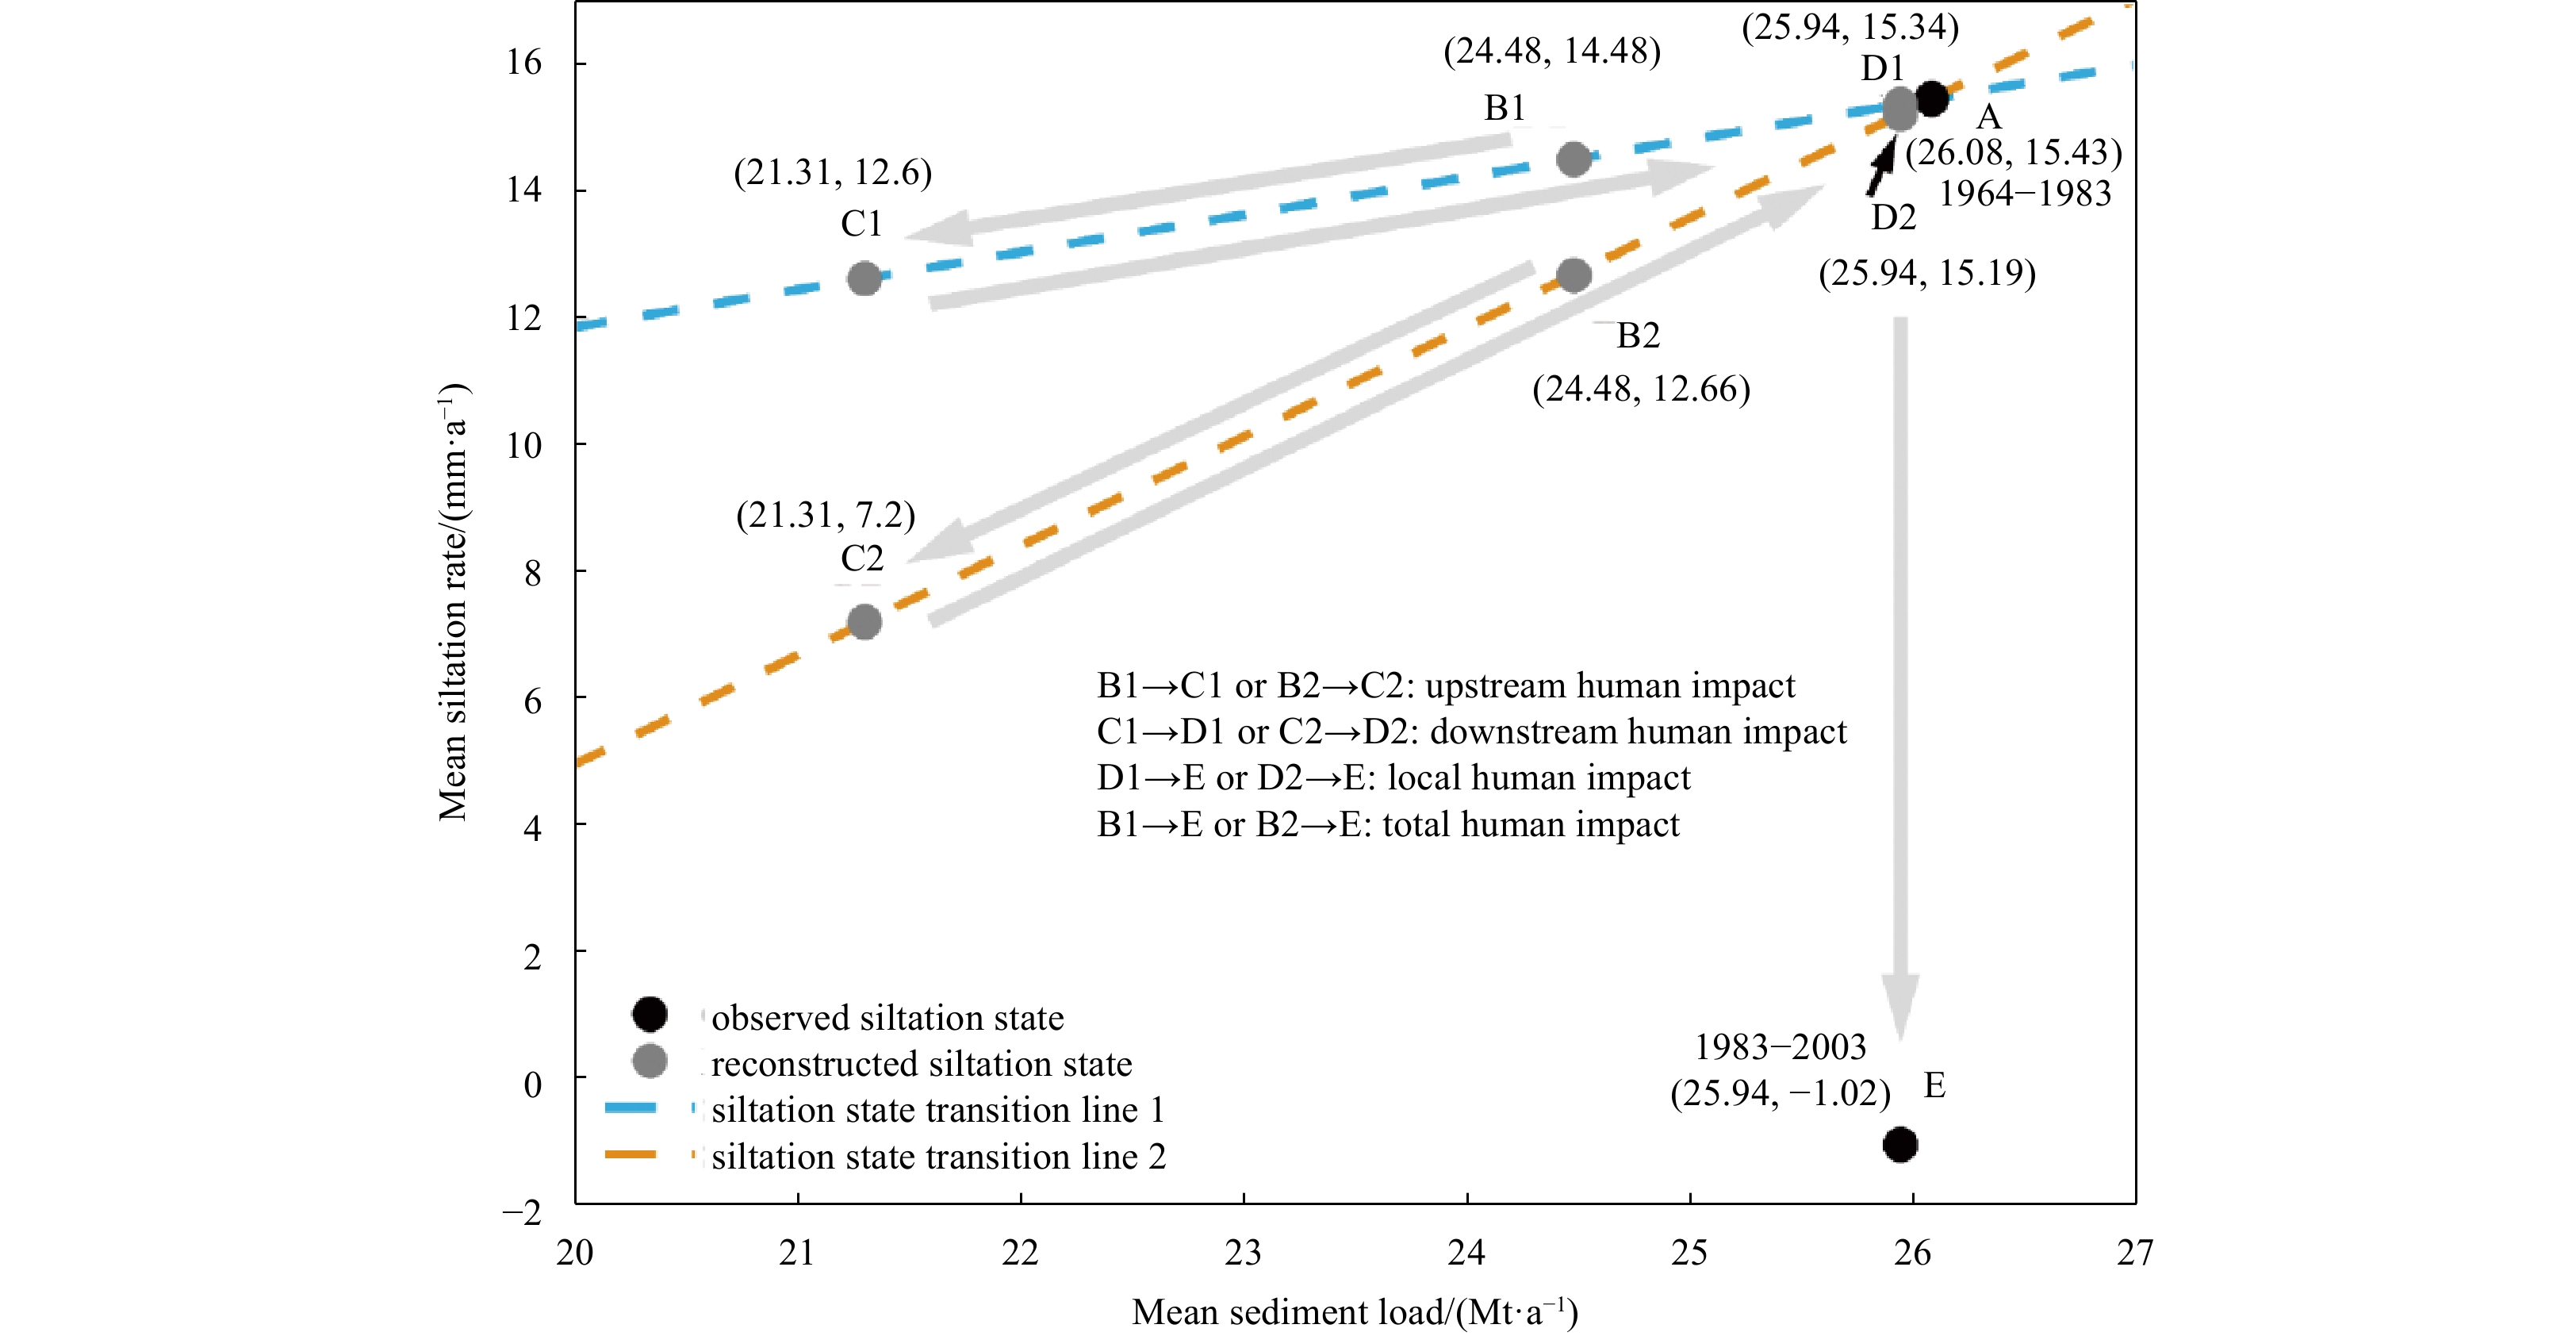
Figure 11. Siltation state shift under the human impact. Siltation state transition line 1 passes points (0, 0) and (26.08, 15.43); siltation state transition line 2 goes through (17.14, 0) and (26.08, 15.43). States B1 and B2 denote siltation states with no human impact. States C1 and C2 represent siltation states only with upstream human activities. States D1 and D2 mean siltation states affected by upstream and downstream human activities. State E represents the siltation state under the influence of upstream, downstream, and local human activities.
Table 1. Basic information of used Landsat images
Acquisition
timeSatellite Sensor Pixel
resolution/mDatum/
EllipsoidUTM
zone1973/12/25 Landsat 1 MSS 60 WGS84 49 1987/2/7 Landsat 5 TM 30 WGS84 49 1989/7/6 Landsat 5 TM 30 WGS84 49 1991/11/17 Landsat 5 TM 30 WGS84 49 1993/12/24 Landsat 5 TM 30 WGS84 49 1995/12/30 Landsat 5 TM 30 WGS84 49 1997/11/1 Landsat 5 TM 30 WGS84 49 1999/11/15 Landsat 7 ETM+ 30 WGS84 49 2001/11/20 Landsat 7 ETM+ 30 WGS84 49 2003/10/17 Landsat 5 TM 30 WGS84 49 2005/11/23 Landsat 5 TM 30 WGS84 49 2007/9/18 Landsat 7 ETM+ 30 WGS84 49 2009/1/2 Landsat 5 TM 30 WGS84 49 2011/6/1 Landsat 5 TM 30 WGS84 49 2013/11/29 Landsat 8 OLI/TIRS 30 WGS84 49 2015/1/3 Landsat 8 OLI/TIRS 30 WGS84 49 2017/1/8 Landsat 8 OLI/TIRS 30 WGS84 49  下载: 导出CSV
Table 2. Topographic data
Map title Projection coordinate Depth datum Scale Measurement
timeSanzao Island and Related Sites Beijing 54 Coordinate System Theoretical Lowest Tide Surface 1:50 000 1964 Modaomen Channel Series Beijing 54 Coordinate System Theoretical Lowest Tide Surface 1:10 000 1983 Topographic Maps of Flood Control and Regulating
Engineering in Zhujiang River EstuaryBeijing 54 Coordinate System Theoretical Lowest Tide Surface 1:5 000 2003
下载: 导出CSV
Table 3. Basic statistics of digital elevation model
Survey time 1964 1983 2003 Area of water/km2 348.58 332.50 185.00 Volume of water/(106 m3) 931.98 782.67 620.25 Mean depth/m 2.67 2.35 3.35 Mean depth* /m 3.62 3.33 3.35 Note: *Mean depths were calculated within the water area in 2003.
下载: 导出CSV
Table 4. Statistics of siltation characteristics in each period
Period 1964–1983 1964–1983* 1983–2003 Siltation amount (SA)/(106 m3) 194.49 111.31 109.19 Erosion amount (EA)/(106 m3) 73.99 57.09 112.97 Net siltation amount (NSA=SA−EA)/(106 m3) 120.50 54.22 −3.78 Siltation area (SiA)/km2 235.75 121.77 89.01 Erosion area (ErA)/km2 96.75 63.23 95.99 Total research area (TRA=SiA+ErA)/km2 332.50 185.00 185.00 Percentage of siltation area (SiA/TRA)/% 70.90 65.82 48.11 Percentage of erosion area (ErA/TRA)/% 29.10 34.18 51.89 Mean siltation rate (NSA/TRA/length of the period)/(mm·a−1) 19.07 15.43 −1.02 Note: *Parameters for this period were calculated within the water area in 2003.
下载: 导出CSV
Table 5. Sediment fluxes at the main cross-sections of the Xijiang River during the survey in wet season
Station Makou Tianhe Right Denglongshan Left Denglongshan SedME/SedMakou Net sediment output/t 5 118 768 2 269 100 1 149 800 1 161 500 45.15% Mean sediment concentration/(kg·m−3) 0.304 0.295 0.378 0.392 − Note: − means no data. ME: Modaomen Estuary.
下载: 导出CSV
Table 6. Sediment fluxes at the main cross-sections of the Xijiang River during the survey in dry season
Station Makou Tianhe Right Denglongshan Left Denglongshan SedME/SedMakou Net sediment output/t 21 838 12 197 11 152 6 689.1 81.70% Mean sediment concentration/(kg·m−3) 0.015 0.018 0.042 0.025 − Note: − means no data. ME: Modaomen Estuary.
下载: 导出CSV
Table 7. Sediment input, sedimentation, and escape of the Modaomen Estuary in different periods
Period 1964–1983 1983–2003 Averaged annual sediment input/(Mt·a−1) 26.08 25.94 Total sediment input (Stotal)/Mt 495.52 518.80 Net siltation amount within water area (Vw)/(106 m3) 120.50 −3.78 Net sediment increases within water area (Sw=Vw× $\rho _{\rm{b}}$)/Mt* 132.55 −4.16 Sediment volume of newly formed land areas (Vr)/(106 m3) 32.17 215.36 Sediment mass of newly formed land areas (Sr=Vr× $\rho _{\rm{b}}$)/Mt* 35.39 236.90 Total escaped sediment mass (Se=Stotal−Sw−Sr)/Mt 327.58 286.06 Capture ratio of sediment ((Sw+Sr)/Stotal×100%) 33.89 44.86 Note: *The dry bulk density ${\rho} _{\rm{b} }$ used in the calculation is equal to 1.1 t/m3.
下载: 导出CSV
Table 8. Statistics of land area increase and reclamation in each period
Period 1973–1987 1987–1991 1991–1999 1999–2003 2003–2017 Land increase (LI)/km2 83.12 21.32 44.74 31.36 0.71 Reclaimed area (RA)/km2 79.39 18.14 38.99 30.78 0.26 Percentage of reclaimed area (RA/LI)/% 95.51 85.08 87.15 98.15 36.50 Mean reclamation rate (RA/length of the period)/(km2·a−1) 5.67 4.53 4.87 7.69 0.02
下载: 导出CSV
-
Acciarri A, Bisci C, Cantalamessa G, et al. 2016. Anthropogenic influence on recent evolution of shorelines between the Conero Mt. and the Tronto R. mouth (southern Marche, Central Italy). CATENA, 147: 545–555. doi: 10.1016/j.catena.2016.08.018 Besset M, Anthony E J, Bouchette F. 2019. Multi-decadal variations in delta shorelines and their relationship to river sediment supply: an assessment and review. Earth-Science Reviews, 193: 199–219. doi: 10.1016/j.earscirev.2019.04.018 Chen Xiaowen, Liu Xia, Zhang Wei. 2011. Shore reclamation in Zhujiang River Esturay and its impact analysis. Journal of Hohai University (Natural Sciences) (in Chinese), 39(1): 39–43 Chu Zhongxin, Yang Xuhui, Feng Xiuli, et al. 2013. Temporal and spatial changes in coastline movement of the Yangtze Delta during 1974–2010. Journal of Asian Earth Sciences, 66: 166–174. doi: 10.1016/j.jseaes.2013.01.002 Cooper J A G, Pilkey O H. 2004. Sea-level rise and shoreline retreat: time to abandon the Bruun Rule. Global and Planetary Change, 43(3–4): 157–171 Cowart L, Walsh J P, Corbett D R. 2010. Analyzing estuarine shoreline change: a case study of cedar Island, North Carolina. Journal of Coastal Research, 26(5): 817–830 Cui Buli, Li Xiaoyan. 2011. Coastline change of the Yellow River Estuary and its response to the sediment and runoff (1976–2005). Geomorphology, 127(1–2): 32–40 Cunliffe A M, Tanski G, Radosavljevic B, et al. 2019. Rapid retreat of permafrost coastline observed with aerial drone photogrammetry. The Cryosphere, 13(5): 1513–1528. doi: 10.5194/tc-13-1513-2019 Dai Zhijun. 2021. Changjiang Riverine and Estuarine Hydro-morphodynamic Processes: in the Context of Anthropocene Era. Singapore: Springer Dai Zhijun, Liu J T. 2013. Impacts of large dams on downstream fluvial sedimentation: an example of the Three Gorges Dam (TGD) on the Changjiang (Yangtze River). Journal of Hydrology, 480: 10–18. doi: 10.1016/j.jhydrol.2012.12.003 Dai Zhijun, Liu J T, Wei Wen, et al. 2014. Detection of the Three Gorges Dam influence on the Changjiang (Yangtze River) submerged delta. Scientific Reports, 4: 6600. doi: 10.1038/srep06600 Dai Shibao, Lu Xixi. 2014. Sediment load change in the Yangtze River (Changjiang): a review. Geomorphology, 215: 60–73. doi: 10.1016/j.geomorph.2013.05.027 Dai Zhijun, Mei Xuefei, Darby S E, et al. 2018. Fluvial sediment transfer in the Changjiang (Yangtze) river-estuary depositional system. Journal of Hydrology, 566: 719–734. doi: 10.1016/j.jhydrol.2018.09.019 Dai Shibao, Yang Shilun, Cai Aimin. 2008. Impacts of dams on the sediment flux of the Zhujiang River, southern China. CATENA, 76(1): 36–43. doi: 10.1016/j.catena.2008.08.004 Day J W, Giosan L. 2008. Survive or subside?. Nature Geoscience, 1(3): 156–157 Dean R G, Houston J R. 2016. Determining shoreline response to sea level rise. Coastal Engineering, 114: 1–8. doi: 10.1016/j.coastaleng.2016.03.009 Fanos A M. 1995. The impact of human activities on the erosion and accretion of the Nile Delta coast. Journal of Coastal Research, 11(3): 821–833 Fearnley S M, Miner M D, Kulp M, et al. 2009. Hurricane impact and recovery shoreline change analysis of the Chandeleur Islands, Louisiana, USA: 1855 to 2005. Geo-Marine Letters, 29(6): 455–466. doi: 10.1007/s00367-009-0155-5 Ford M. 2013. Shoreline changes interpreted from multi-temporal aerial photographs and high resolution satellite images: Wotje Atoll, Marshall Islands. Remote Sensing of Environment, 135: 130–140. doi: 10.1016/j.rse.2013.03.027 Frihy O E, Debes E A, El Sayed W R. 2003. Processes reshaping the Nile delta promontories of Egypt: pre- and post-protection. Geomorphology, 53(3–4): 263–279 Gellis A C, Noe G B. 2013. Sediment source analysis in the Linganore Creek watershed, Maryland, USA, using the sediment fingerprinting approach: 2008 to 2010. Journal of Soils and Sediments, 13(10): 1735–1753. doi: 10.1007/s11368-013-0771-6 Gong Wenping, Shen Jian. 2011. The response of salt intrusion to changes in river discharge and tidal mixing during the dry season in the Modaomen Estuary, China. Continental Shelf Research, 31(7–8): 769–788 Grill G, Lehner B, Thieme M, et al. 2019. Mapping the world’s free-flowing rivers. Nature, 569(7755): 215–221. doi: 10.1038/s41586-019-1111-9 Han Zhiyuan, Tian Xiangping, Ou Suying. 2010. Impacts of Large-scale human activities on riverbed morphology and tidal dynamics at modaomen estuary. Scientia Geographica Sinica (in Chinese), 30(4): 582–587 Hansen J E, Elias E, List J H, et al. 2013. Tidally influenced alongshore circulation at an inlet-adjacent shoreline. Continental Shelf Research, 56: 26–38. doi: 10.1016/j.csr.2013.01.017 Healy M G, Hickey K R. 2002. Historic land reclamation in the intertidal wetlands of the Shannon Estuary, western Ireland. Journal of Coastal Research, 36(10036): 365–373 Hillel D. 2013. Introduction to Soil Physics. New York: Academic Press Himmelstoss E A, Henderson R E, Kratzmann M G, et al. 2018. Digital shoreline analysis system (DSAS) version 5.0 user guide. Reston: U. S. Geological Survey Jia Liangwen, Pan Shunqi, Wu Chaoyu. 2013. Effects of the anthropogenic activities on the morphological evolution of the Modaomen Estuary, Zhujiang River Delta, China. China Ocean Engineering, 27(6): 795–808. doi: 10.1007/s13344-013-0065-1 Jones B M, Grosse G, Arp C D, et al. 2011. Modern thermokarst lake dynamics in the continuous permafrost zone, northern Seward Peninsula, Alaska. Journal of Geophysical Research: Biogeosciences, 116(G2): G00M03 Kong Dongxian, Miao Chiyuan, Borthwick A G L, et al. 2015. Evolution of the Yellow River Delta and its relationship with runoff and sediment load from 1983 to 2011. Journal of Hydrology, 520: 157–167. doi: 10.1016/j.jhydrol.2014.09.038 Lehner B, Liermann C R, Revenga C, et al. 2011. High-resolution mapping of the world’s reservoirs and dams for sustainable river-flow management. Frontiers in Ecology and the Environment, 9(9): 494–502. doi: 10.1890/100125 Liu Feng, Hu Shuai, Guo Xiaojuan, et al. 2018. Recent changes in the sediment regime of the Zhujiang River (South China): causes and implications for the Zhujiang River Delta. Hydrological Processes, 32(12): 1771–1785. doi: 10.1002/hyp.11513 Liu Feng, Tian Xiangping, Han Zhiyuan, et al. 2011. Analysis of river channel evolution of Modaomen channel of Xijiang River in past forty years. Journal of Sediment Research (in Chinese), (1): 45–50 Liu Feng, Yuan Lirong, Yang Qingshu, et al. 2014. Hydrological responses to the combined influence of diverse human activities in the Zhujiang River Delta, China. CATENA, 113: 41–55. doi: 10.1016/j.catena.2013.09.003 Loveland T R, Dwyer J L. 2012. Landsat: building a strong future. Remote Sensing of Environment, 122: 22–29. doi: 10.1016/j.rse.2011.09.022 Luo Xiangxin, Yang Shilun, Zhang Jing. 2012. The impact of the Three Gorges Dam on the downstream distribution and texture of sediments along the middle and lower Yangtze River (Changjiang) and its estuary, and subsequent sediment dispersal in the East China Sea. Geomorphology, 179: 126–140. doi: 10.1016/j.geomorph.2012.05.034 Luo Xianlin, Zeng E Y, Ji Rongyao, et al. 2007. Effects of in-channel sand excavation on the hydrology of the Zhujiang River Delta, China. Journal of Hydrology, 343(3–4): 230–239 Matin N, Hasan G M J. 2021. A quantitative analysis of shoreline changes along the coast of Bangladesh using remote sensing and GIS techniques. CATENA, 201: 105185. doi: 10.1016/j.catena.2021.105185 McFeeters S K. 1996. The use of the Normalized Difference Water Index (NDWI) in the delineation of open water features. International Journal of Remote Sensing, 17(7): 1425–1432. doi: 10.1080/01431169608948714 Meade R H. 1982. Sources, sinks, and storage of river sediment in the Atlantic drainage of the United States. The Journal of Geology, 90(3): 235–252. doi: 10.1086/628677 Mei Xuefei, Dai Zhijun, Du Jinzhou, et al. 2015. Linkage between Three Gorges Dam impacts and the dramatic recessions in China’s largest freshwater lake, Poyang Lake. Scientific Reports, 5: 18197. doi: 10.1038/srep18197 Nilsson C, Reidy C A, Dynesius M, et al. 2005. Fragmentation and flow regulation of the world’s large river systems. Science, 308(5720): 405–408. doi: 10.1126/science.1107887 Pritchard D W. 1967. What is an estuary: physical viewpoint. American Association for the Advancement of Science, 83: 3–5 Roccati A, Faccini F, Luino F, et al. 2019. Morphological changes and human impact in the Entella River floodplain (Northern Italy) from the 17th century. CATENA, 182: 104122. doi: 10.1016/j.catena.2019.104122 San-Nami T, Uda T, Onaka S. 2013. Long-term shoreline recession on eastern Bali Coast caused by riverbed mining. In: Proceedings of the 7th International Conference on Asian and Pacific Coasts. Bali: Hasanuddin University, 275–282 Stanley D J, Warne A G. 1993. Nile delta: recent geological evolution and human impact. Science, 260(5108): 628–634. doi: 10.1126/science.260.5108.628 Thieler E R, Himmelstoss E A, Zichichi J L, et al. 2009. The digital shoreline analysis system (DSAS) version 4.0-An ArcGIS extension for calculating shoreline change. Reston: U. S. Geological Survey van der Wal D, Pye K, Neal A. 2002. Long-term morphological change in the Ribble Estuary, northwest England. Marine Geology, 189(3–4): 249–266 Wang Jie, Dai Zhijun, Mei Xuefei, et al. 2020. Tropical cyclones significantly alleviate mega—deltaic erosion induced by high riverine flow. Geophysical Research Letters, 47(19): e2020GL089065 Wei Xing, Cai Shuqun, Zhan Weikang. 2021. Impact of anthropogenic activities on morphological and deposition flux changes in the Zhujiang River Estuary, China. Scientific Reports, 11(1): 16643. doi: 10.1038/s41598-021-96183-0 Wu Ziyin, Milliman J D, Zhao Dineng, et al. 2018. Geomorphologic changes in the lower Zhujiang River Delta, 1850–2015, largely due to human activity. Geomorphology, 314: 42–54. doi: 10.1016/j.geomorph.2018.05.001 Wu Ziyin, Saito Y, Zhao Dineng, et al. 2016a. Impact of human activities on subaqueous topographic change in Lingding Bay of the Zhujiang River Estuary, China, during 1955–2013. Scientific Reports, 6: 37742. doi: 10.1038/srep37742 Wu Chuangshou, Yang Shilun, Huang Shichang, et al. 2016b. Delta changes in the Zhujiang River Estuary and its response to human activities (1954–2008). Quaternary International, 392: 147–154. doi: 10.1016/j.quaint.2015.04.009 Yang Shilun, Belkin I M, Belkina A I, et al. 2003. Delta response to decline in sediment supply from the Yangtze River: evidence of the recent four decades and expectations for the next half-century. Estuarine, Coastal and Shelf Science, 57(4): 689–699 Yang Liuzhu, Liu Feng, Gong Wenping, et al. 2019. Morphological response of Lingding Bay in the Zhujiang River Estuary to human intervention in recent decades. Ocean & Coastal Management, 176: 1–10 Yang Shilun, Milliman J D, Li Peng, et al. 2011. 50, 000 dams later: erosion of the Yangtze River and its delta. Global and Planetary Change, 75(1–2): 14–20 Yang Zuosheng, Wang Houjie, Saito Y, et al. 2006. Dam impacts on the Changjiang (Yangtze) River sediment discharge to the sea: the past 55 years and after the Three Gorges Dam. Water Resources Research, 42(4): W04407 Yang Shilun, Zhang Jianbo, Xu Xiaojun. 2007. Influence of the Three Gorges Dam on downstream delivery of sediment and its environmental implications, Yangtze River. Geophysical Research Letters, 34(10): L10401. doi: 10.1029/2007GL029472 Zhang Shurong, Lu Xixi. 2009. Hydrological responses to precipitation variation and diverse human activities in a mountainous tributary of the lower Xijiang, China. CATENA, 77(2): 130–142. doi: 10.1016/j.catena.2008.09.001 Zhang Qiang, Xu Chongyu, Chen Yongqin David, et al. 2009. Abrupt behaviors of the streamflow of the Zhujiang River basin and implications for hydrological alterations across the Zhujiang River Delta, China. Journal of Hydrology, 377(3–4): 274–283 Zhang Wei, Xu Yang, Hoitink A J F, et al. 2015. Morphological change in the Zhujiang River Delta, China. Marine Geology, 363: 202–219. doi: 10.1016/j.margeo.2015.02.012 Zhu Meisha, Sun Tao, Shao Dongdong. 2016. Impact of land reclamation on the evolution of shoreline change and nearshore vegetation distribution in Yangtze River Estuary. Wetlands, 36(S1): 11–17. doi: 10.1007/s13157-014-0610-6 -


 点击查看大图

计量
- 文章访问数: 271
- HTML全文浏览量: 90
- PDF下载量: 26
- 被引次数: 0

