

Classification of ice and water in the Arctic using radar altimeter and microwave radiometer data from HY-2B satellite
-
Abstract: Several Chinese marine satellites have been launched in recent years. Monitoring sea ice and the ocean in the Arctic is of great importance for climate research. Sea ice in the Arctic has changed rapidly during the past few decades with respect to the extent and thickness. In this study, we applied combined passive and active microwave data from the Chinese HaiYang-2B (HY-2B) satellite to classify ice and sea water in the Arctic. We use data from a radar altimeter (RA) and a calibration microwave radiometer (CMR) to discriminate between ice and water by applying several approaches (1) the single parameter threshold criteria, (2) the multi-parameters linear segmentations and (3) the K-means clustering. The results yielded by these methods were in good agreement (classification accuracy >95%) with the Satellite Application Facility on Ocean and Sea Ice products between November and April. For other months (May–October), however, the agreement was less good (lowest classification accuracy approximate 85% in summer). A hybrid approach combined with graphical ice edges detection and microwave radar waveform analysis is therefore developed. A visual comparison with SAR images suggested the hybrid approach results greatly improved the ice and water discrimination in summer. This study demonstrated that multi-sensors (RA and CMR) configurations from HY satellites can offer comparable polar earth observation to the European Space Agency and NOAA satellite products.
-
Key words:
- Arctic /
- active microwave data /
- passive microwave data /
- sea ice /
- seawater
-

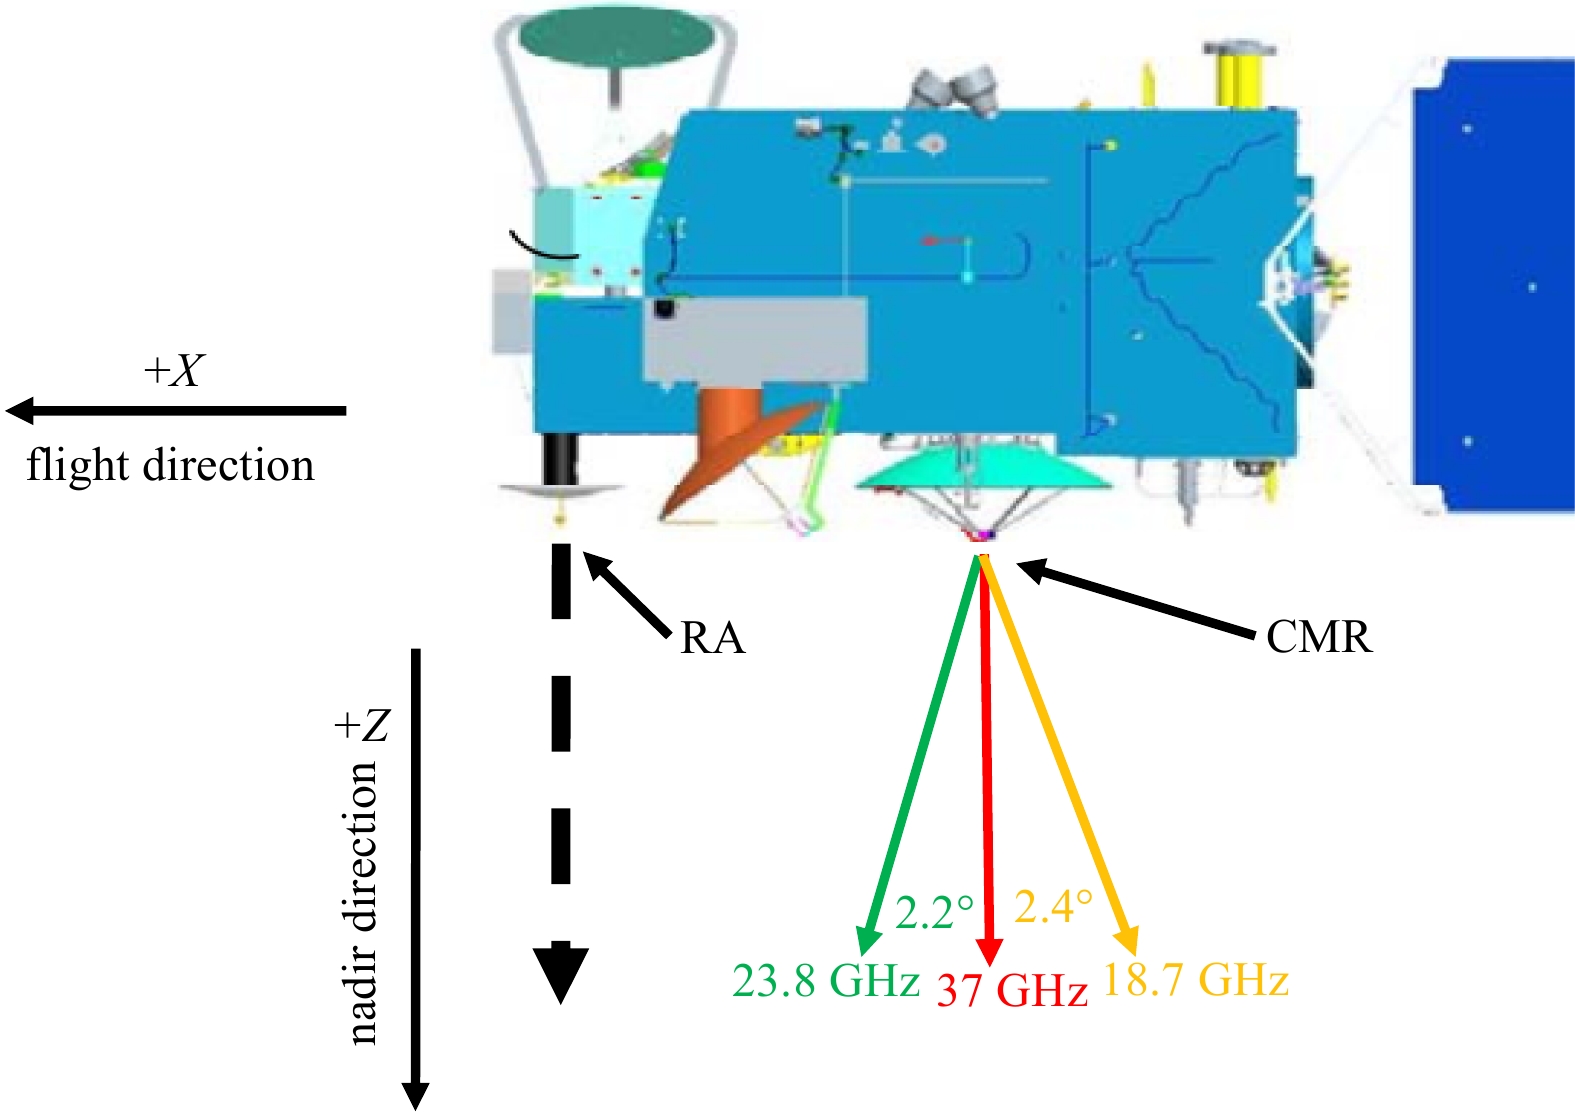
Figure 1. A cartoon illustration of HY-2B’s radar altimeter (RA) and calibration microwave radiometers (CMR) antenna beams orientation. The color arrows represent the observation angle of CMR’s 18.7 GHz (yellow), 23.8 GHz (green), 37 GHz (red).
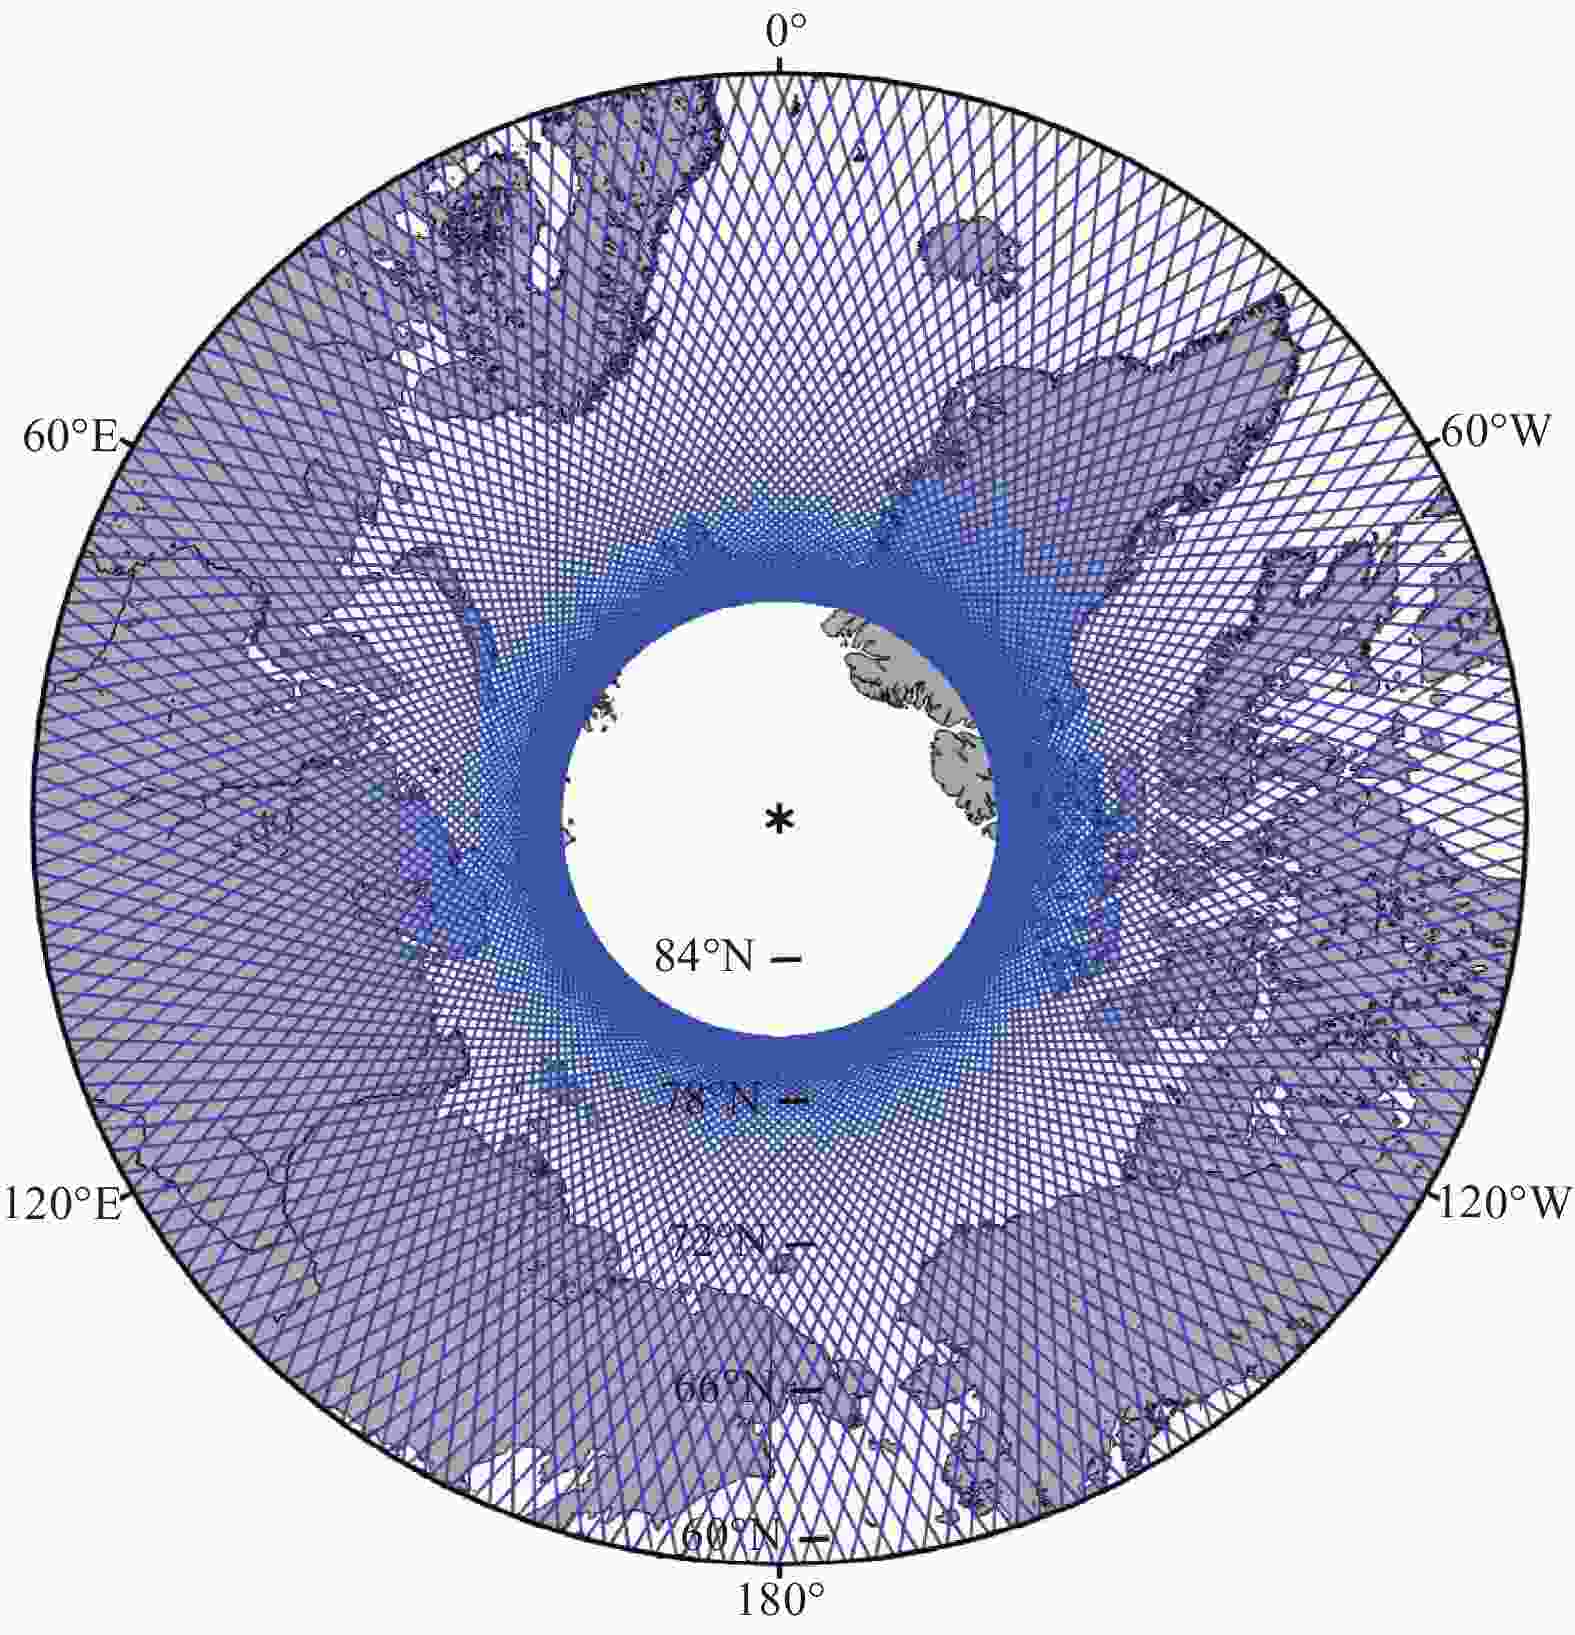
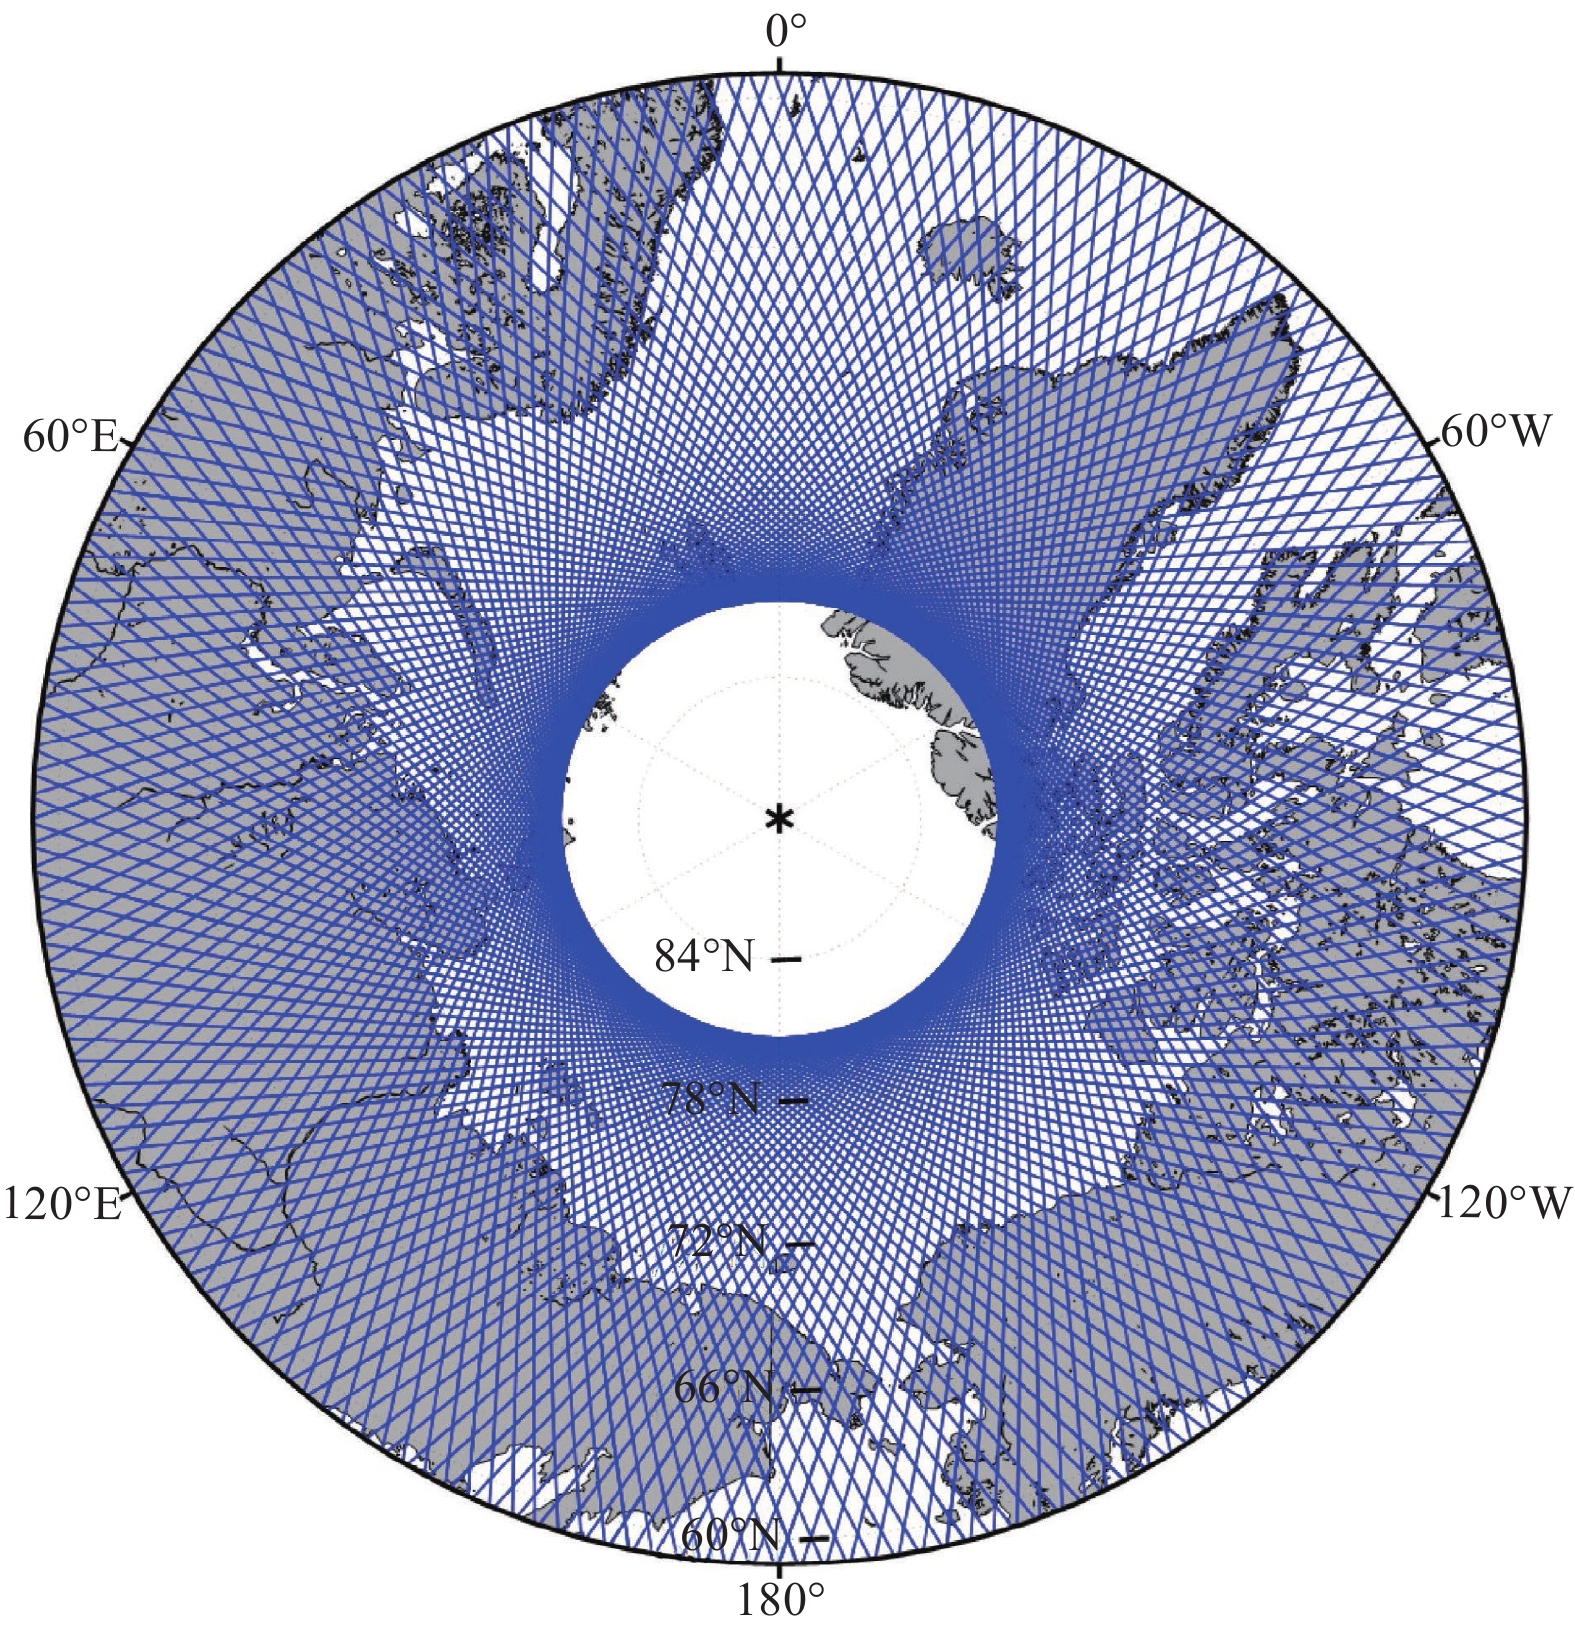
Figure 2. The HY-2B ground orbit trajectories (blue lines) in the northern hemisphere from November 1–15, 2019.
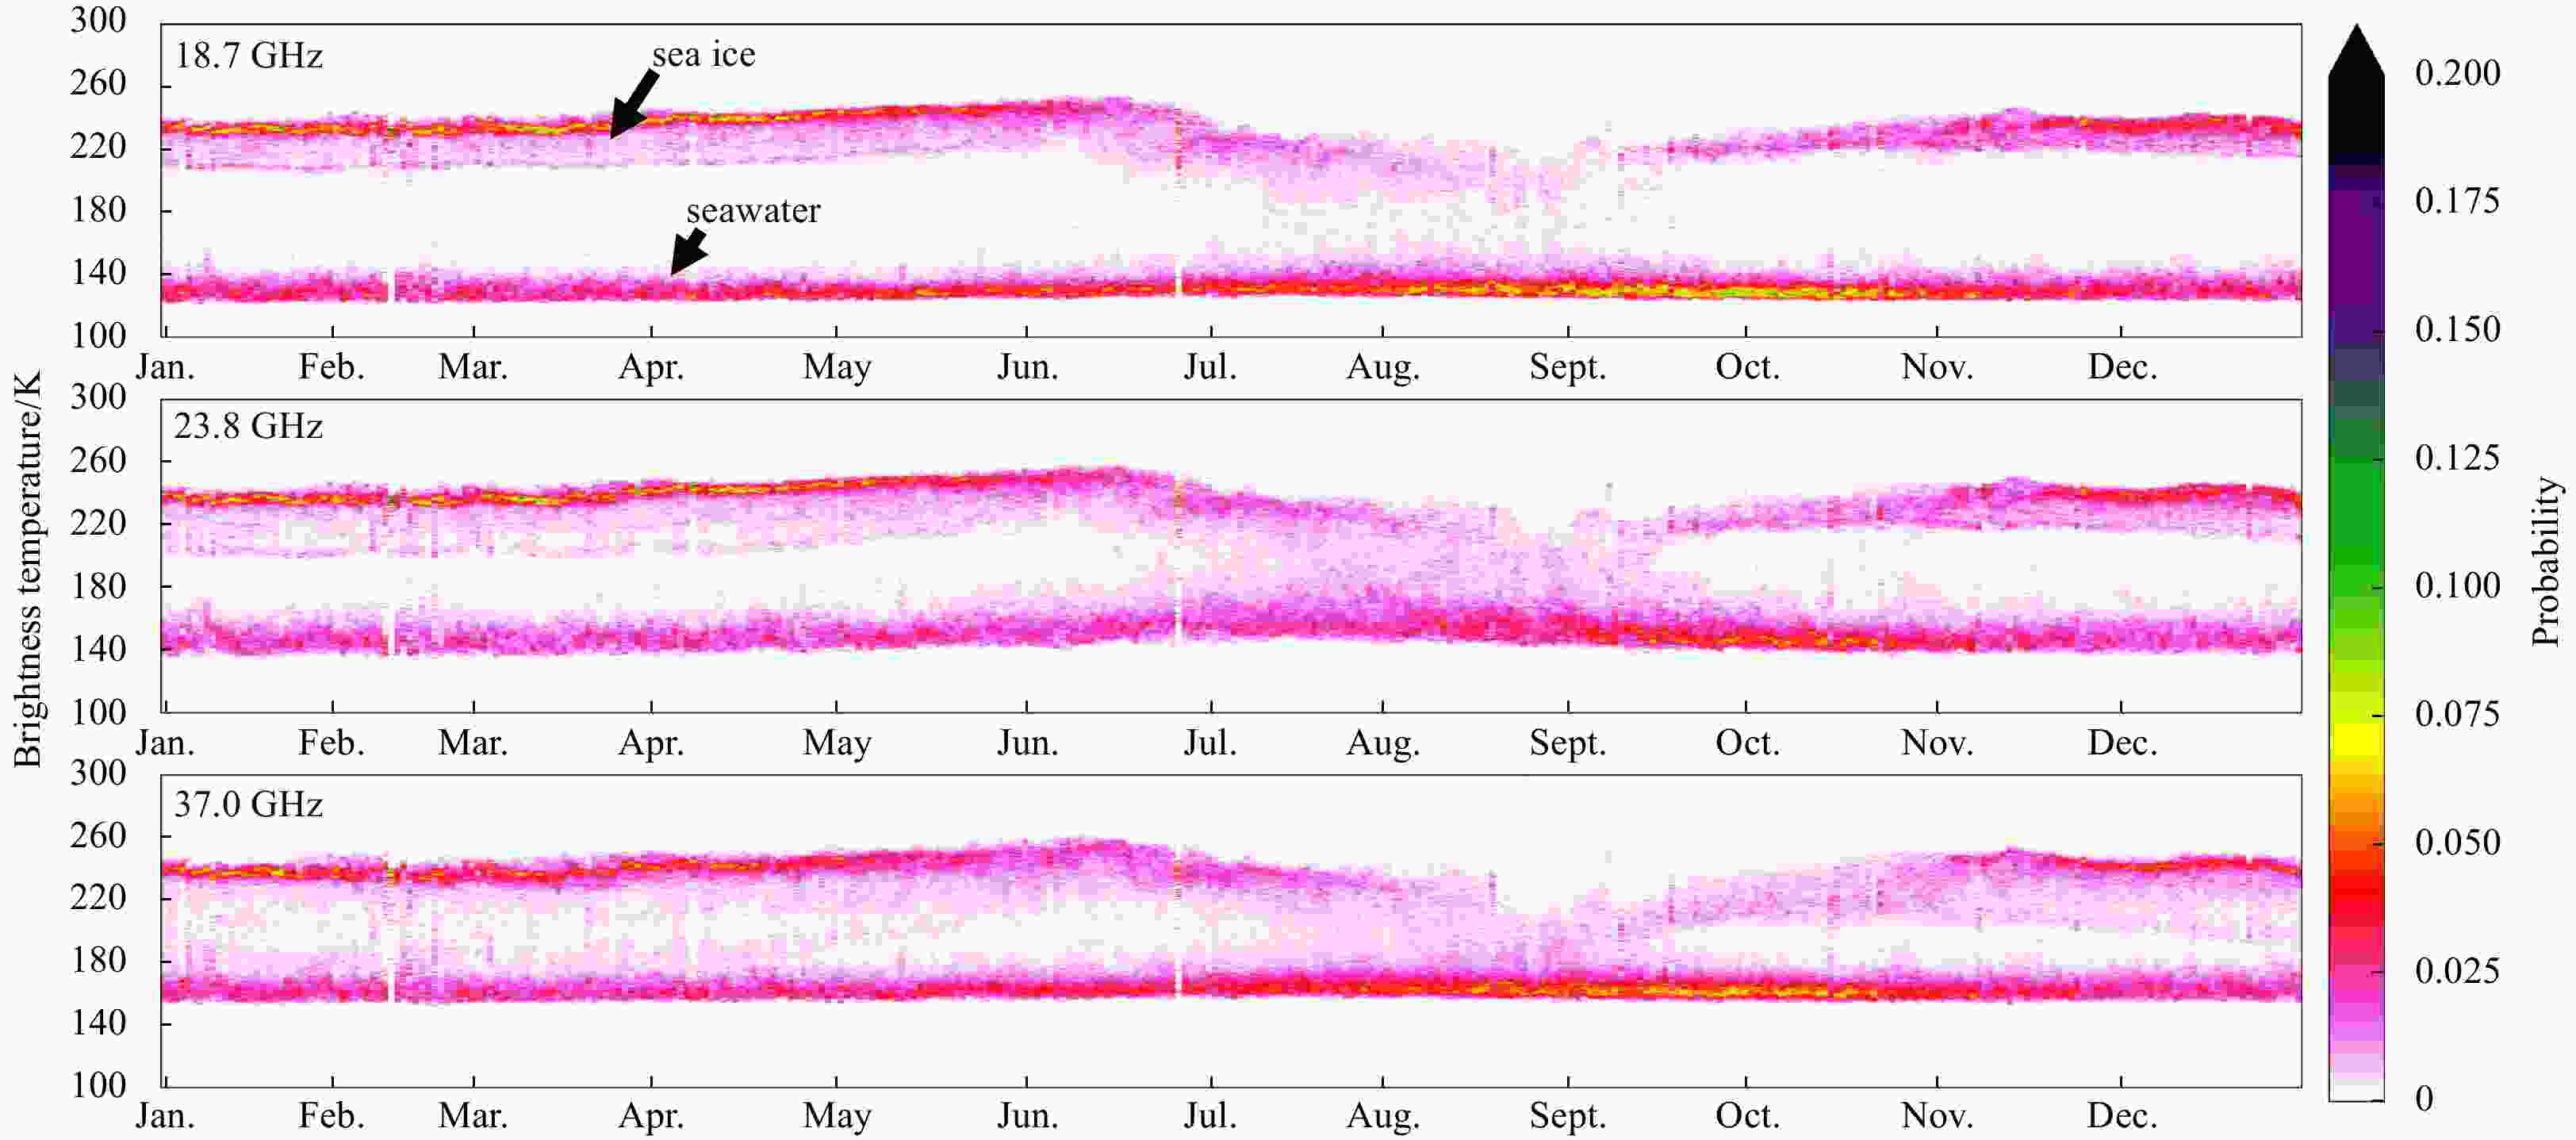
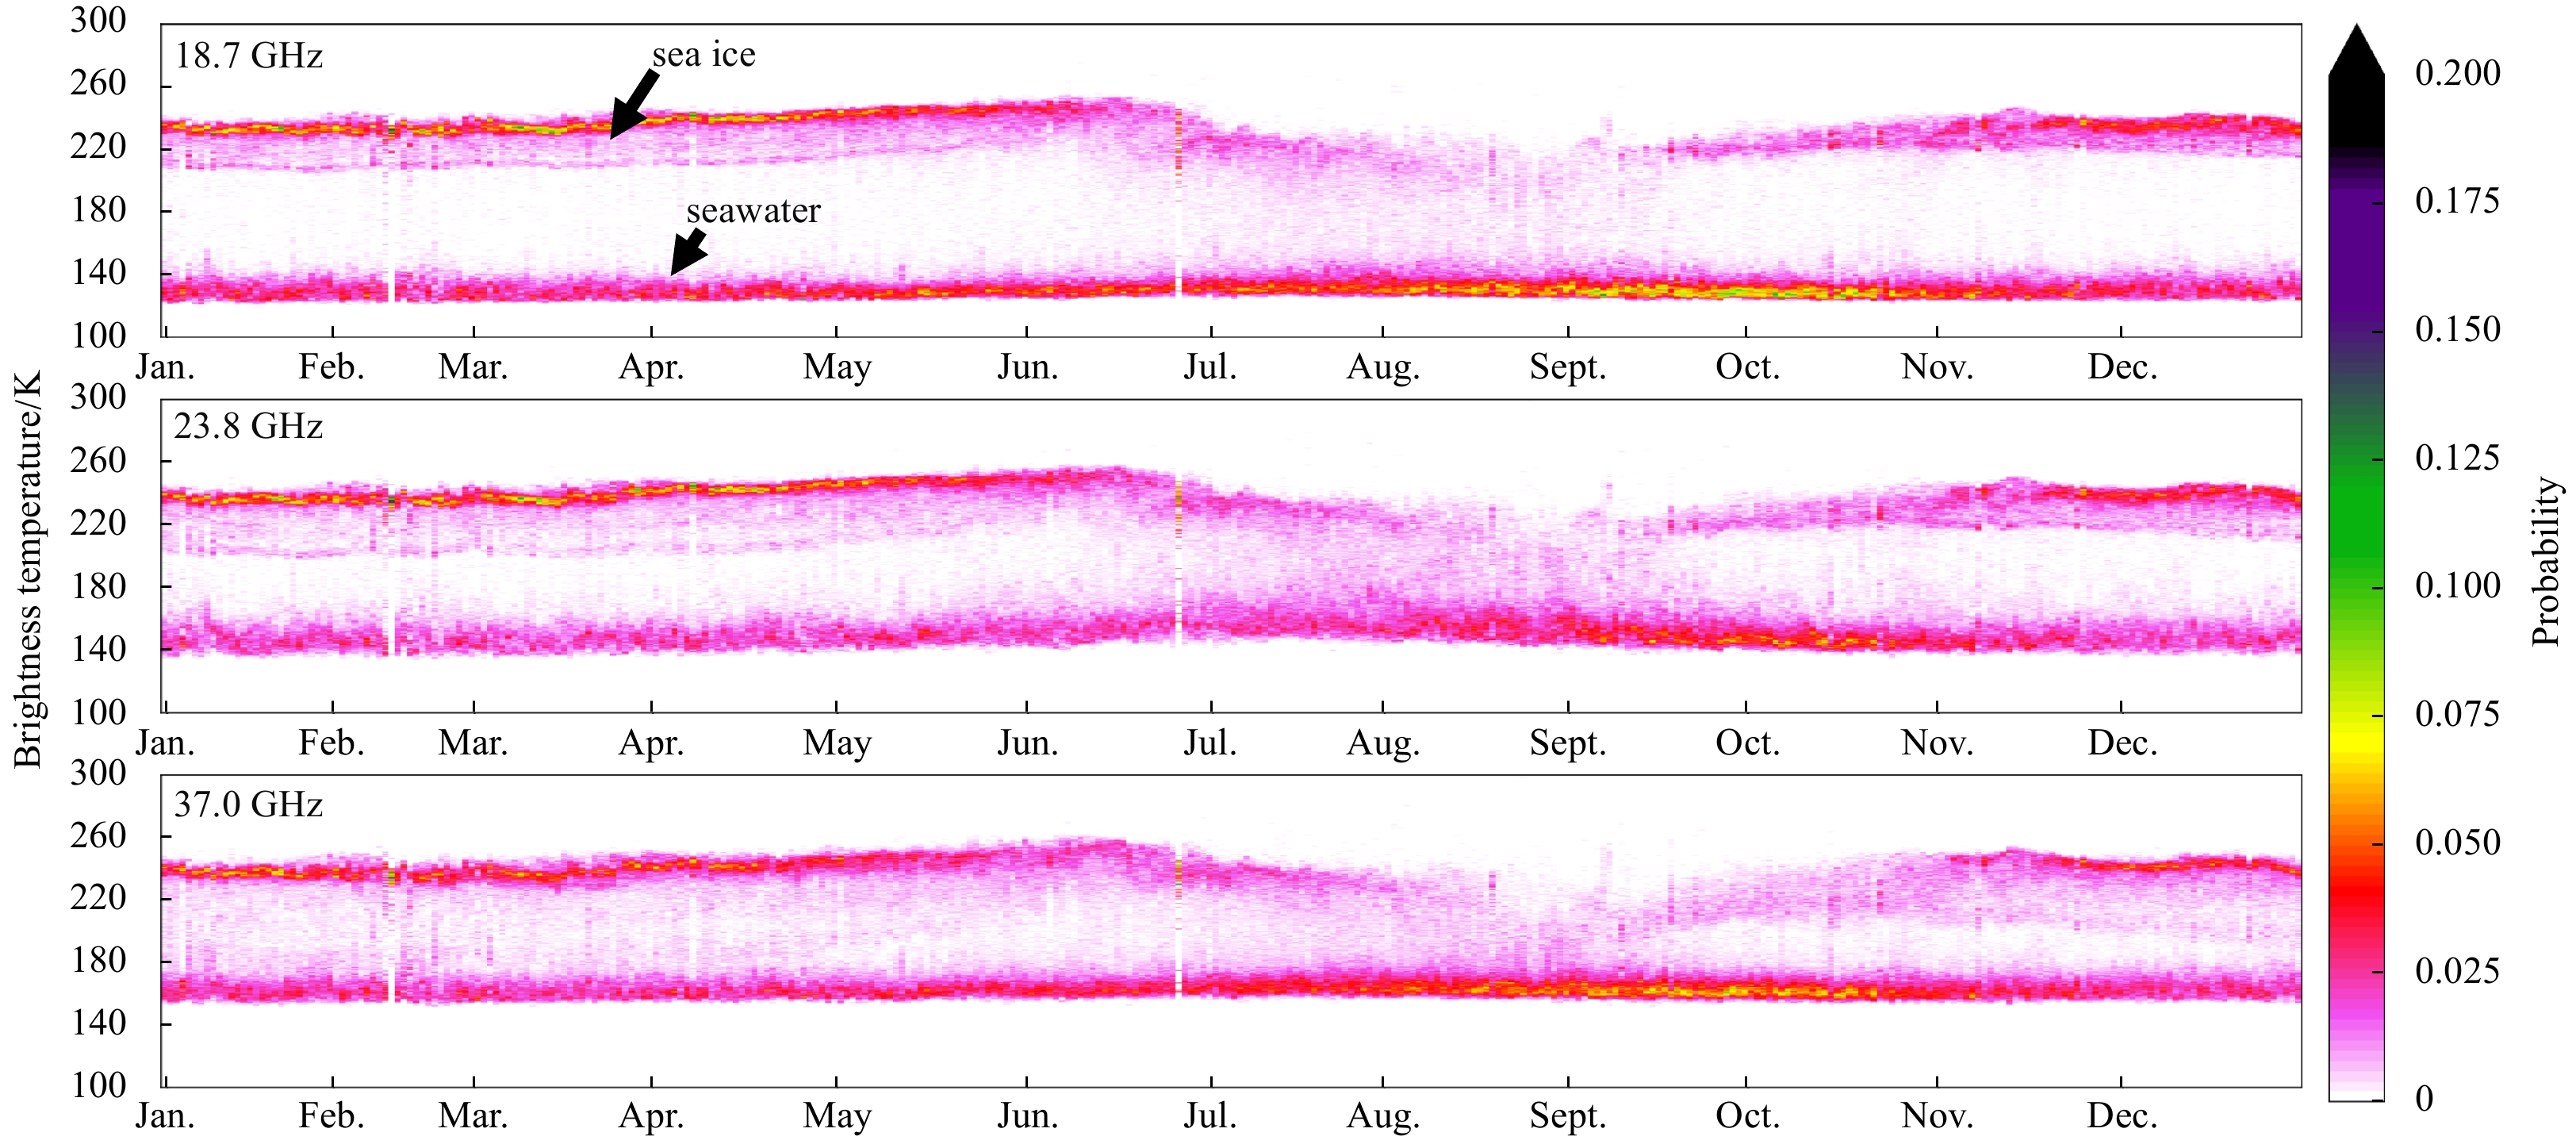
Figure 3. Daily brightness temperature time series histogram for the 2019 annual season.
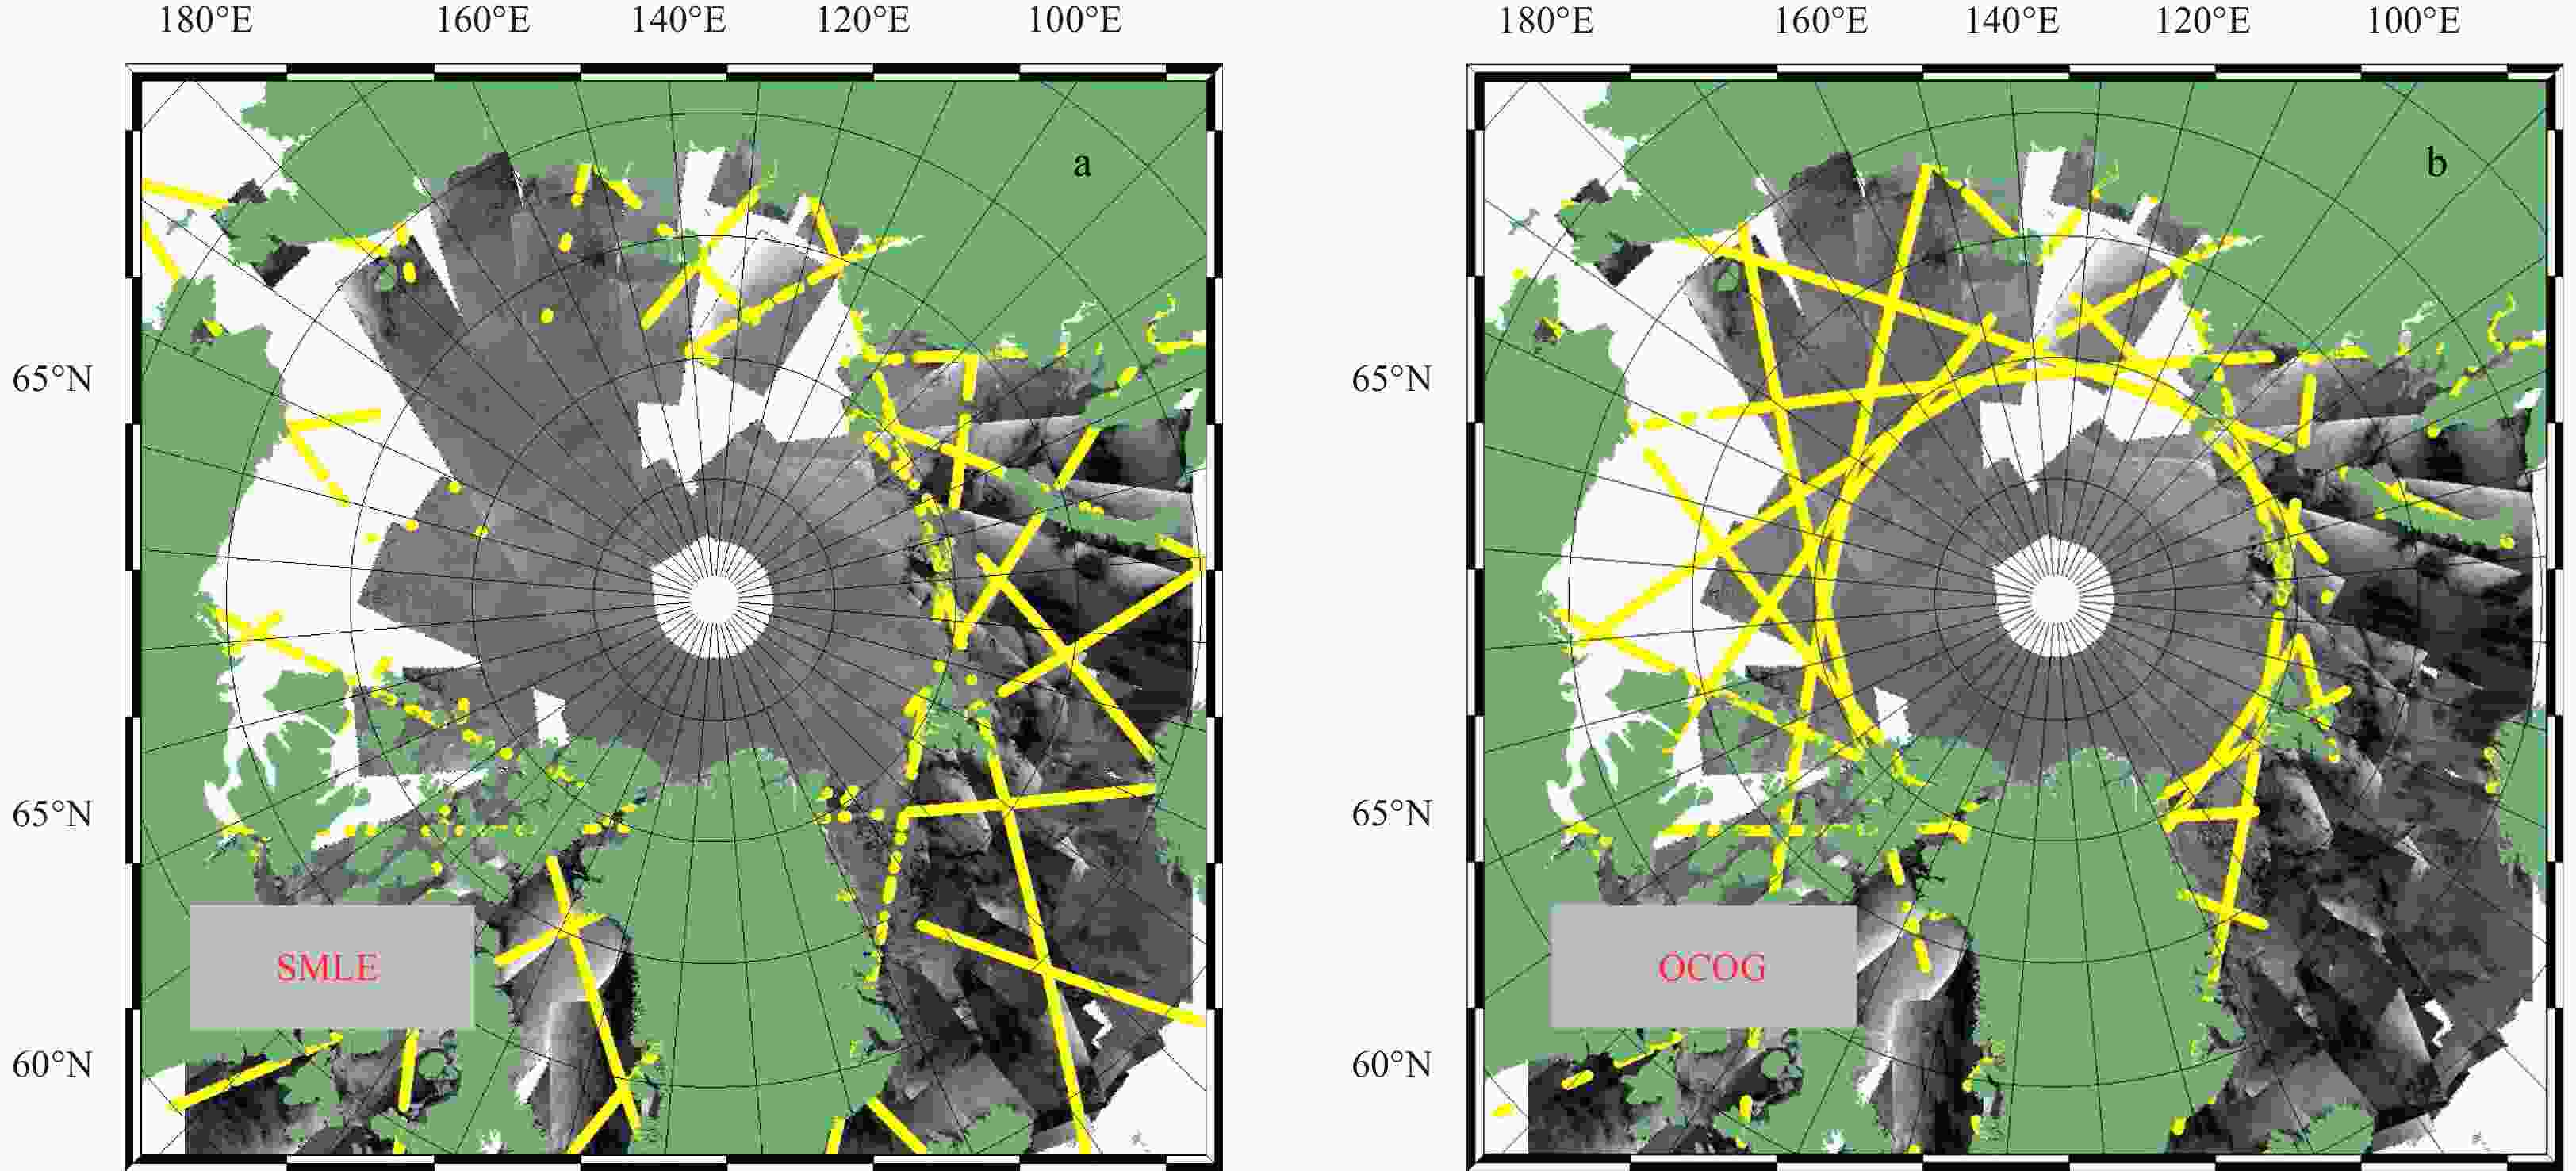
Figure 5. Distributions of the different tracking packages flags on July 15, 2019: SMLE packages flags (a); OCOG packages flags (b).
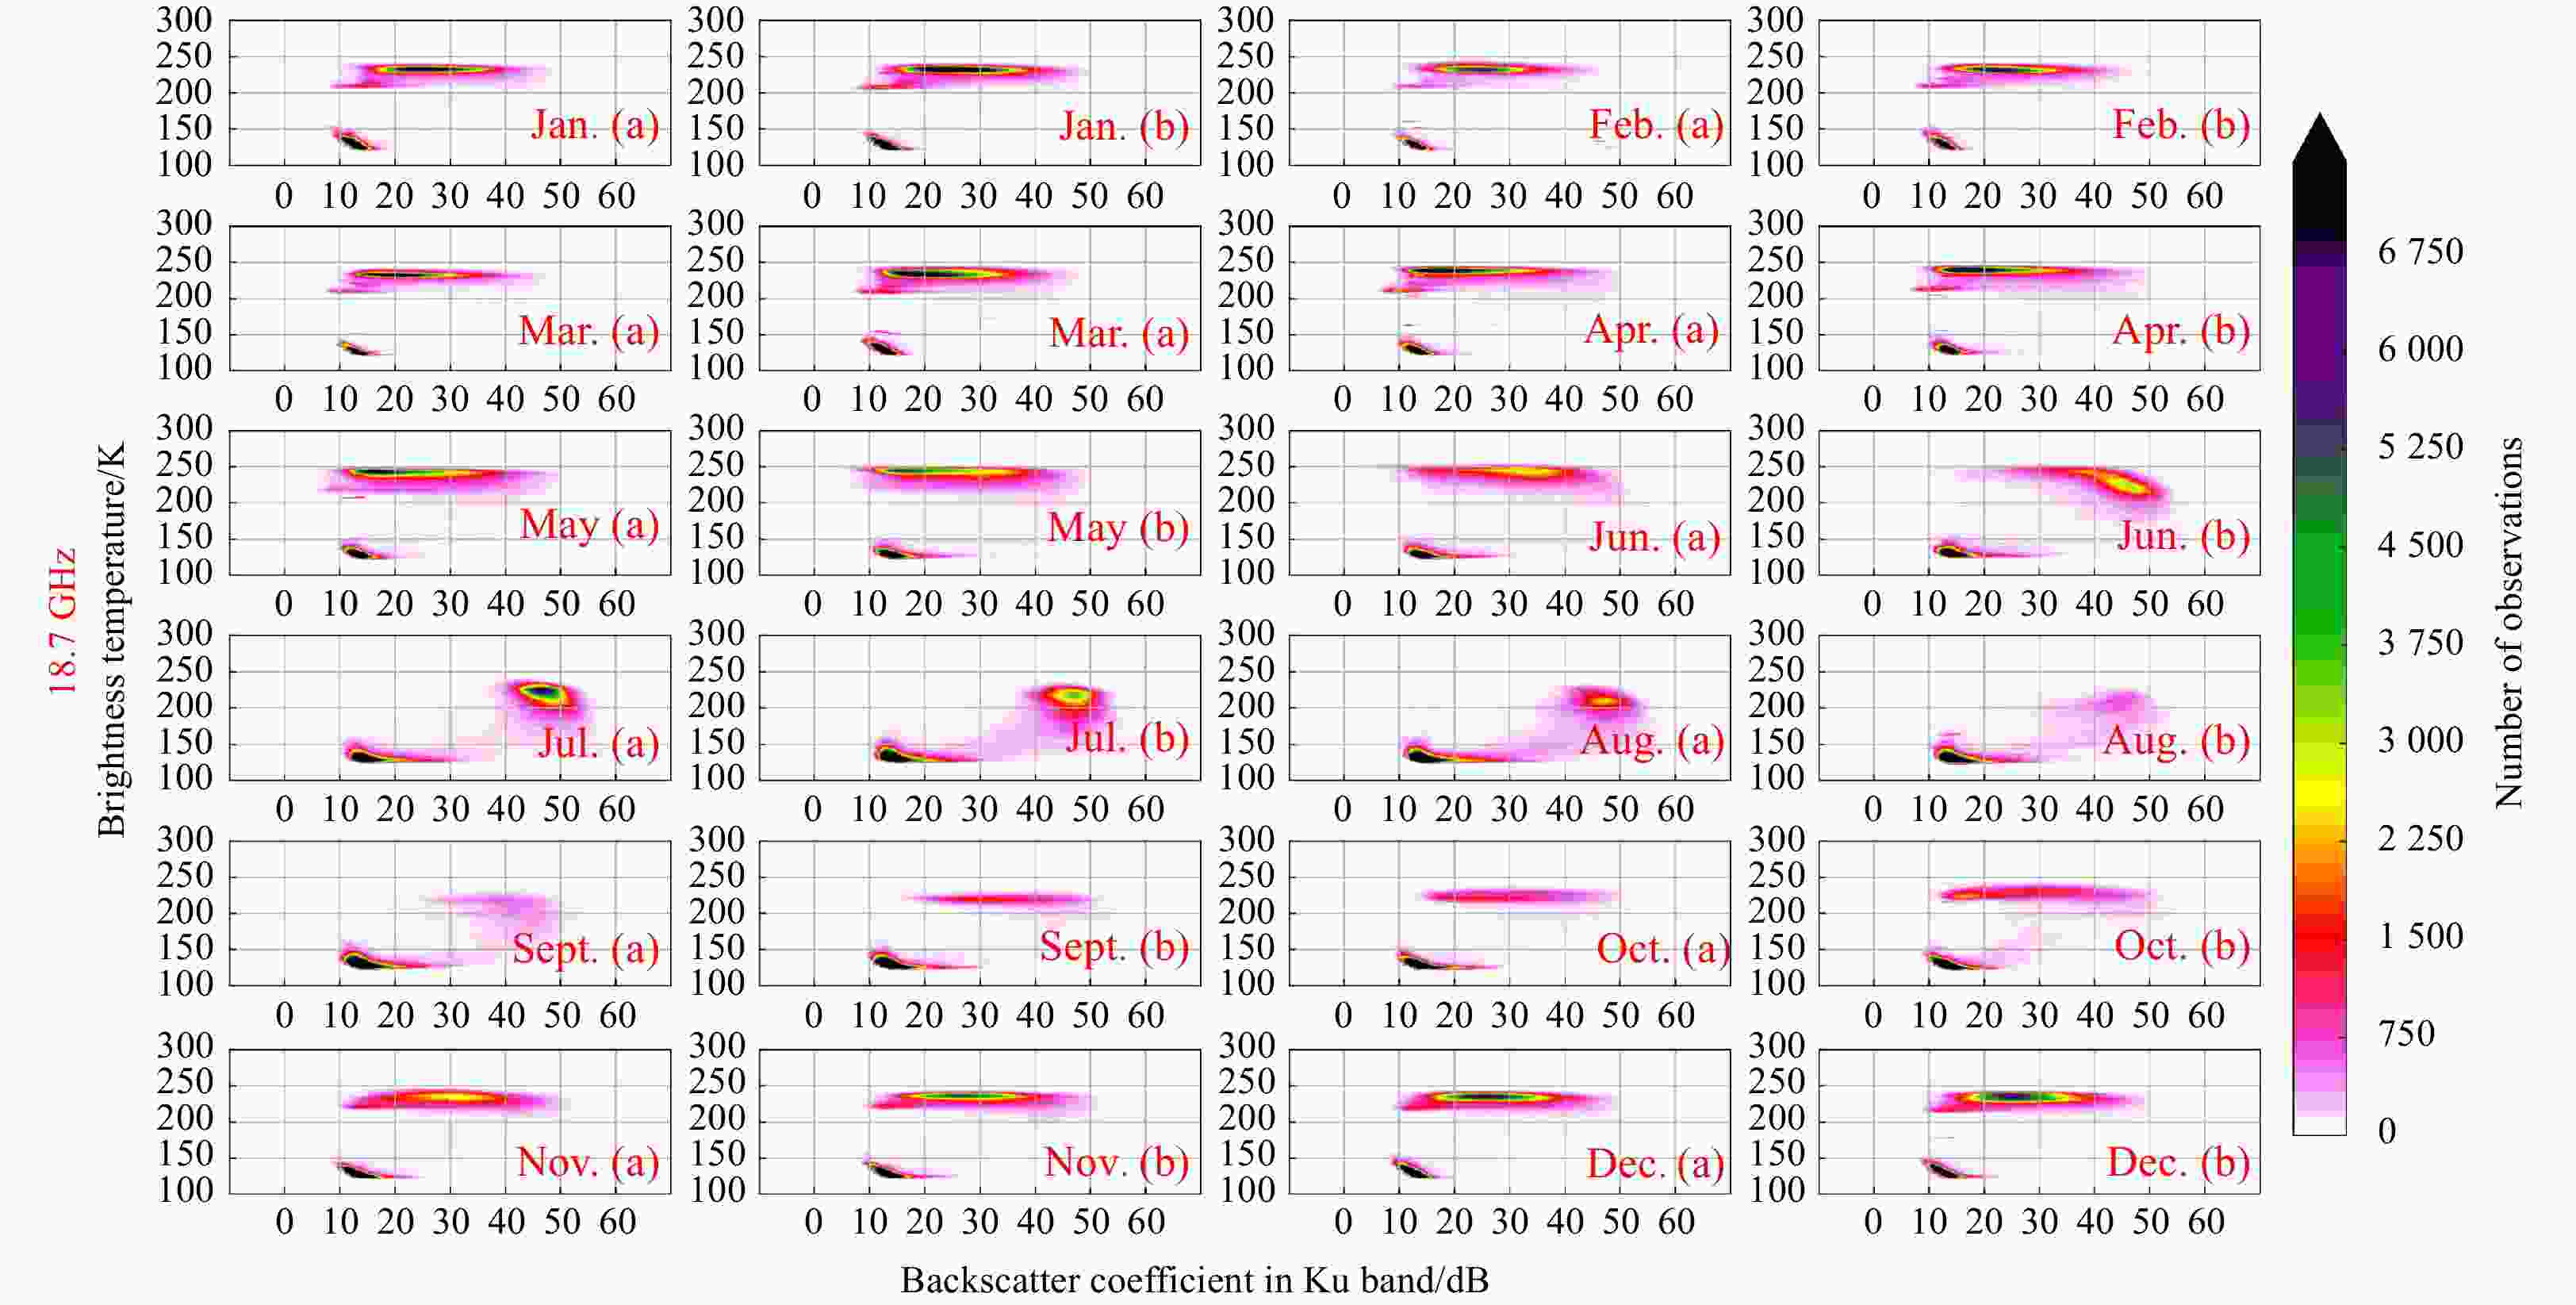
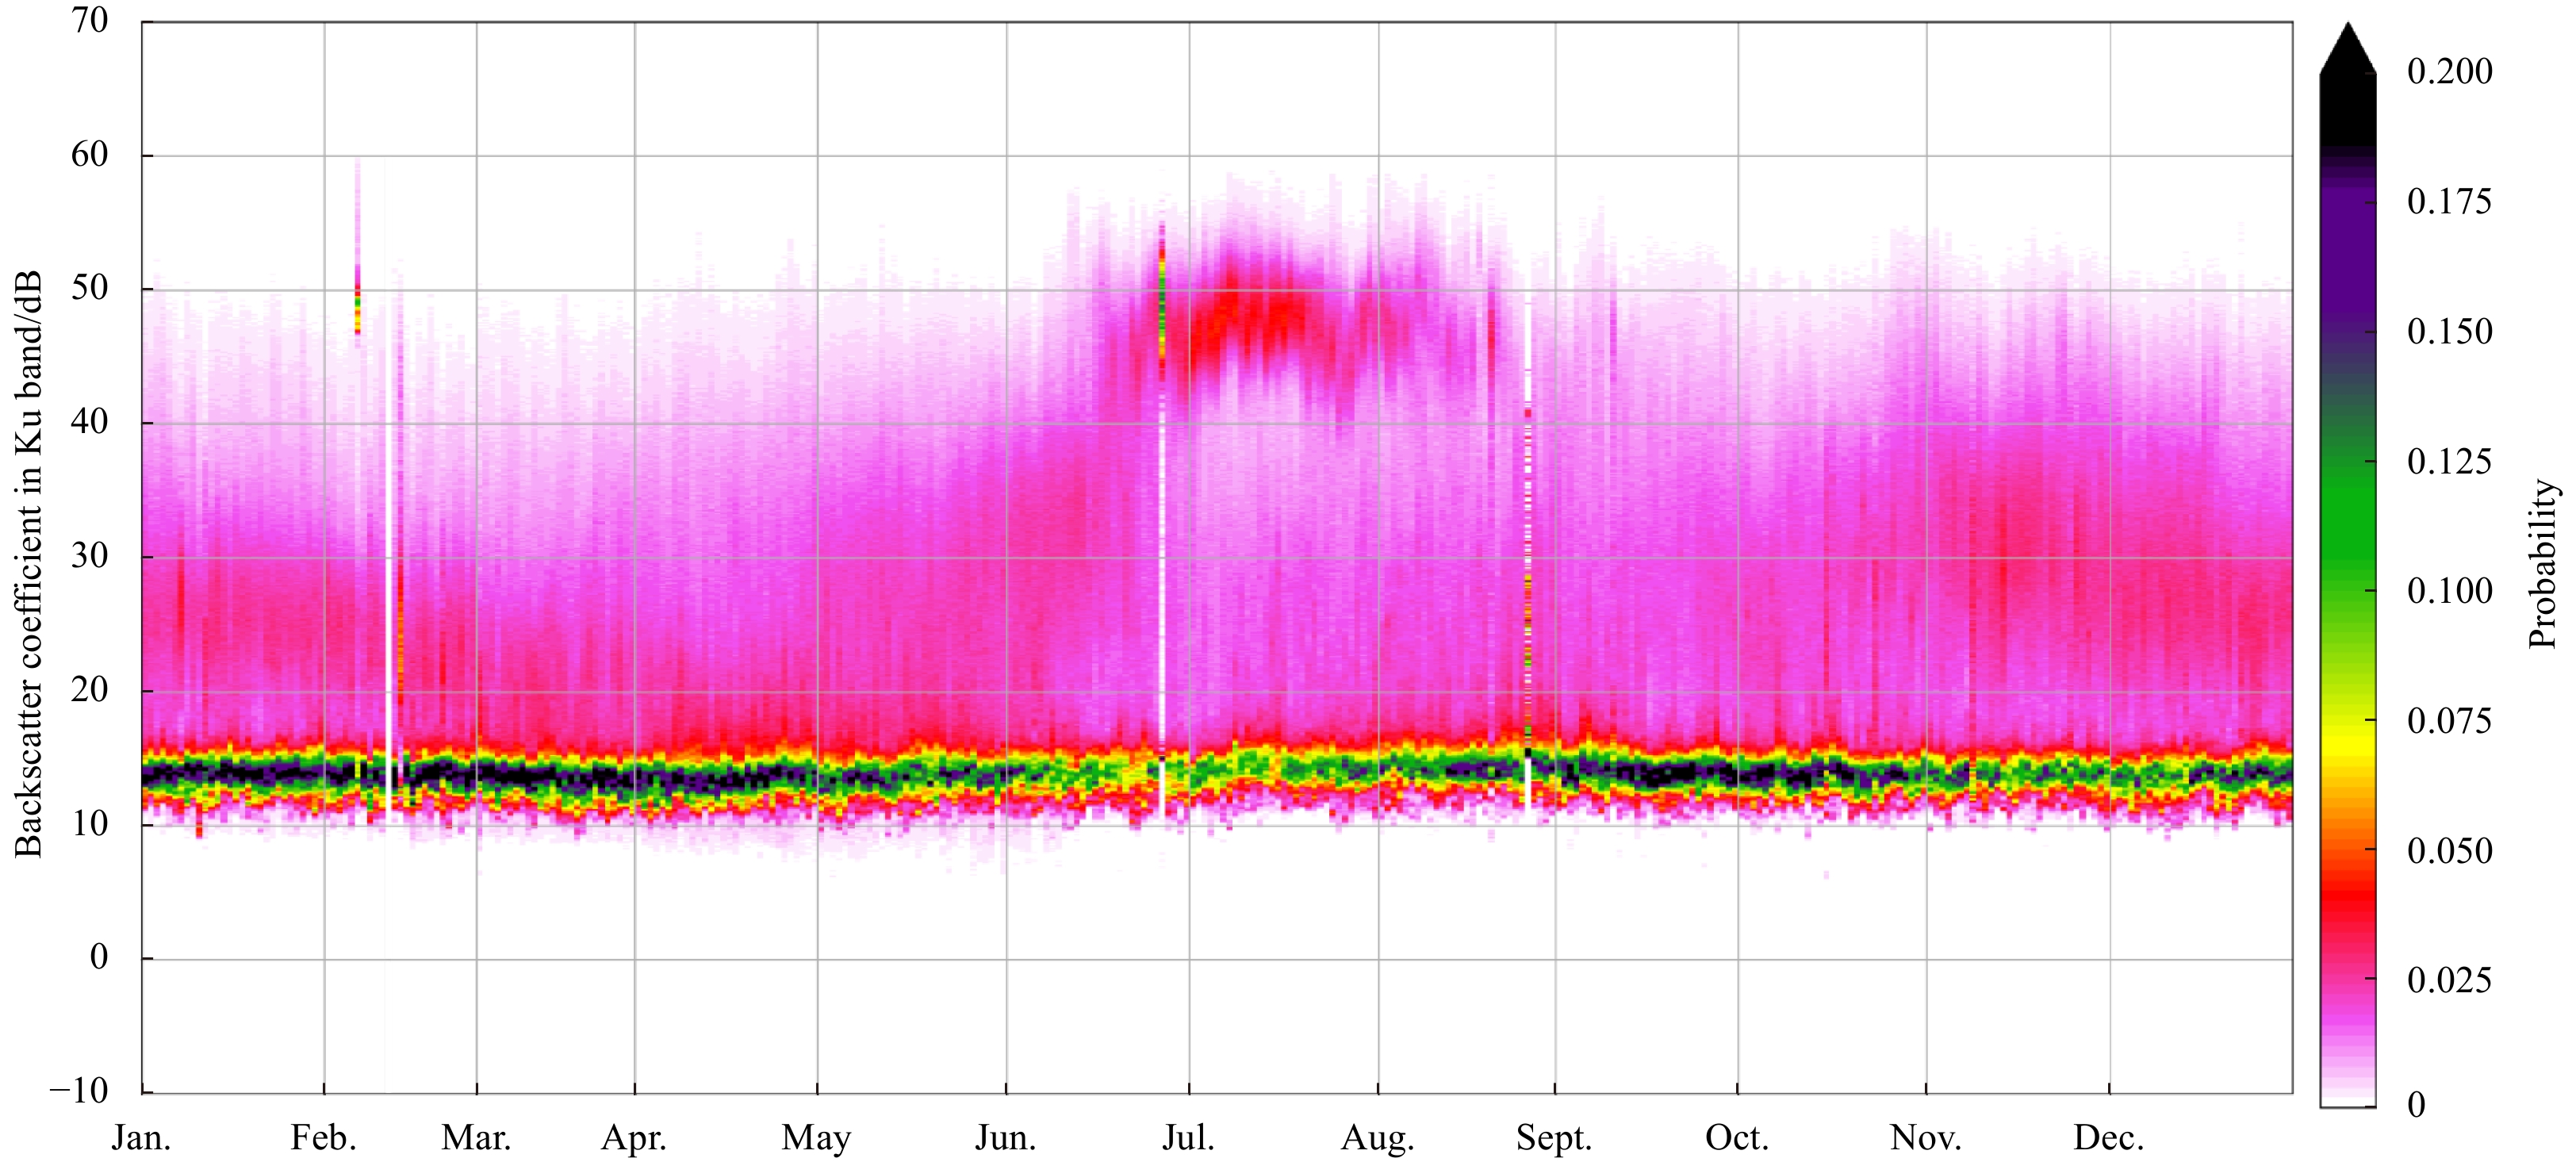
Figure 6. Two-dimensional joint histograms of brightness temperature and backscatter coefficient for the whole year of 2019. For each month, there are 2 (14-day) cycles, marked as a and b, respectively.
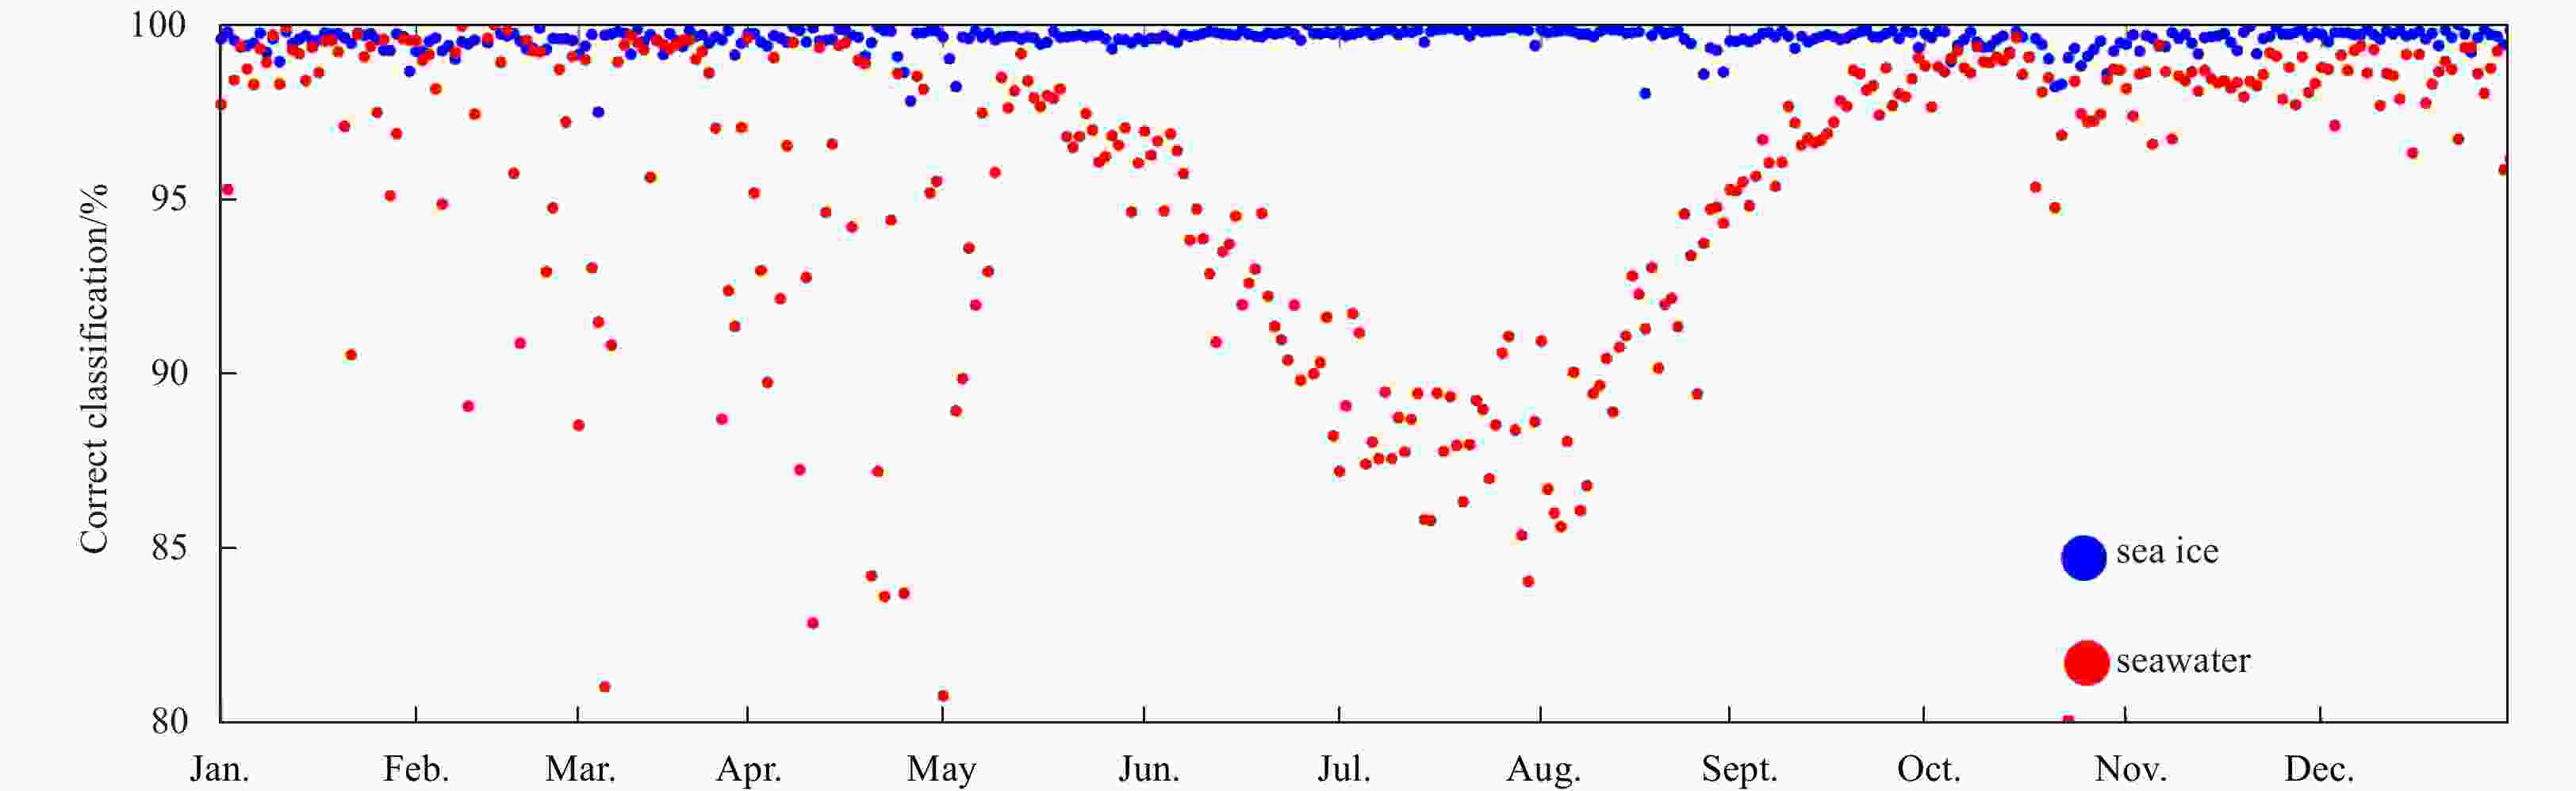
Figure 8. Daily accuracy ratings of the threshold segmentation of the sea ice/seawater separation.
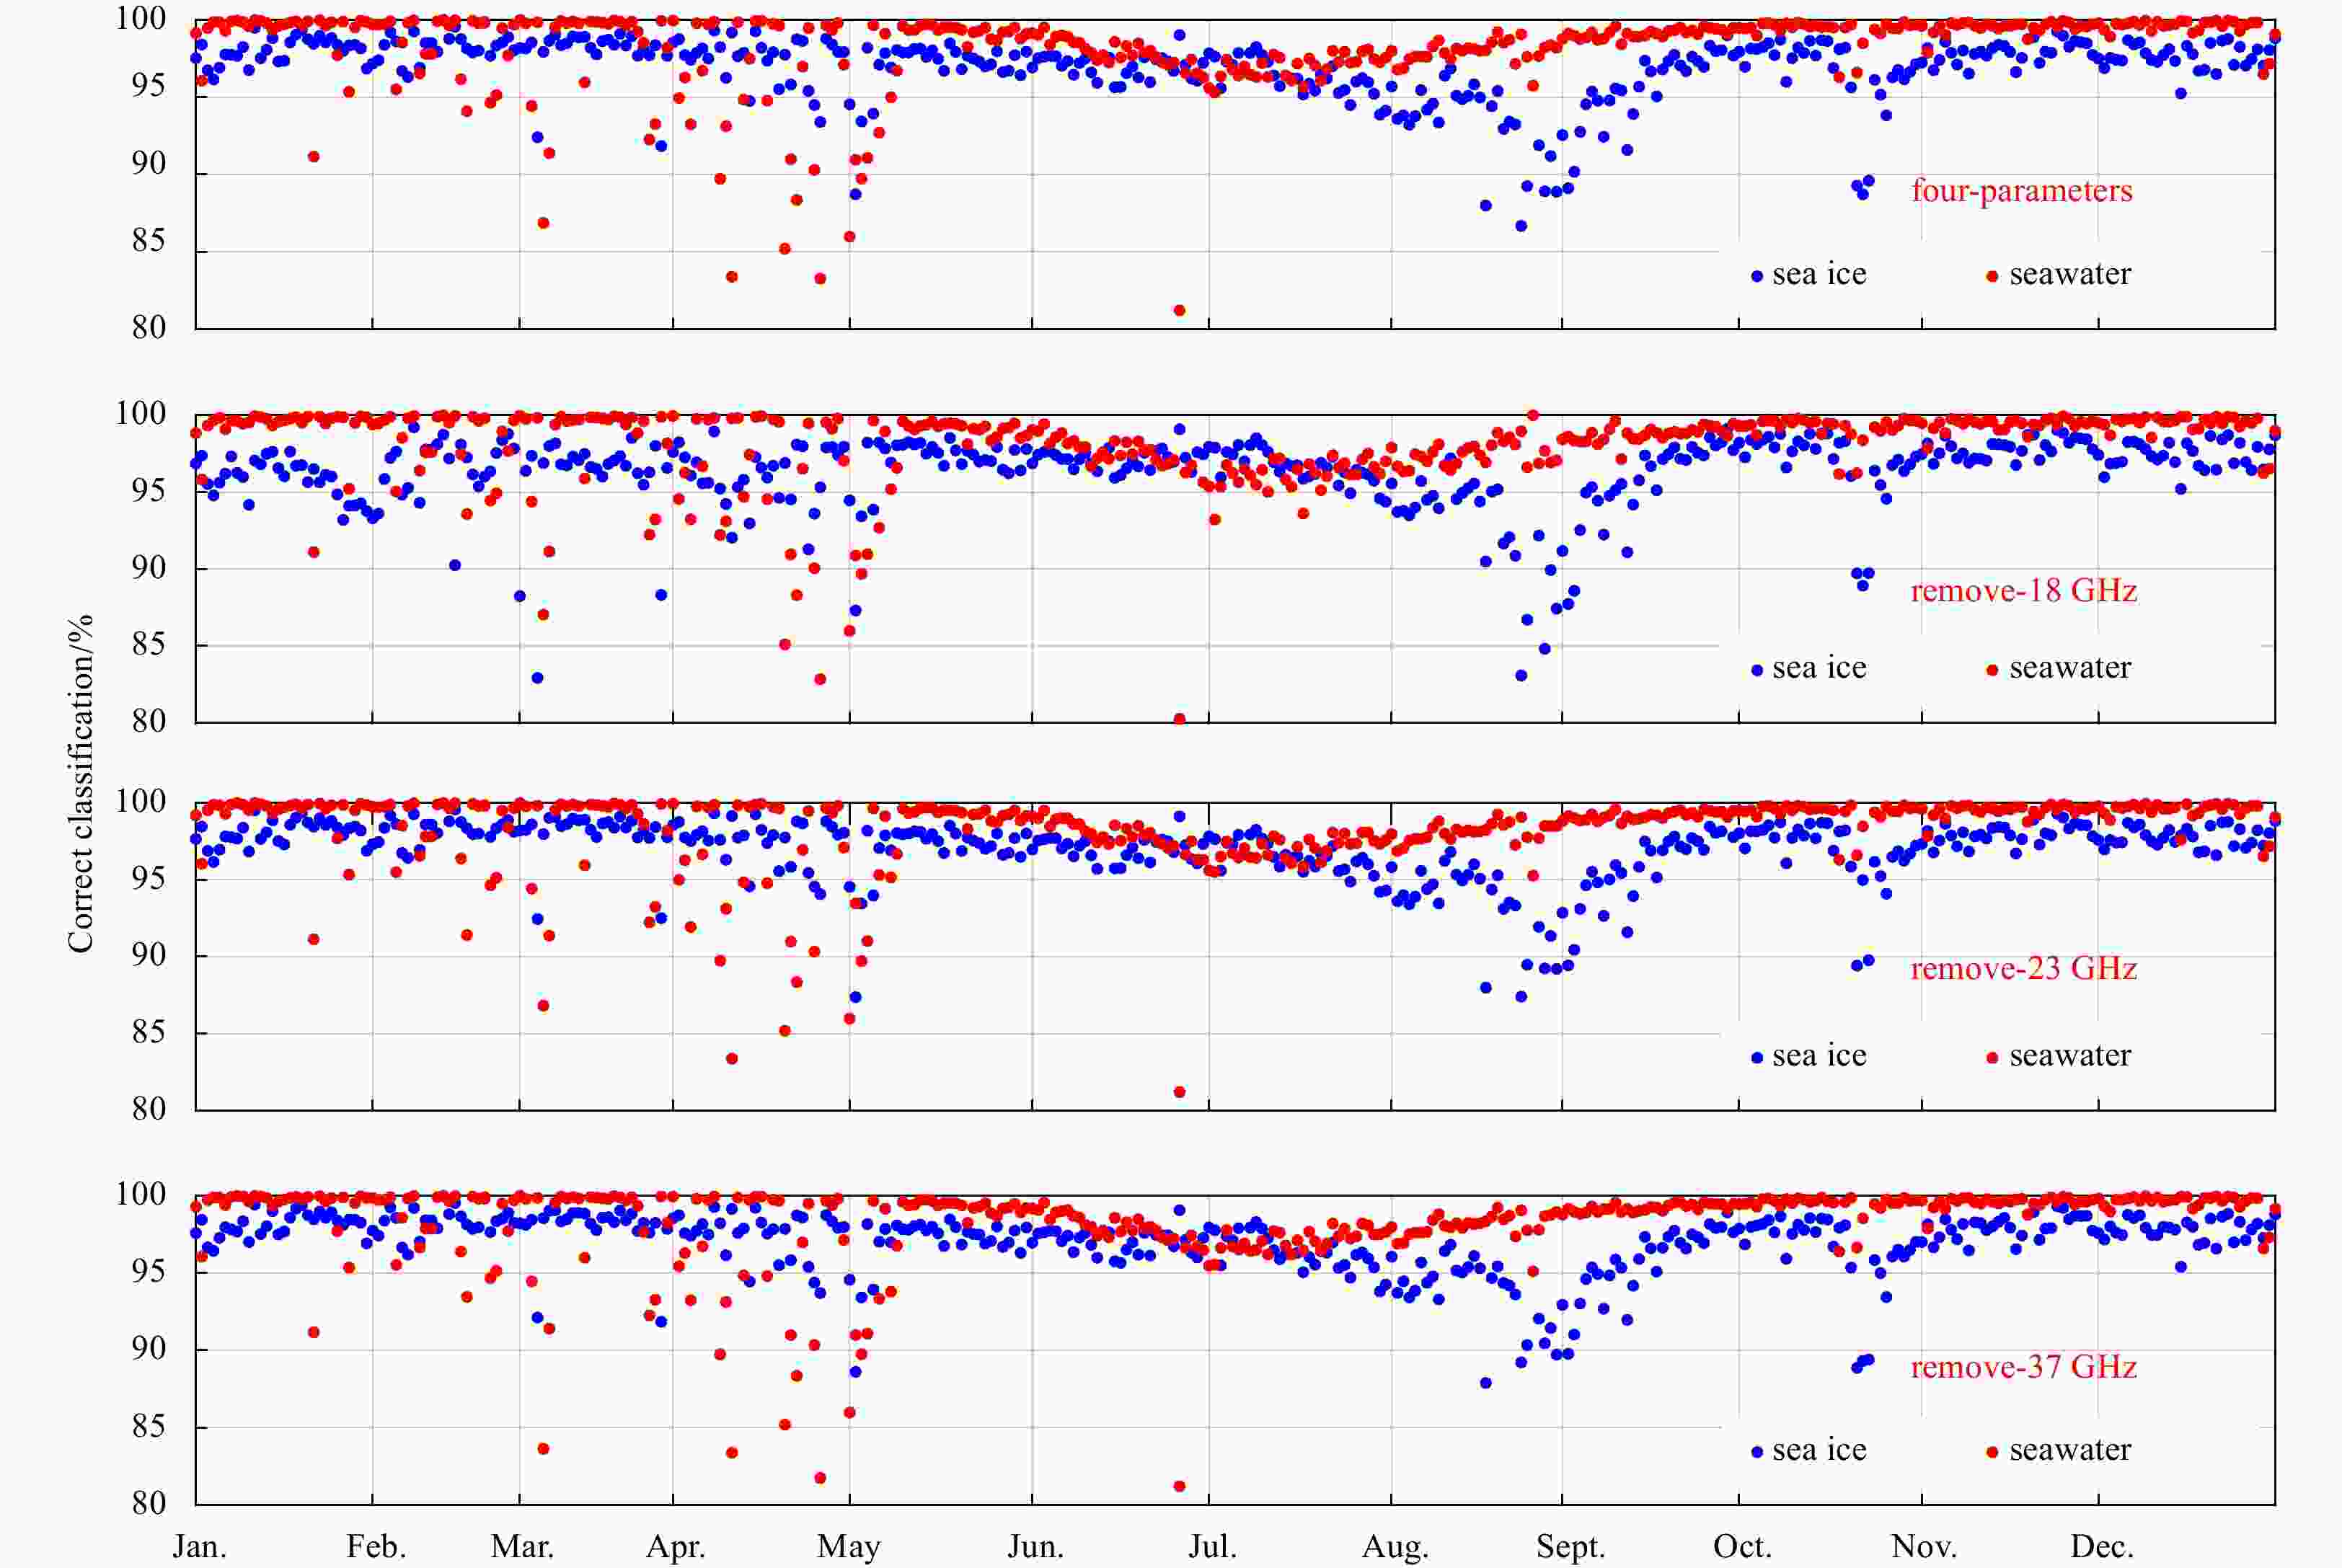
Figure 10. Daily accuracy ratings of the K-Means for the ice water/seawater separations.

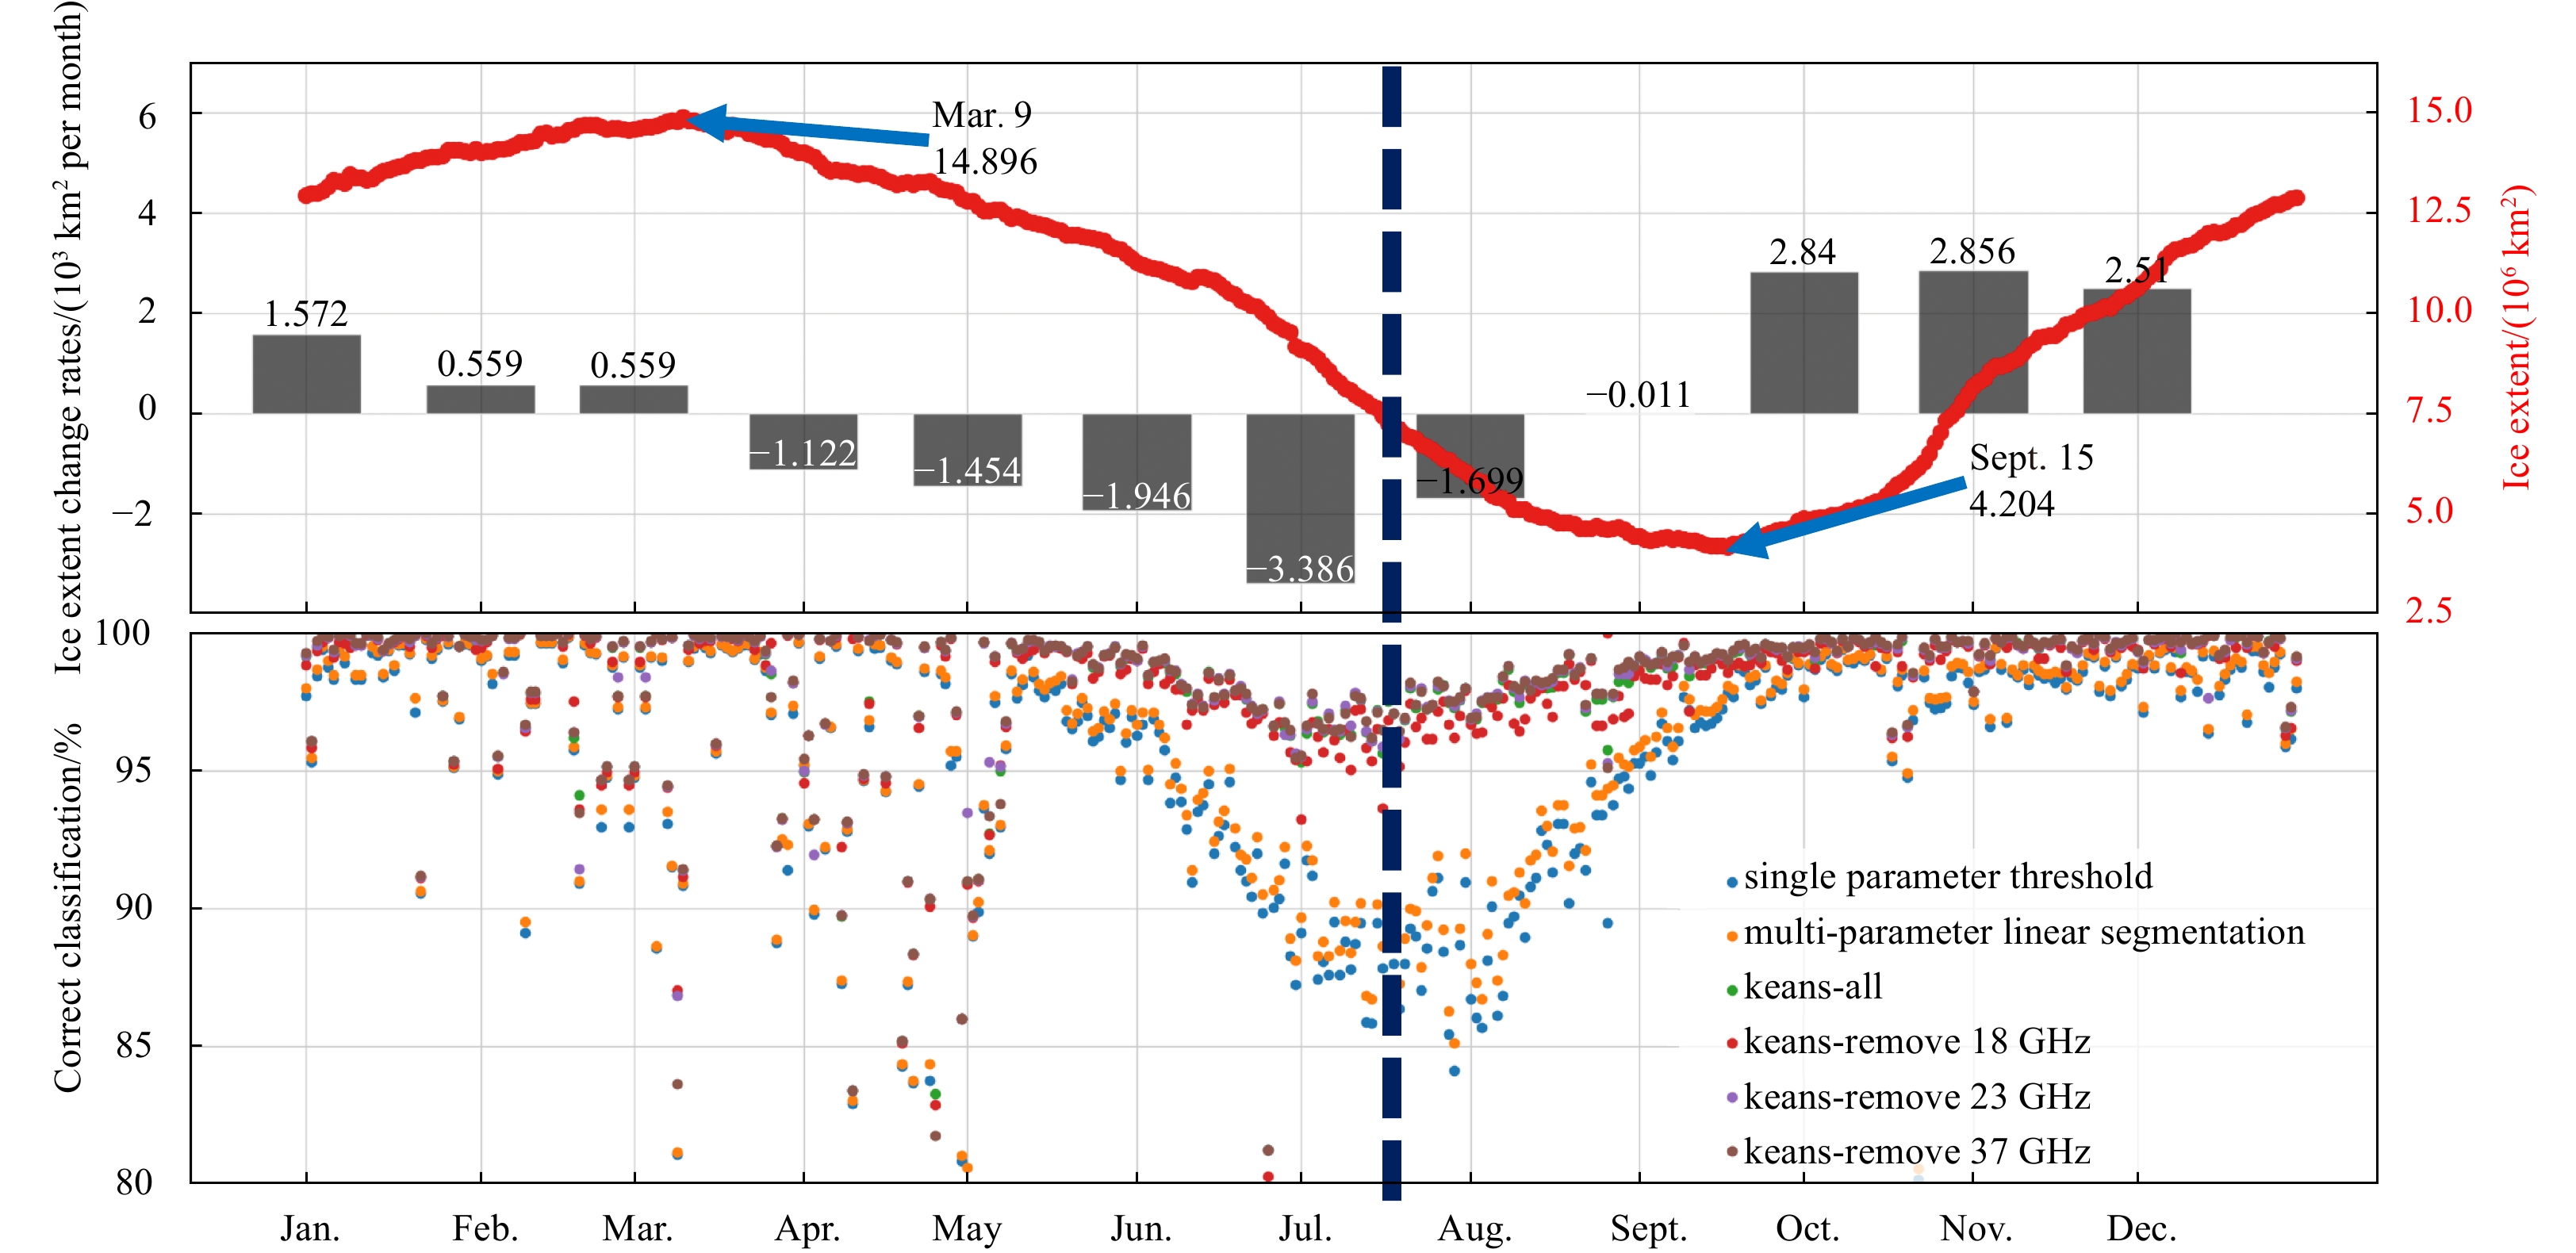
Figure 11. The join map of the time series plot of ice extent change rates and sea ice extent and the correct classification result of seawater during 2019.

Figure 12. The join map of the time series plot of ice extent change rates and sea ice extent and the correct classification result of sea ice during 2019.
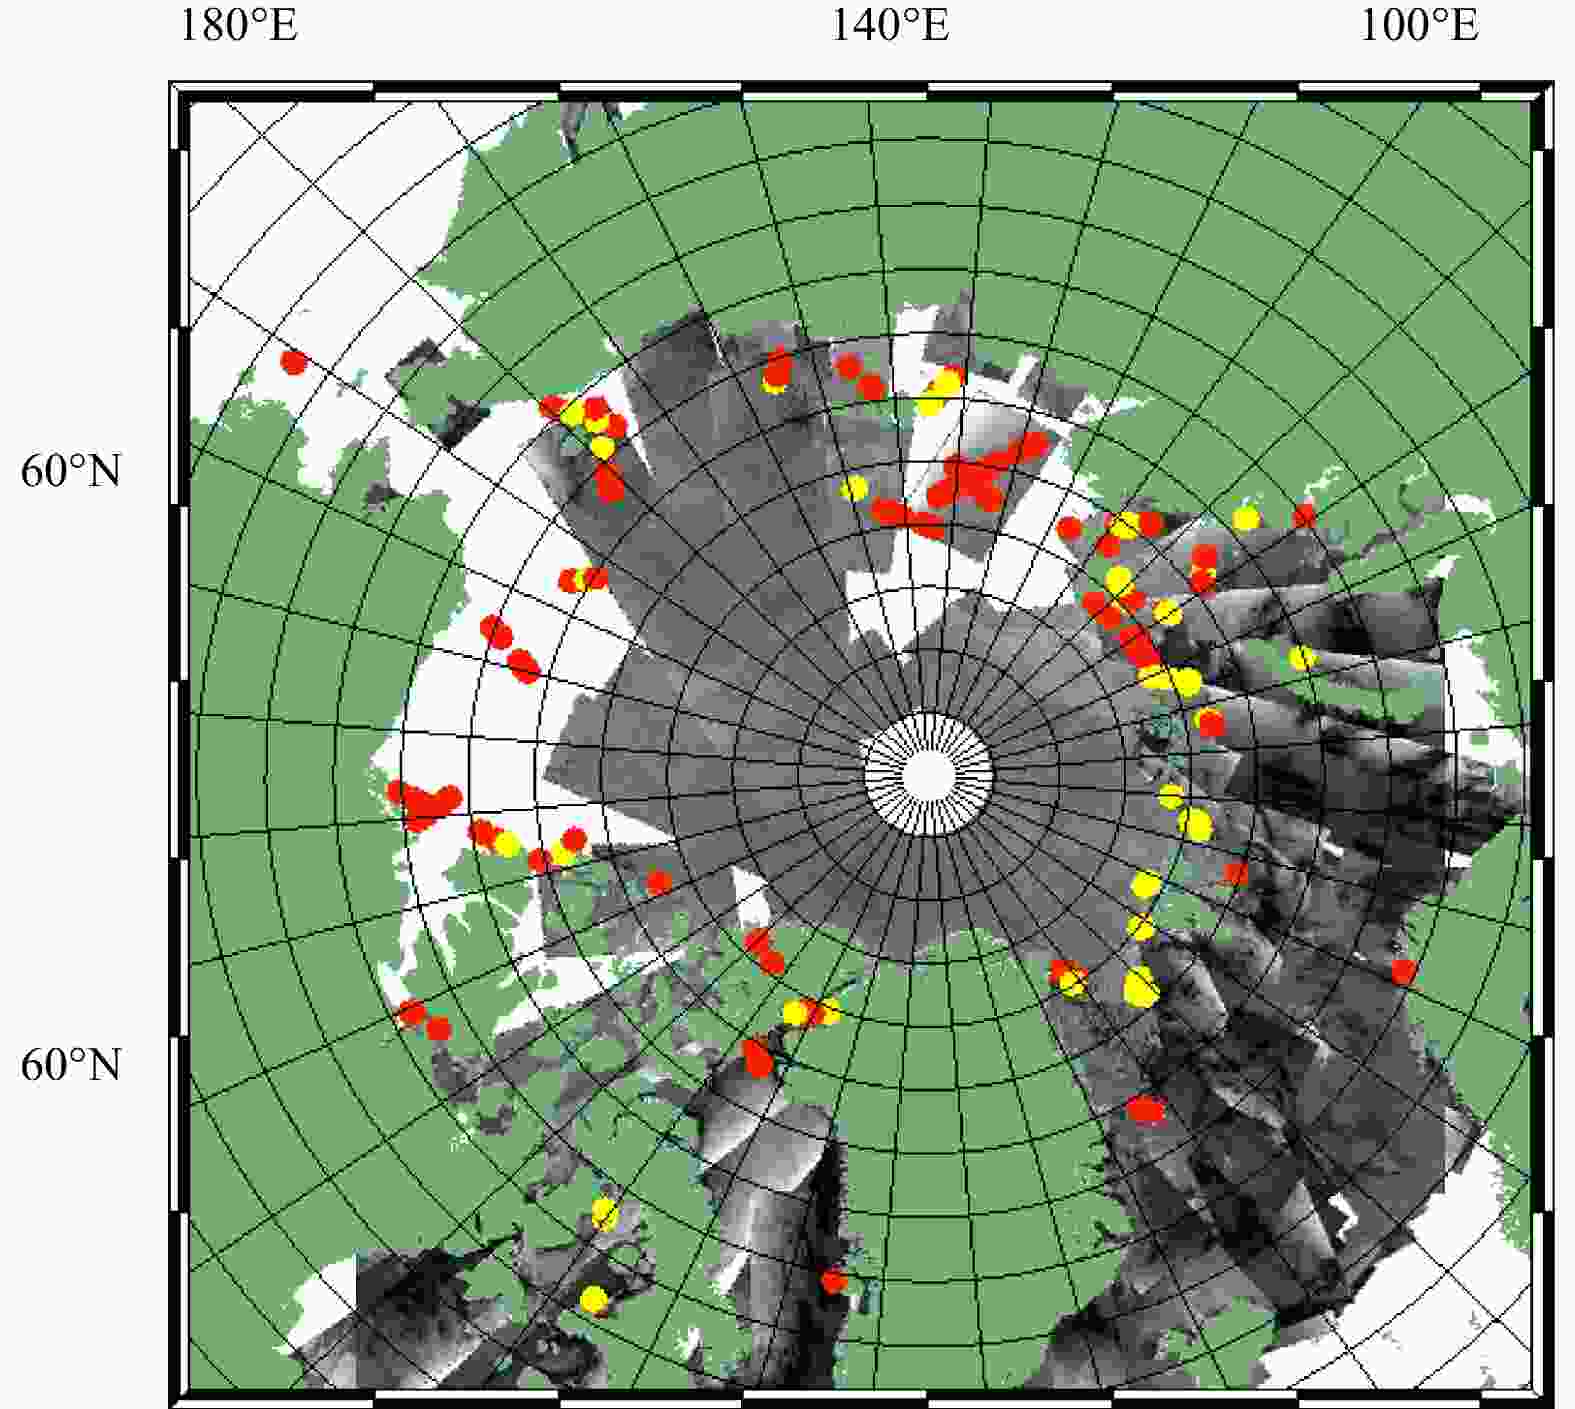
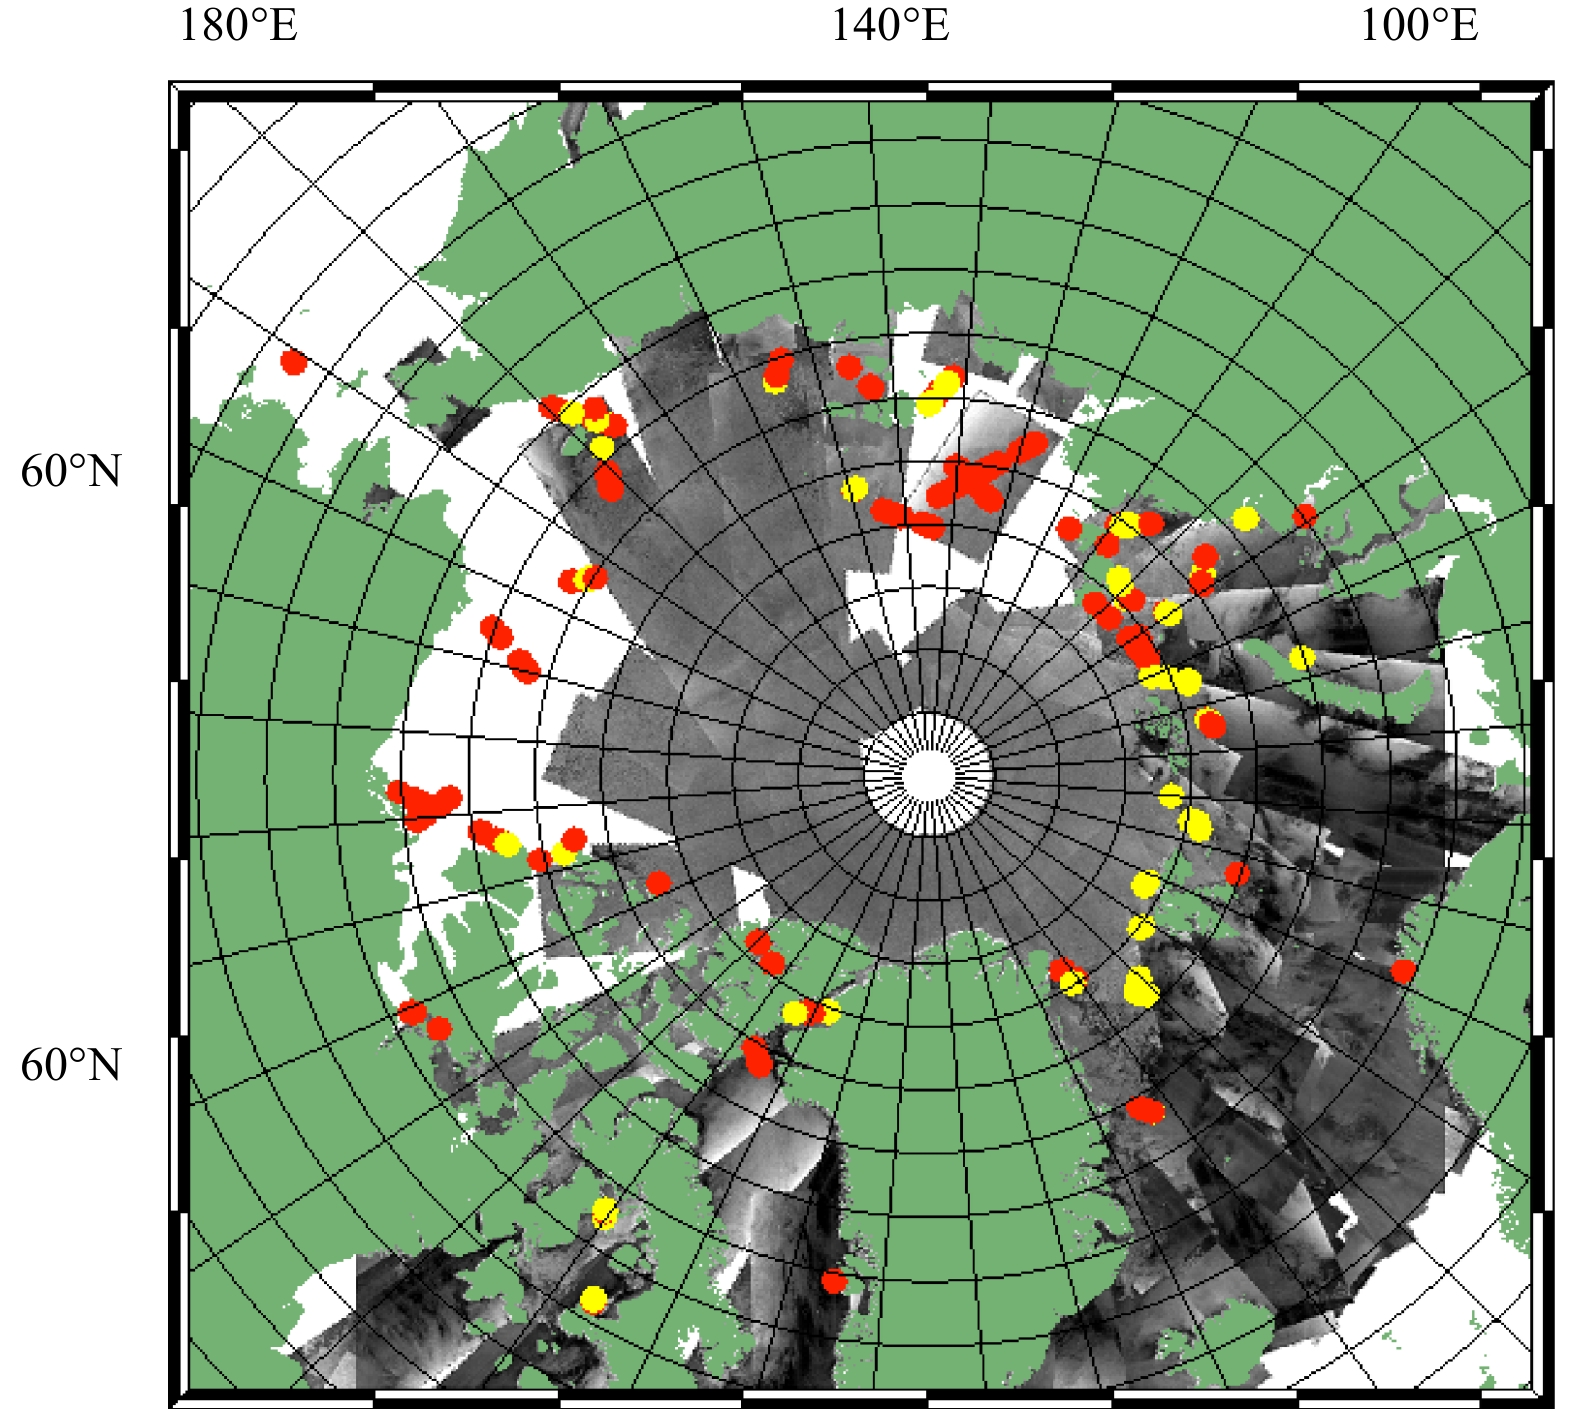
Figure 13. Comparison of the multi-parameter linear segmentation and the OSI-SAF products. The data were collected on July 15, 2019. In the figure, the areas that the OSI-SAF product marked as seawater and the multi-parameter linear segmentation marked as sea ice are shown in red. The areas that the OSI-SAF product marked as sea ice and the multi-parameter linear segmentation marked as seawater are shown in yellow.
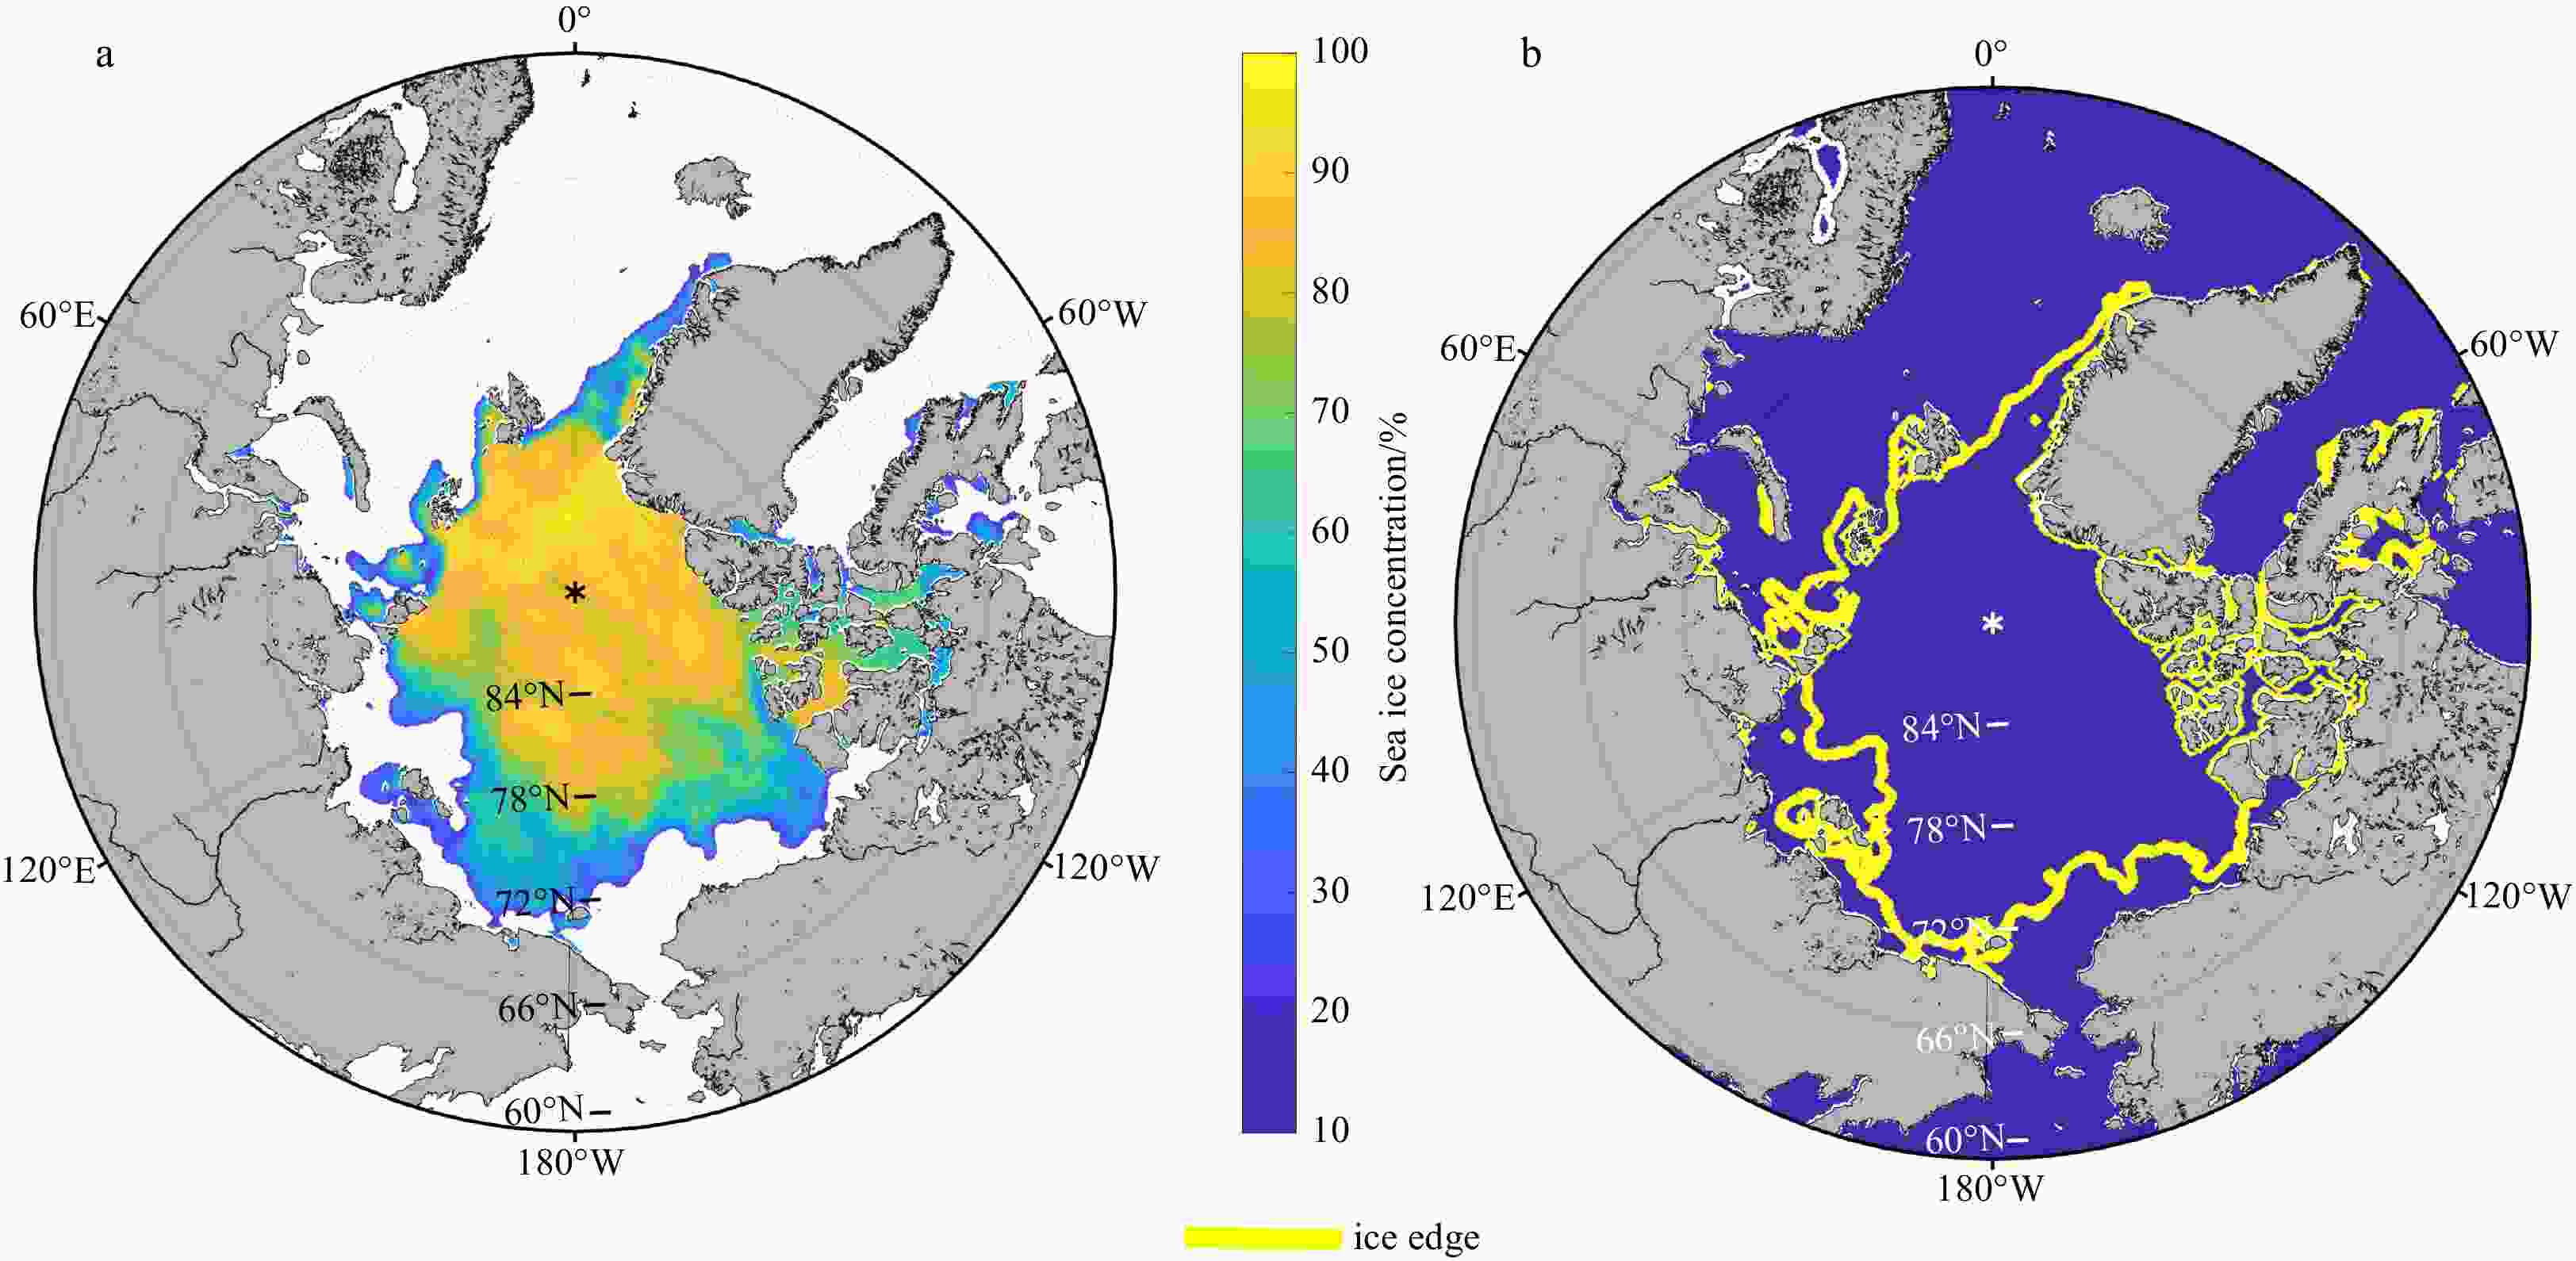
Figure 14. Extraction of the ice edge areas on July 15, 2019: a. Sea ice concentrations of OSI-SAF; b. results of the sea ice edge extractions.
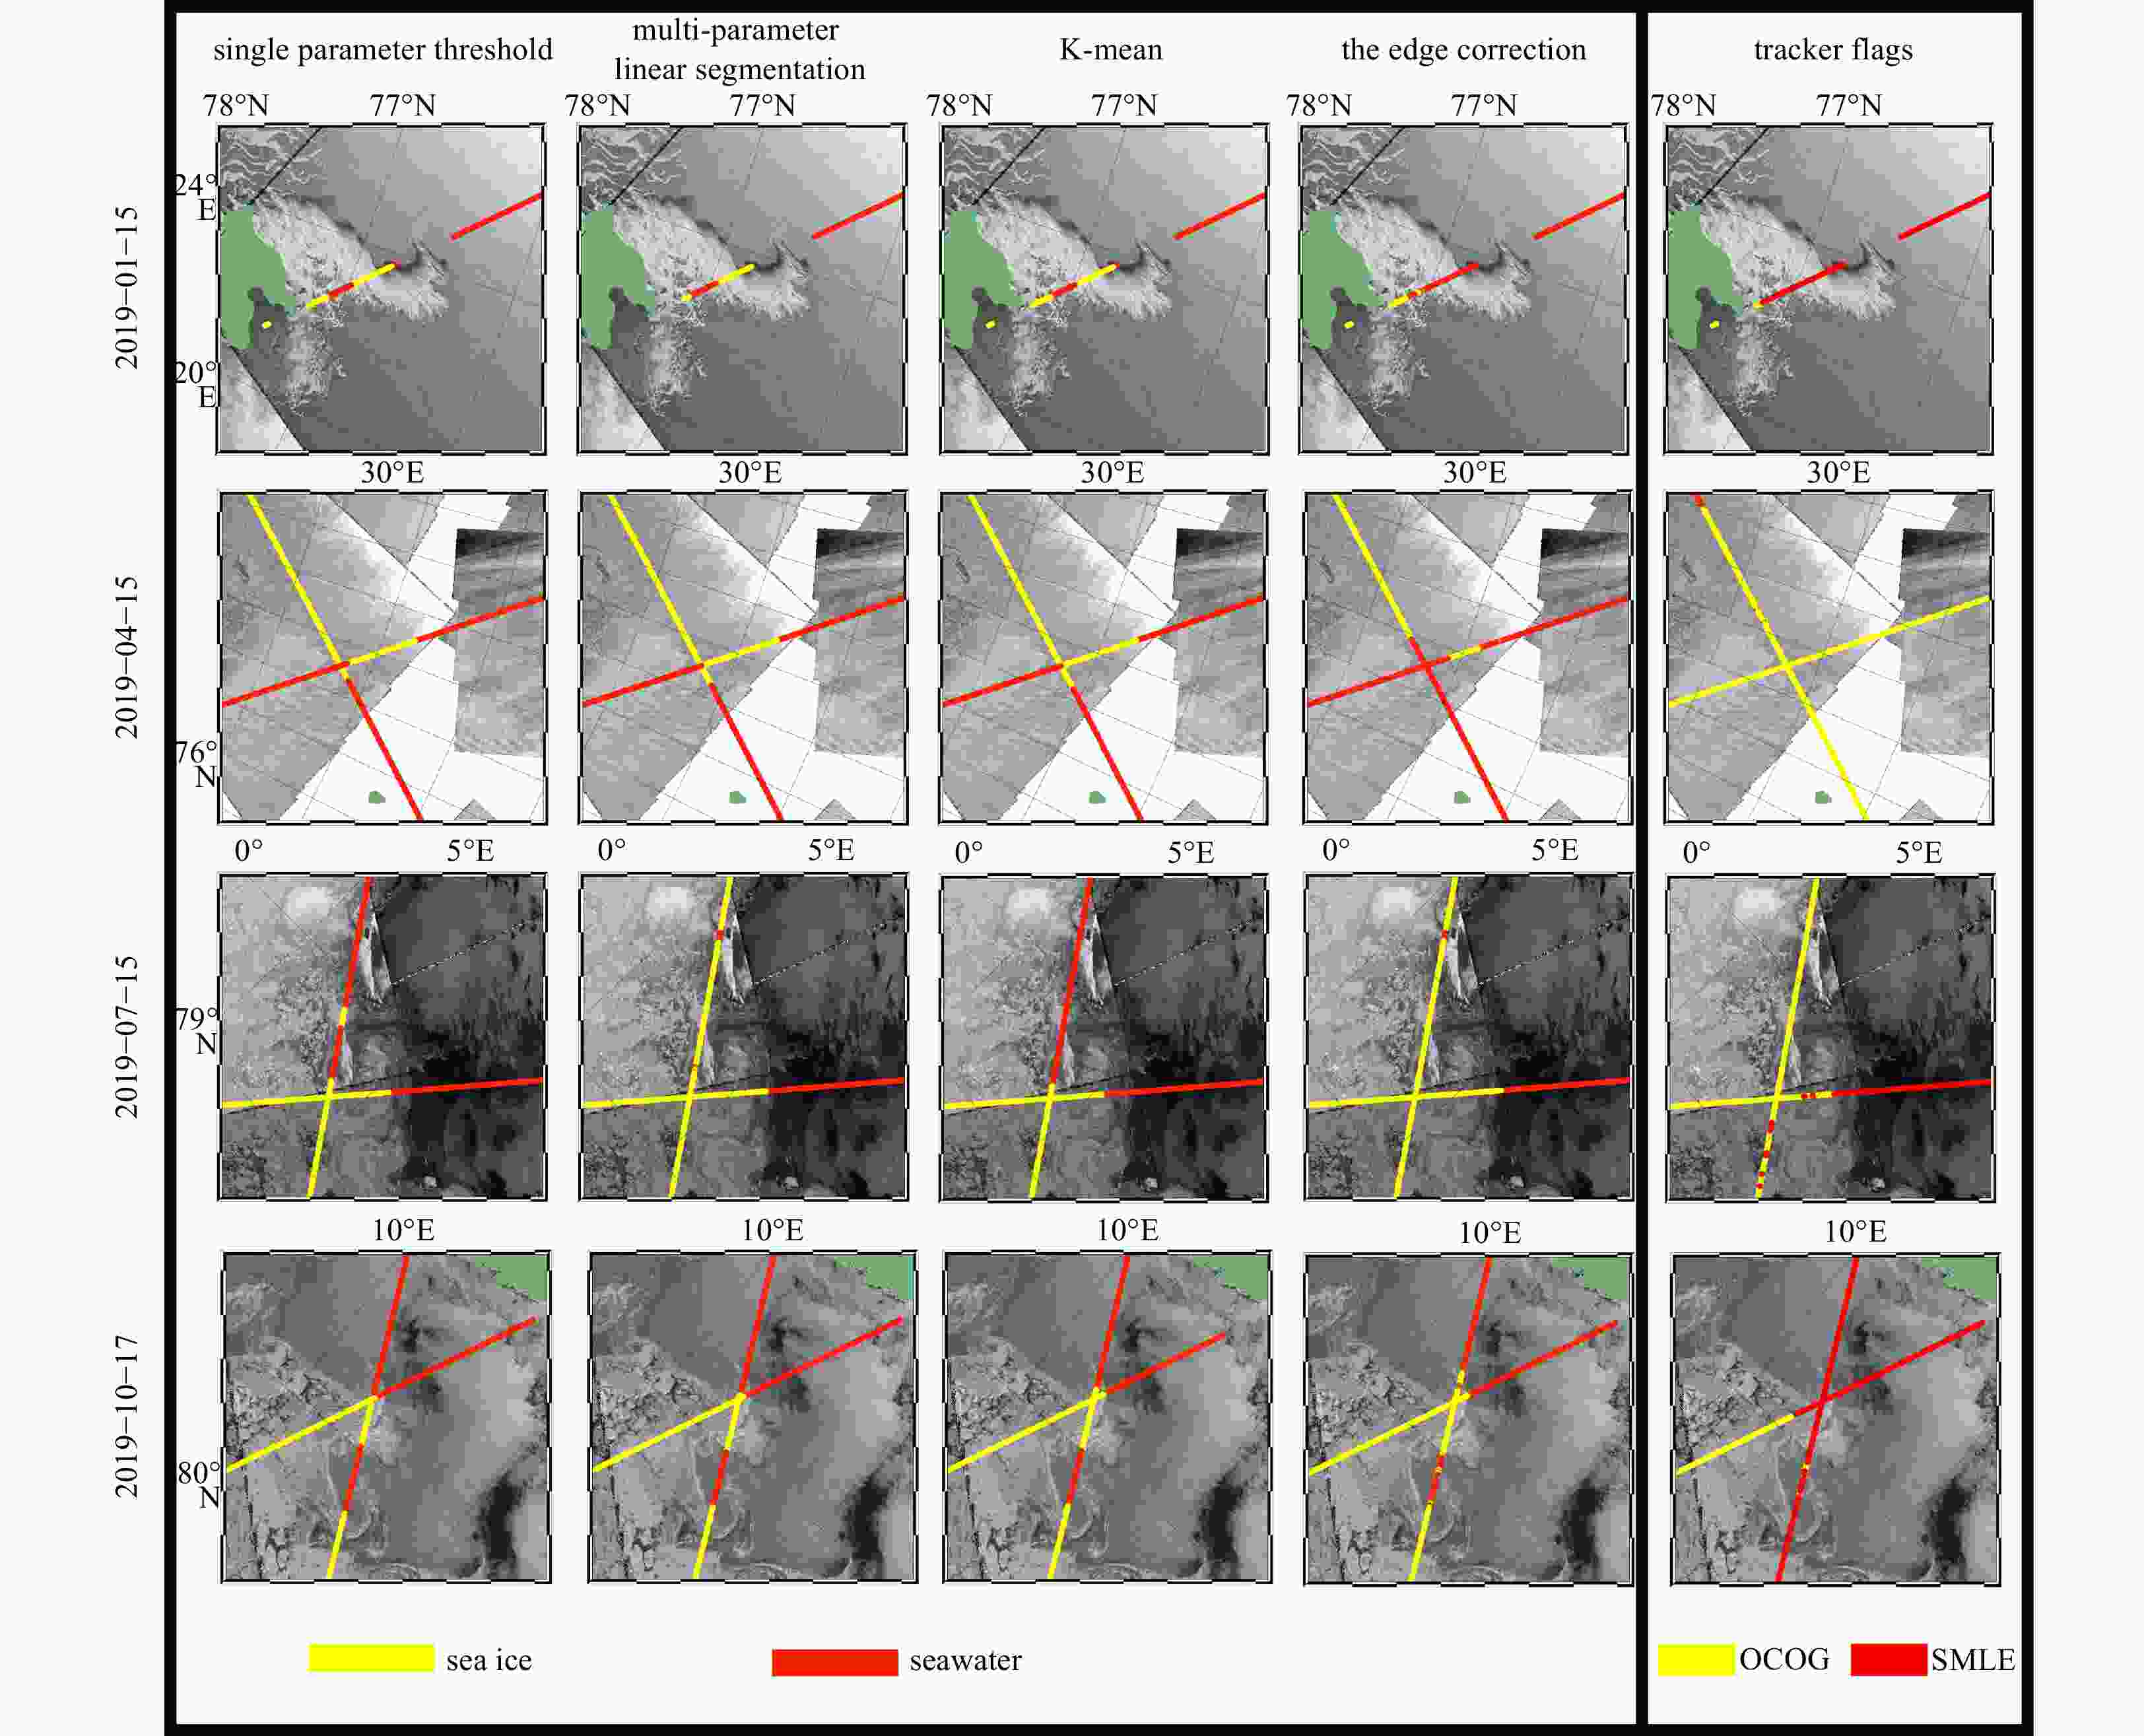
Figure 15. Comparison of the results of the different classification methods in the four different seasons.
Table 1. The average correct rates of the four different K-means classification
Sea ice Seawater K-means 96.89% 98.15% K-means (remove 18) 96.30% 97.71% K-means (remove 23) 97.00% 98.16% K-means (remove 37) 96.96% 98.19%  下载: 导出CSV
-
Aaboe S, Breivik L A, Eastwood S. 2021. Algorithm theoretical basis document for the global sea-ice edge and type product. OSI-403-C & EUMETSAT, 250: 1–34 Aagaard K, Carmack E C. 1994. The arctic ocean and climate: a perspective. In: Johannessen O M, Muench R D, Overland J E, eds. The Polar Oceans and Their Role in Shaping the Global Environment. Washington: American Geophysical Union, 5–20 Batoula S. 2011. ENVISAT ALTIMETRY Level 2 user manual V 1.4. Paris: European Space Agency Bernard R, Le Cornec A, Eymard L, et al. 1993. The microwave radiometer aboard ERS-1.1. Characteristics and performances. IEEE Transactions on Geoscience and Remote Sensing, 31(6): 1186–1198. doi: 10.1109/36.317444 Bronner E, Guillot A, Picot N. 2013. SARAL/AltiKa Products Handbook: SALP-MU-M-OP-15984-CN. Toulouse: Centre National d’Etudes Spatiales Cavalieri D J, Crawford J P, Drinkwater M R, et al. 1991. Aircraft active and passive microwave validation of sea ice concentration from the defense meteorological satellite program special sensor microwave imager. Journal of Geophysical Research: Oceans, 96(C12): 21989–22008. doi: 10.1029/91JC02335 Comiso J C. 1995. SSM/I sea ice concentrations using the bootstrap algorithm. Washington: National Aeronautics and Space Administration, 4–7 Eppler D T, Farmer L D, Lohanick A W, et al. 1992. Passive microwave signatures of sea ice. In: Carsey F D, ed. Microwave Remote Sensing of Sea Ice. Washington, DC: American Geophysical Union, 47–71 Fleming H E, Grody N C, Kratz E J. 1991. The forward problem and corrections for the SSM/T satellite microwave temperature sounder. IEEE Transactions on Geoscience and Remote Sensing, 29(4): 571–583. doi: 10.1109/36.135819 Forgy E W. 1965. Cluster analysis of multivariate data: efficiency versus interpretability of classifications. Biometrics, 21: 768–769 Fu L L, Christensen E J, Yamarone C A Jr, et al. 1994. TOPEX/POSEIDON mission overview. Oceanographic Literature Review, 99(C12): 24369–24381 Gill J P S, Yackel J J. 2012. Evaluation of C-band SAR polarimetric parameters for discrimination of first-year sea ice types. Canadian Journal of Remote Sensing, 38(3): 306–323. doi: 10.5589/m12-025 Gloersen P. 1992. Arctic and Antarctic Sea Ice, 1978–1987: Satellite Passive-Microwave Observations and Analysis. Washington: Scientific and Technical Information Program, National Aeronautics and Space Administration, 306 Jiang Xingwei, Lin Mingsen, Liu Jianqiang, et al. 2012. The HY-2 satellite and its preliminary assessment. International Journal of Digital Earth, 5(3): 266–281. doi: 10.1080/17538947.2012.658685 Jiang Chengfei, Lin Mingsen, Wei Hao. 2019. A study of the technology used to distinguish sea ice and seawater on the Haiyang-2A/B (HY-2A/B) altimeter data. Remote Sensing, 11(12): 1490. doi: 10.3390/rs11121490 Jiang Maofei, Xu Ke, Jia Yongjun, et al. 2015. Evaluation of HY-2B altimeter products over ocean. In: 2020 IEEE International Geoscience and Remote Sensing Symposium. Waikoloa, HI: IEEE, 5858–5861 Keihm S J, Janssen M A, Ruf C S. 1995. TOPEX/Poseidon microwave radiometer (TMR). III. Wet troposphere range correction algorithm and pre-launch error budget. IEEE Transactions on Geoscience and Remote Sensing, 33(1): 147–161. doi: 10.1109/36.368213 Kouraev A V, Crétaux J F, Lebedev S A, et al. 2011. Satellite altimetry applications in the Caspian Sea. In: Vignudelli S, Kostianoy A, Cipollini P, et al., eds. Coastal Altimetry. Berlin: Springer, 331–366 Kouraev A V, Papa F, Mognard N M, et al. 2004a. Sea ice cover in the Caspian and Aral Seas from historical and satellite data. Journal of Marine Systems, 47(1–4): 89–100 Kouraev A V, Papa F, Mognard N M, et al. 2004b. Synergy of active and passive satellite microwave data for the study of first-year sea ice in the Caspian and Aral seas. IEEE Transactions on Geoscience and Remote Sensing, 42(10): 2170–2176. doi: 10.1109/TGRS.2004.835307 Kouraev A V, Shimaraev M N, Buharizin P I, et al. 2008. Ice and snow cover of continental water bodies from simultaneous radar altimetry and radiometry observations. Surveys in Geophysics, 29(4): 271–295 Kouraev A V, Semovski S V, Shimaraev M N, et al. 2007. Observations of Lake Baikal ice from satellite altimetry and radiometry. Remote Sensing of Environment, 108(3): 240–253. doi: 10.1016/j.rse.2006.11.010 Laxon S. 1994. Sea ice altimeter processing scheme at the EODC. International Journal of Remote Sensing, 15(4): 915–924. doi: 10.1080/01431169408954124 Lomax A S, Lubin D, Whritner R H. 1995. The potential for interpreting total and multiyear ice concentrations in SSM/I 85.5 GHz imagery. Remote Sensing of Environment, 54(1): 13–26. doi: 10.1016/0034-4257(95)00082-C Louet J, Bruzzi S. 1999. ENVISAT mission and system. In: IEEE 1999 International Geoscience and Remote Sensing Symposium. Hamburg: IEEE, 1680–1682 Markus T, Cavalieri D J. 2000. An enhancement of the NASA Team sea ice algorithm. IEEE Transactions on Geoscience and Remote Sensing, 38(3): 1387–1398. doi: 10.1109/36.843033 Obligis E, Eymard L, Tran N, et al. 2006. First three years of the microwave radiometer aboard Envisat: in-flight calibration, processing, and validation of the geophysical products. Journal of Atmospheric and Oceanic Technology, 23(6): 802–814. doi: 10.1175/JTECH1878.1 Ochilov S, Clausi D A. 2012. Operational SAR sea-ice image classification. IEEE Transactions on Geoscience and Remote Sensing, 50(11): 4397–4408. doi: 10.1109/TGRS.2012.2192278 Pol S L C, Ruf C S, Keihm S J. 1998. Improved 20- to 32-GHz atmospheric absorption model. Radio Science, 33(5): 1319–1333. doi: 10.1029/98RS01941 Przybylak R. 2007. Recent air-temperature changes in the Arctic. Annals of Glaciology, 46: 316–324. doi: 10.3189/172756407782871666 Remund Q P, Long D G. 1999. Sea ice extent mapping using Ku band scatterometer data. Journal of Geophysical Research: Oceans, 104(C5): 11515–11527. doi: 10.1029/98JC02373 Remund Q P, Long D G, Drinkwater M R. 2000. An iterative approach to multisensor sea ice classification. IEEE Transactions on Geoscience and Remote Sensing, 38(4): 1843–1856. doi: 10.1109/36.851768 Scheuchl B, Caves R, Cumming I, et al. 2001. Automated sea ice classification using spaceborne polarimetric SAR data. In: IEEE 2001 International Geoscience and Remote Sensing Symposium. Sydney: IEEE, 3117–3119 Screen J A, Simmonds I. 2010. The central role of diminishing sea ice in recent Arctic temperature amplification. Nature, 464(7293): 1334–1337. doi: 10.1038/nature09051 Shokr M, Sinha N K. 2015. Sea Ice: Physics and Remote Sensing. Washington, DC: American Geophysical Union, 615 Swan A M, Long D G. 2012. Multiyear Arctic sea ice classification using QuikSCAT. IEEE Transactions on Geoscience and Remote Sensing, 50(9): 3317–3326. doi: 10.1109/TGRS.2012.2184123 Tandon N F, Kushner P J, Docquier D, et al. 2018. Reassessing sea ice drift and its relationship to long-term Arctic sea ice loss in coupled climate models. Journal of Geophysical Research: Oceans, 123(6): 4338–4359. doi: 10.1029/2017JC013697 Woodhouse I H. 2017. Introduction to Microwave Remote Sensing. Boca Raton: CRC Press, 400 Xu Ke, Jiang Jingshan, Liu Heguang. 2007. A new tracker for ocean-land compatible radar altimeter. In: 2007 IEEE International Geoscience and Remote Sensing Symposium. Barcelona: IEEE, 3825–3828 Xu Ke, Jiang Jingshan, Liu Heguang. 2013. HY-2A radar altimeter design and in flight preliminary results. In: 2013 IEEE International Geoscience and Remote Sensing Symposium. Melbourne: IEEE, 1680–1683 Xu Ke, Liu Heguang, Liu Peng, et al. 2014. System techniques and capabilities of the HY-2A altimeter. In: 2014 IEEE Geoscience and Remote Sensing Symposium. Quebec City, QC: IEEE, 5171–5174 Xu Ke, Liu Peng, Tang Yueying, et al. 2017. The improved design for HY-2B radar altimeter. In: 2017 IEEE International Geoscience and Remote Sensing Symposium. Fort Worth, TX: IEEE, 534–537 Zhang Dehai, Wang Zhenzhan, Li Yun, et al. 2015. Preliminary analysis of HY-2 ACMR data. In: 2015 IEEE International Geoscience and Remote Sensing Symposium. Milan: IEEE, 177–180 Zhang Zhilun, Yu Yining, Li Xinqing, et al. 2019. Arctic sea ice classification using microwave scatterometer and radiometer data during 2002–2017. IEEE Transactions on Geoscience and Remote Sensing, 57(8): 5319–5328. doi: 10.1109/TGRS.2019.2898872 Zygmuntowska M, Khvorostovsky K, Helm V, et al. 2013. Waveform classification of airborne synthetic aperture radar altimeter over Arctic sea ice. The Cryosphere, 7(4): 1315–1324. doi: 10.5194/tc-7-1315-2013 -


 点击查看大图
计量
- 文章访问数: 377
- HTML全文浏览量: 110
- PDF下载量: 17
- 被引次数: 0

