

Characteristics and mechanisms of the intraseasonal variability of sea surface salinity in the southeastern Arabian Sea during 2015–2020
-
Abstract: Based on Soil Moisture Active Passive sea surface salinity (SSS) data from April 2015 to August 2020, combined with Objectively Analyzed Air-Sea Heat Flux and other observational data and Hybrid Coordinate Ocean Model (HYCOM) data, this work explores the characteristics and mechanisms of the intraseasonal variability of SSS in the southeastern Arabian Sea (SEAS). The results show that the intraseasonal variability of SSS in the SEAS is very significant, especially the strongest intraseasonal signal in SSS, which is located along the northeast monsoon current (NMC) path south of the Indian Peninsula. There are remarkable seasonal differences in intraseasonal SSS variability, which is very weak in spring and summer and much stronger in autumn and winter. This strong intraseasonal variability in autumn and winter is closely related to the Madden-Julian Oscillation (MJO) event during this period. The northeast wind anomaly in the Bay of Bengal (BOB) associated with the active MJO phase strengthens the East India Coastal Current and NMC and consequently induces more BOB low-salinity water to enter the SEAS, causing strong SSS fluctuations. In addition, MJO-related precipitation further amplifies the intraseasonal variability of SSS in SEAS. Based on budget analysis of the mixed layer salinity using HYCOM data, it is shown that horizontal salinity advection (especially zonal advection) dominates the intraseasonal variability of mixed layer salinity and that surface freshwater flux has a secondary role.
-
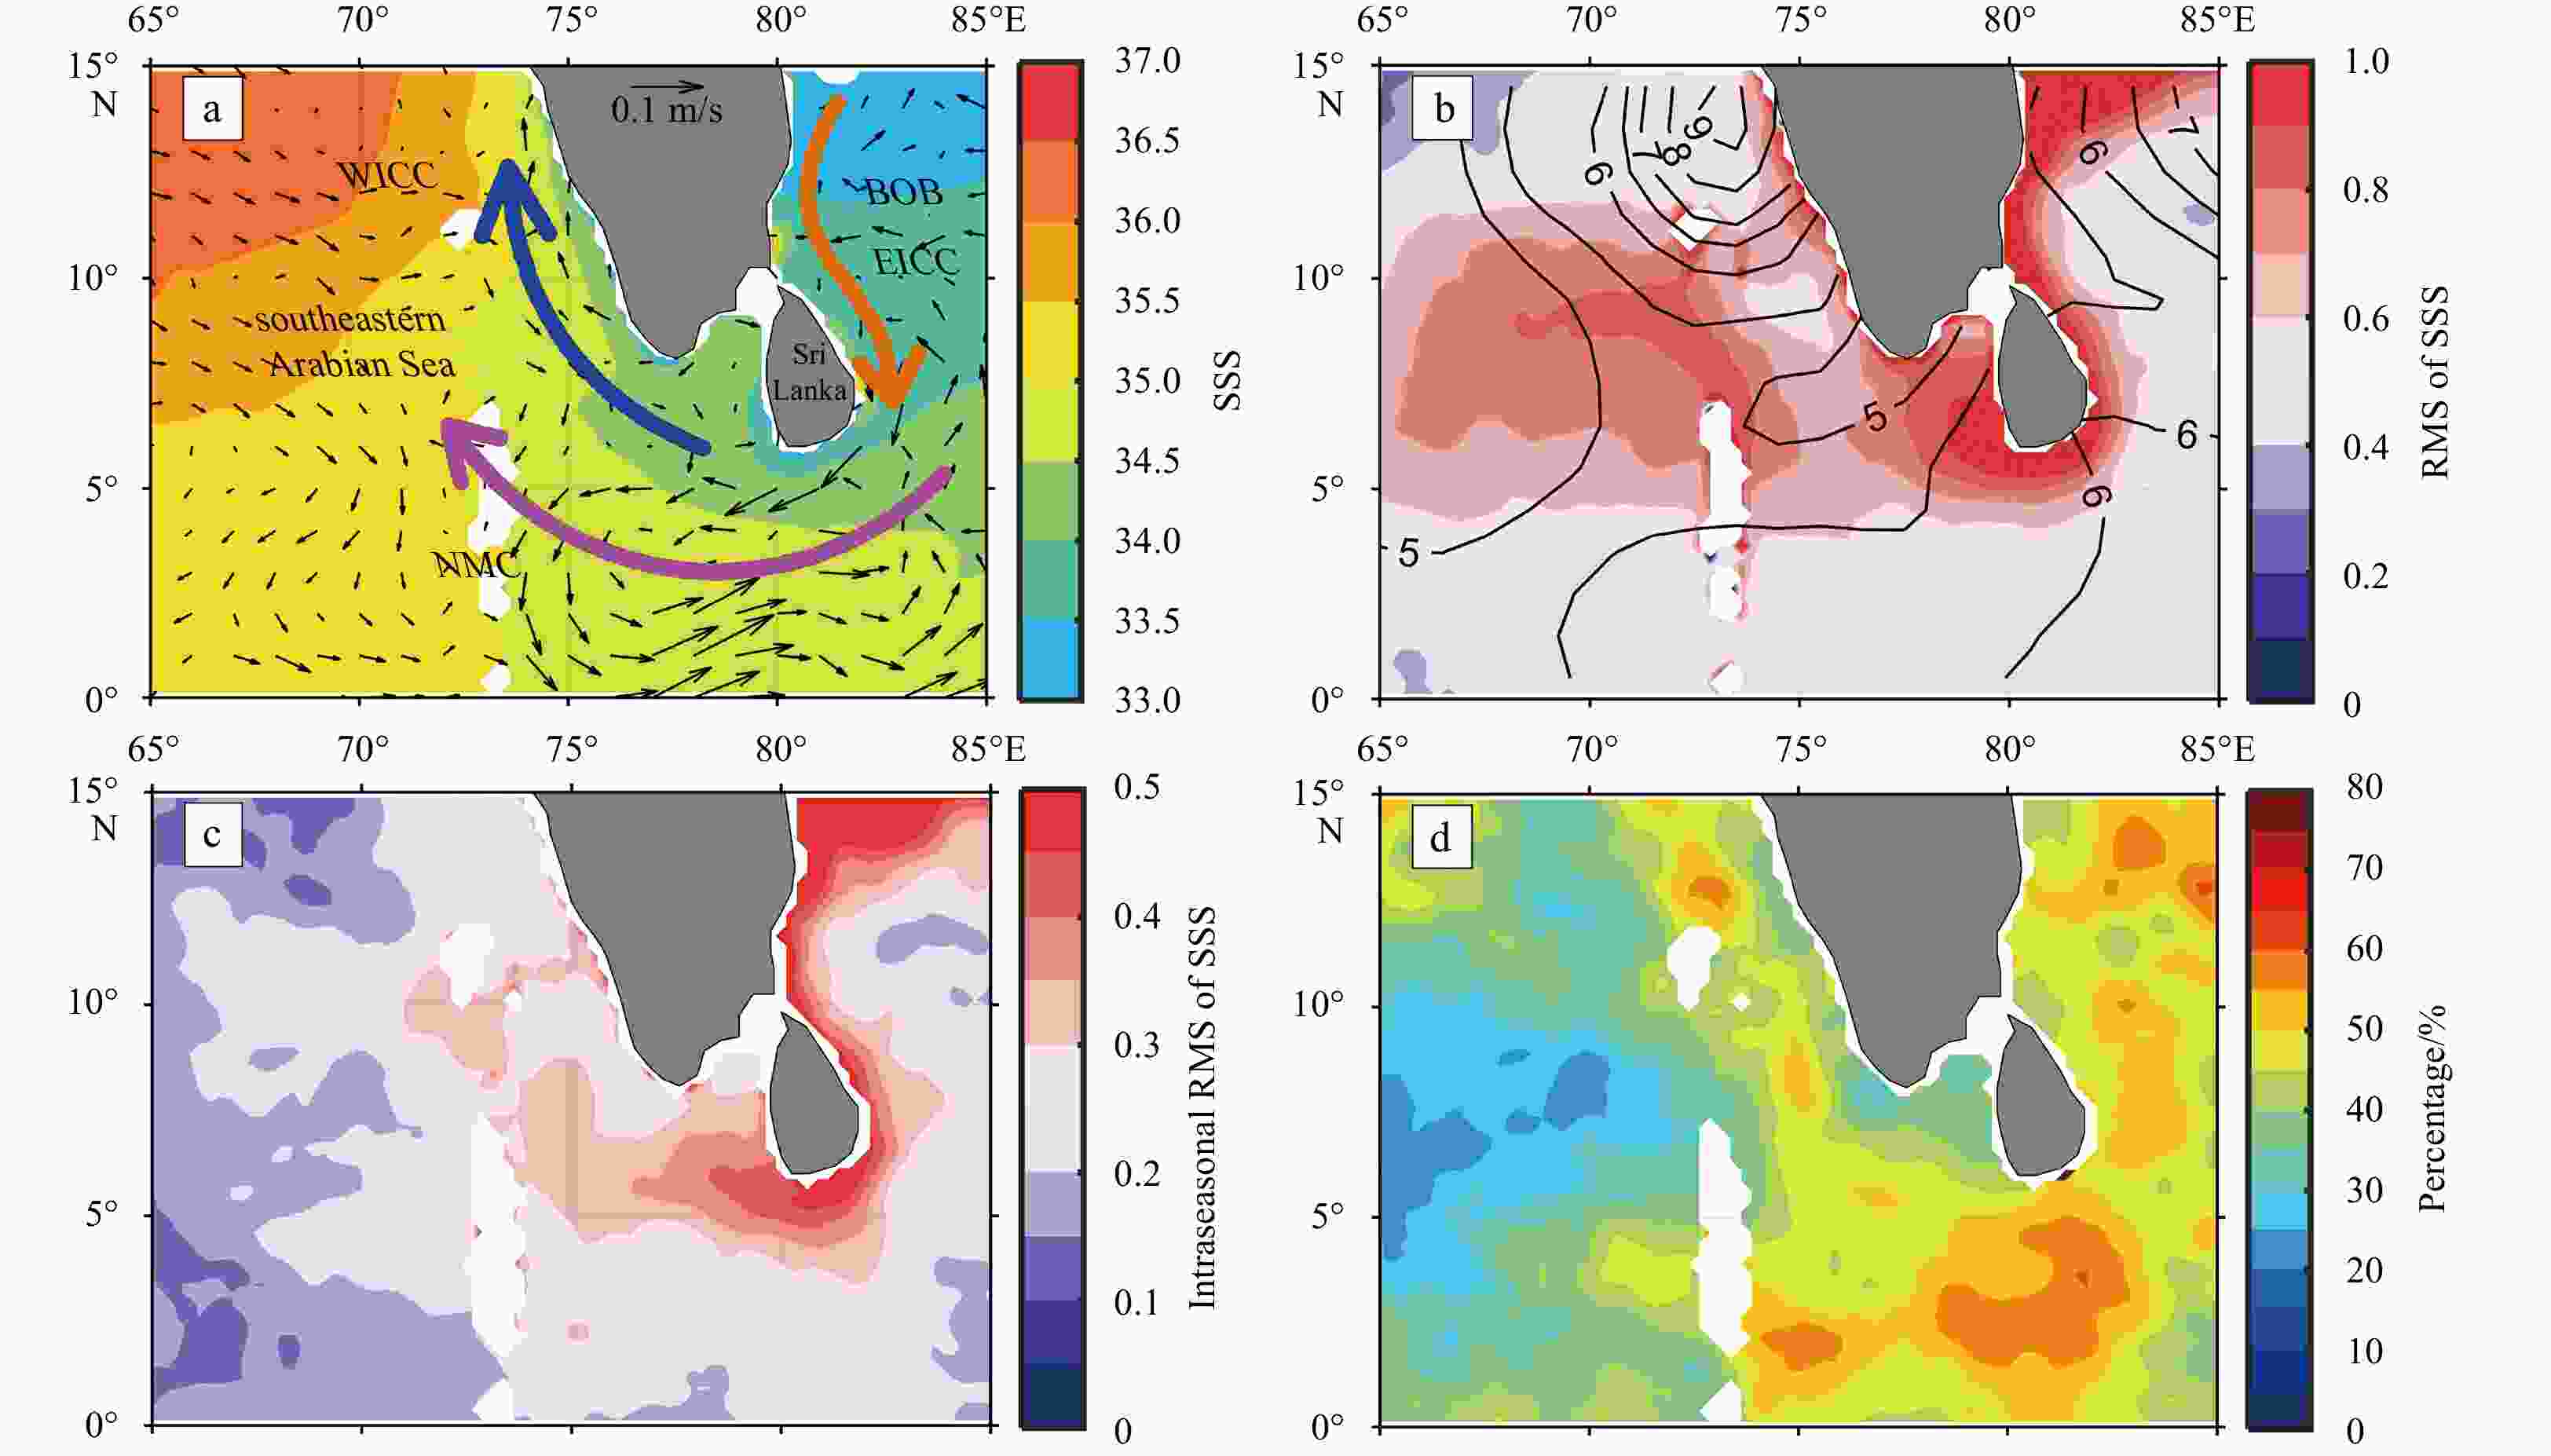
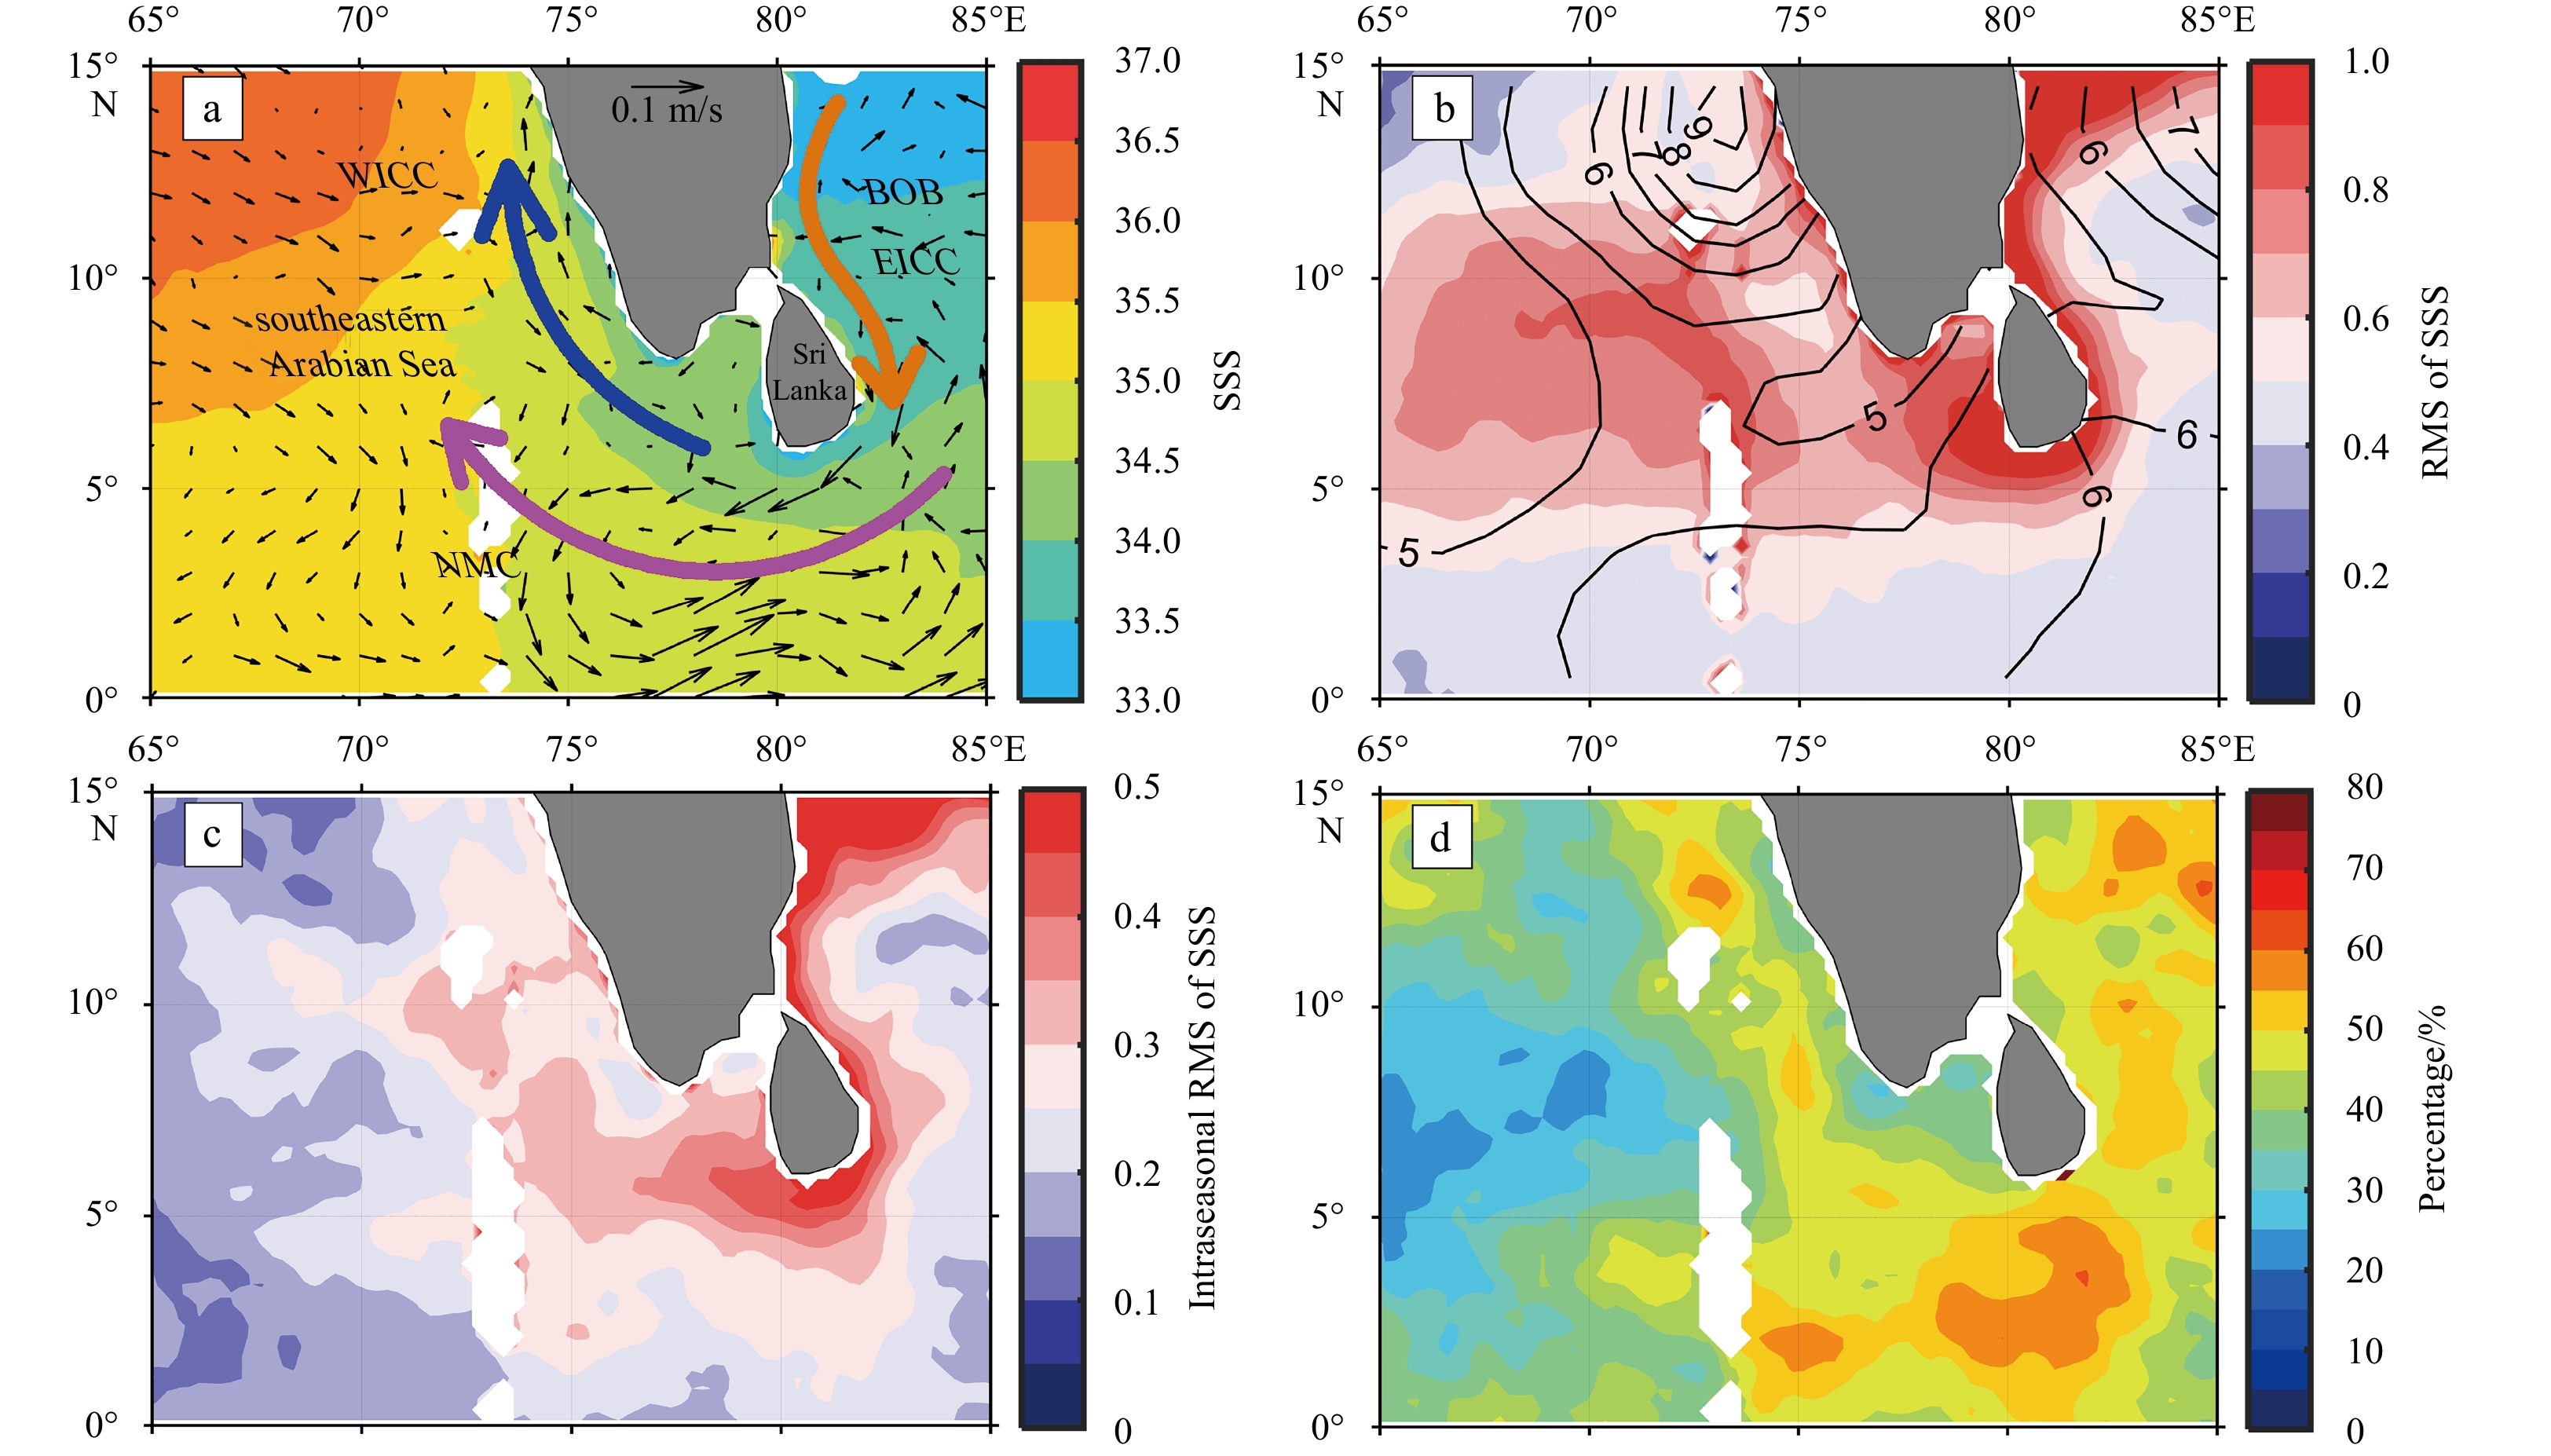
Figure 1. Annual mean Soil Moisture Active Passive (SMAP) sea surface salinity (SSS) and Ocean Surface Current Analysis Real-time surface currents (arrows; unit: m/s) (a), root mean square (RMS) of SMAP SSS and RMS of evaporation minus precipitation (E−P, contours; unit: mm/d) (b), intraseasonal RMS of SMAP SSS (c), and percentage of intraseasonal RMS to total RMS for SSS (d). The purple line represents the pathway of the northeast monsoon current (NMC) around Sri Lanka, and the orange line represents the pathway of the East India Coastal Current (EICC), and the blue line represents the pathway of the West India Coastal Current (WICC). BOB: Bay of Bengal.
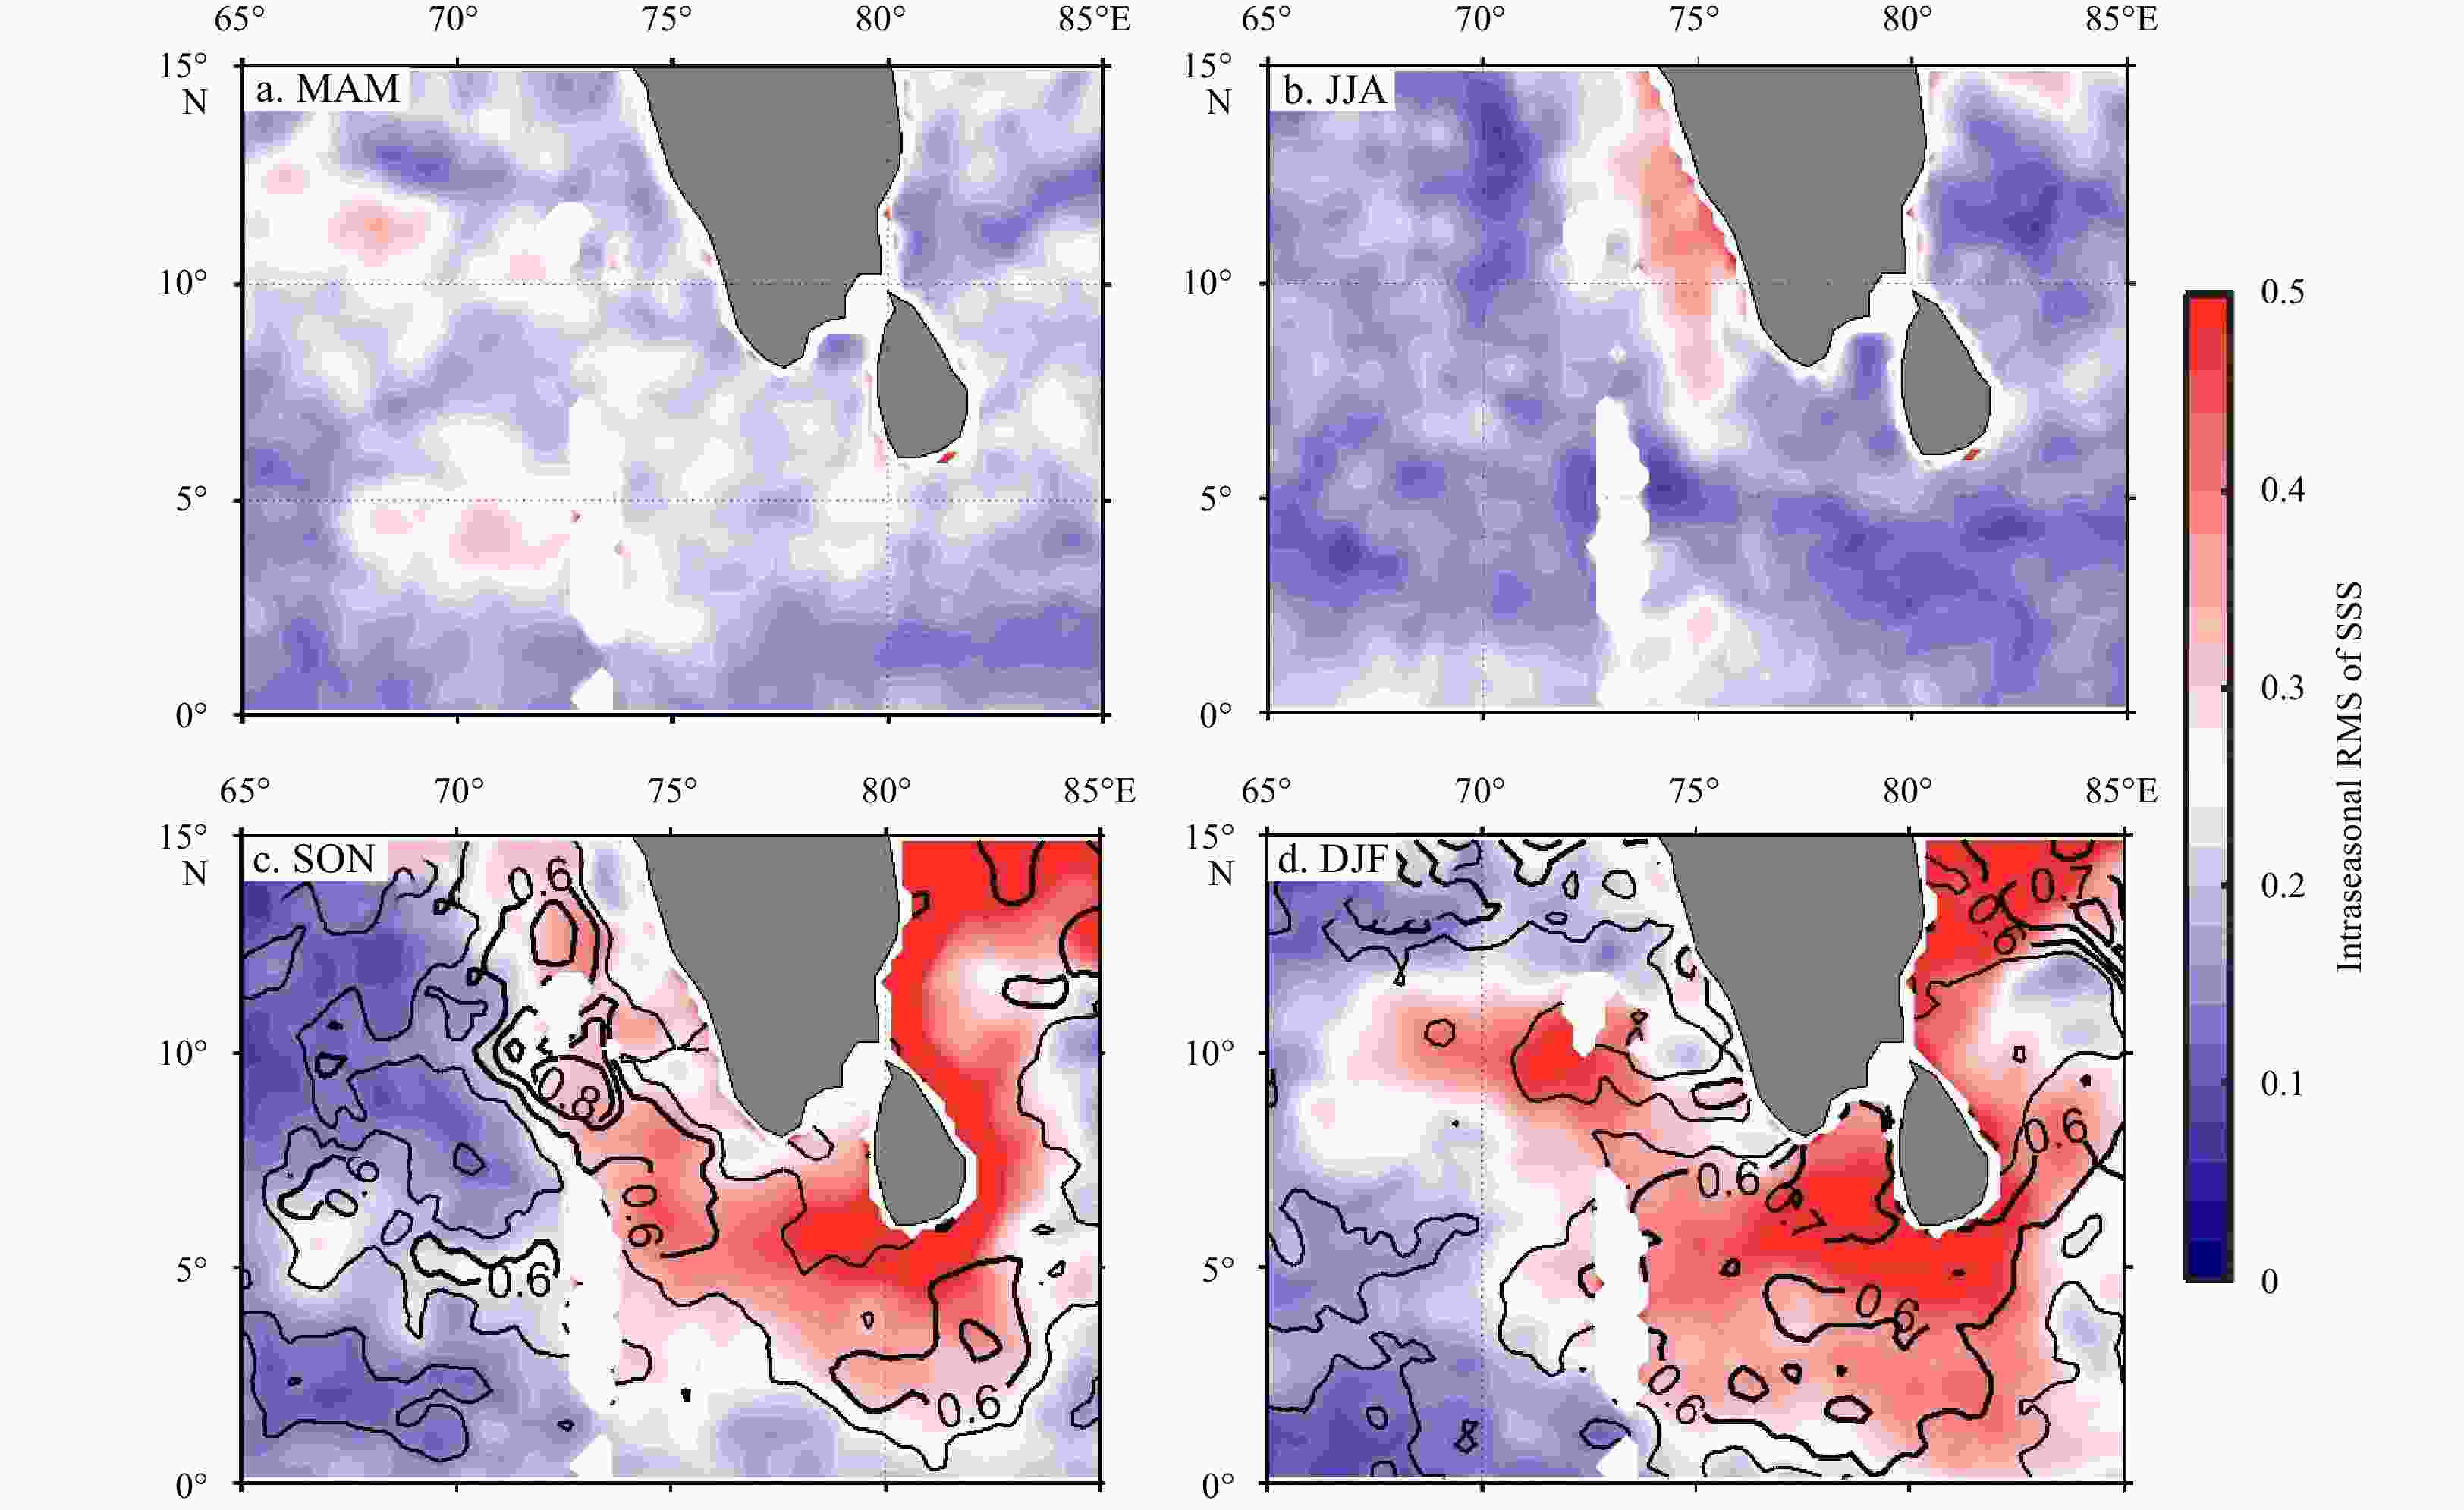
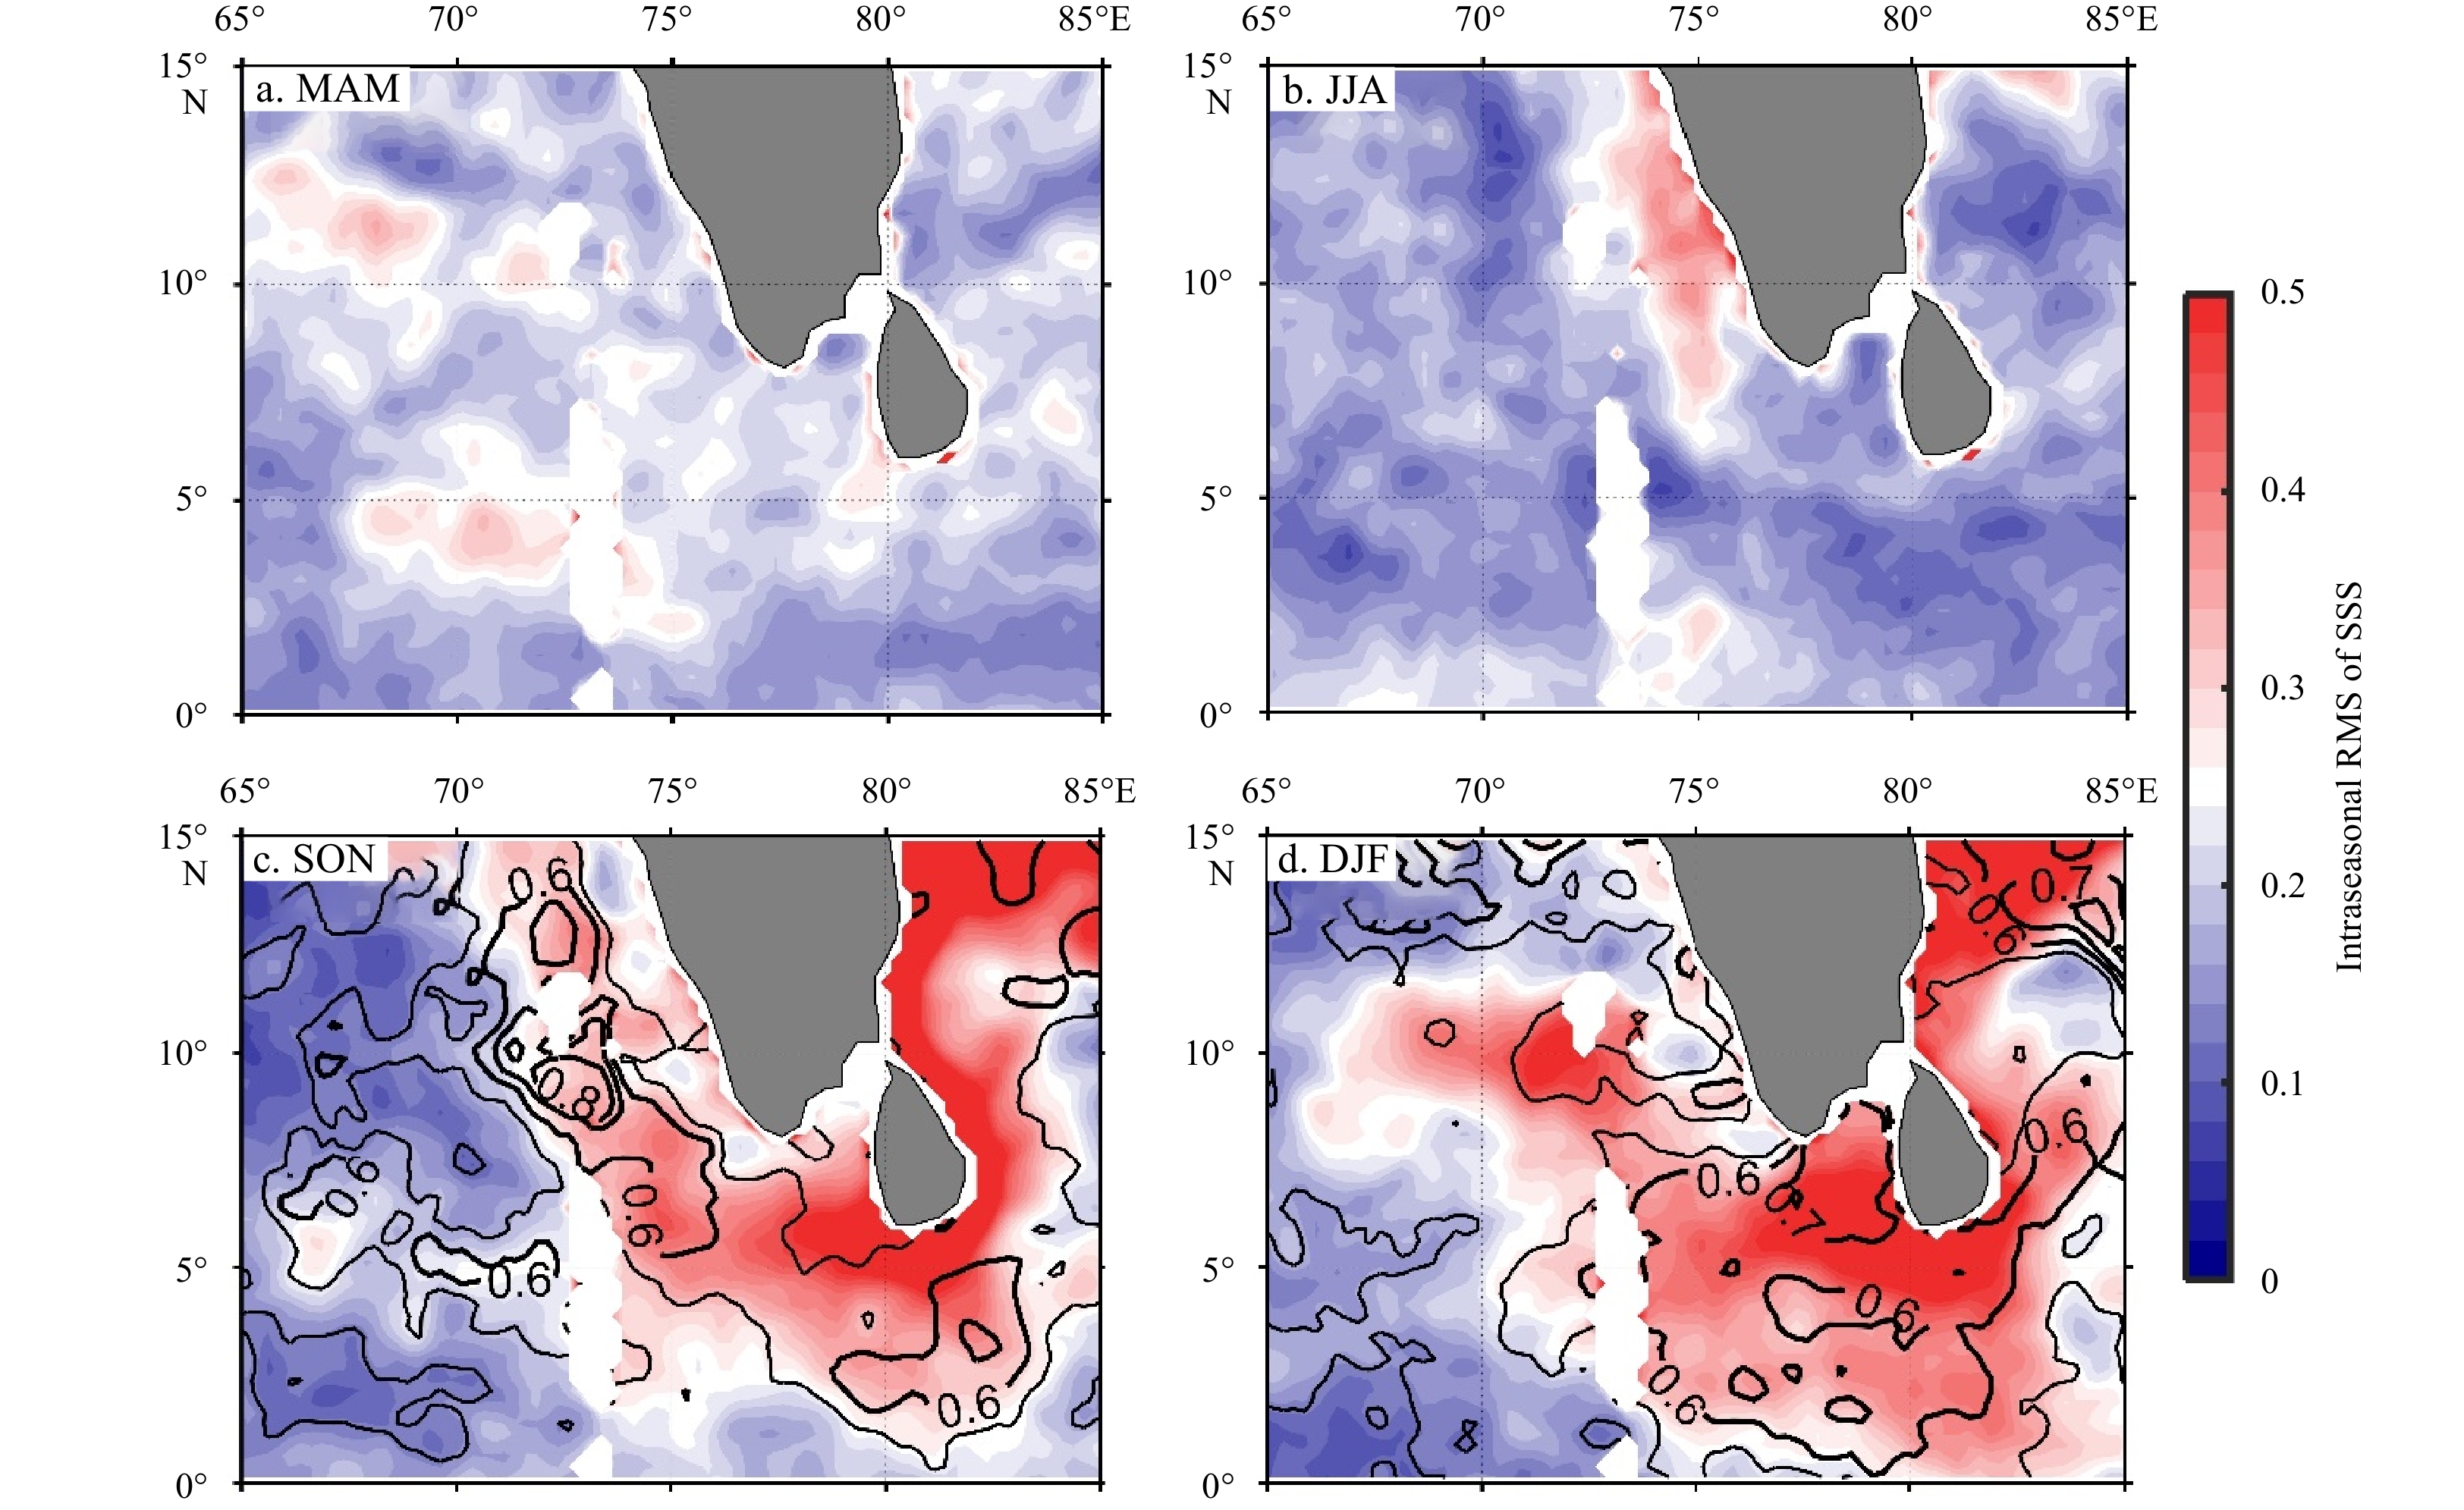
Figure 2. Seasonal distribution for the intraseasonal root mean square (RMS) of SMAP sea surface salinity (SSS): spring (March–May, MAM) (a), summer (June–August, JJA) (b), autumn (September–November, SON) (c), and winter (December–February, DJF) (d). The contours in c and d represent the ratio of intraseasonal RMS to total RMS for SSS.

Figure 3. Seasonal distribution of the intraseasonal root mean square (RMS) of OSCAR zonal currents and of E−P (contours; unit: mm/d): spring (a), summer (b), autumn (c), and winter (d). The areas bounded by thick green curves represent the regions with an intraseasonal SSS RMS larger than 0.35. Region A (4°–6°N, 75°–80°E) bounded by purple lines in d represents a region with strong intraseasonal variability in the southeastern Arabian Sea.
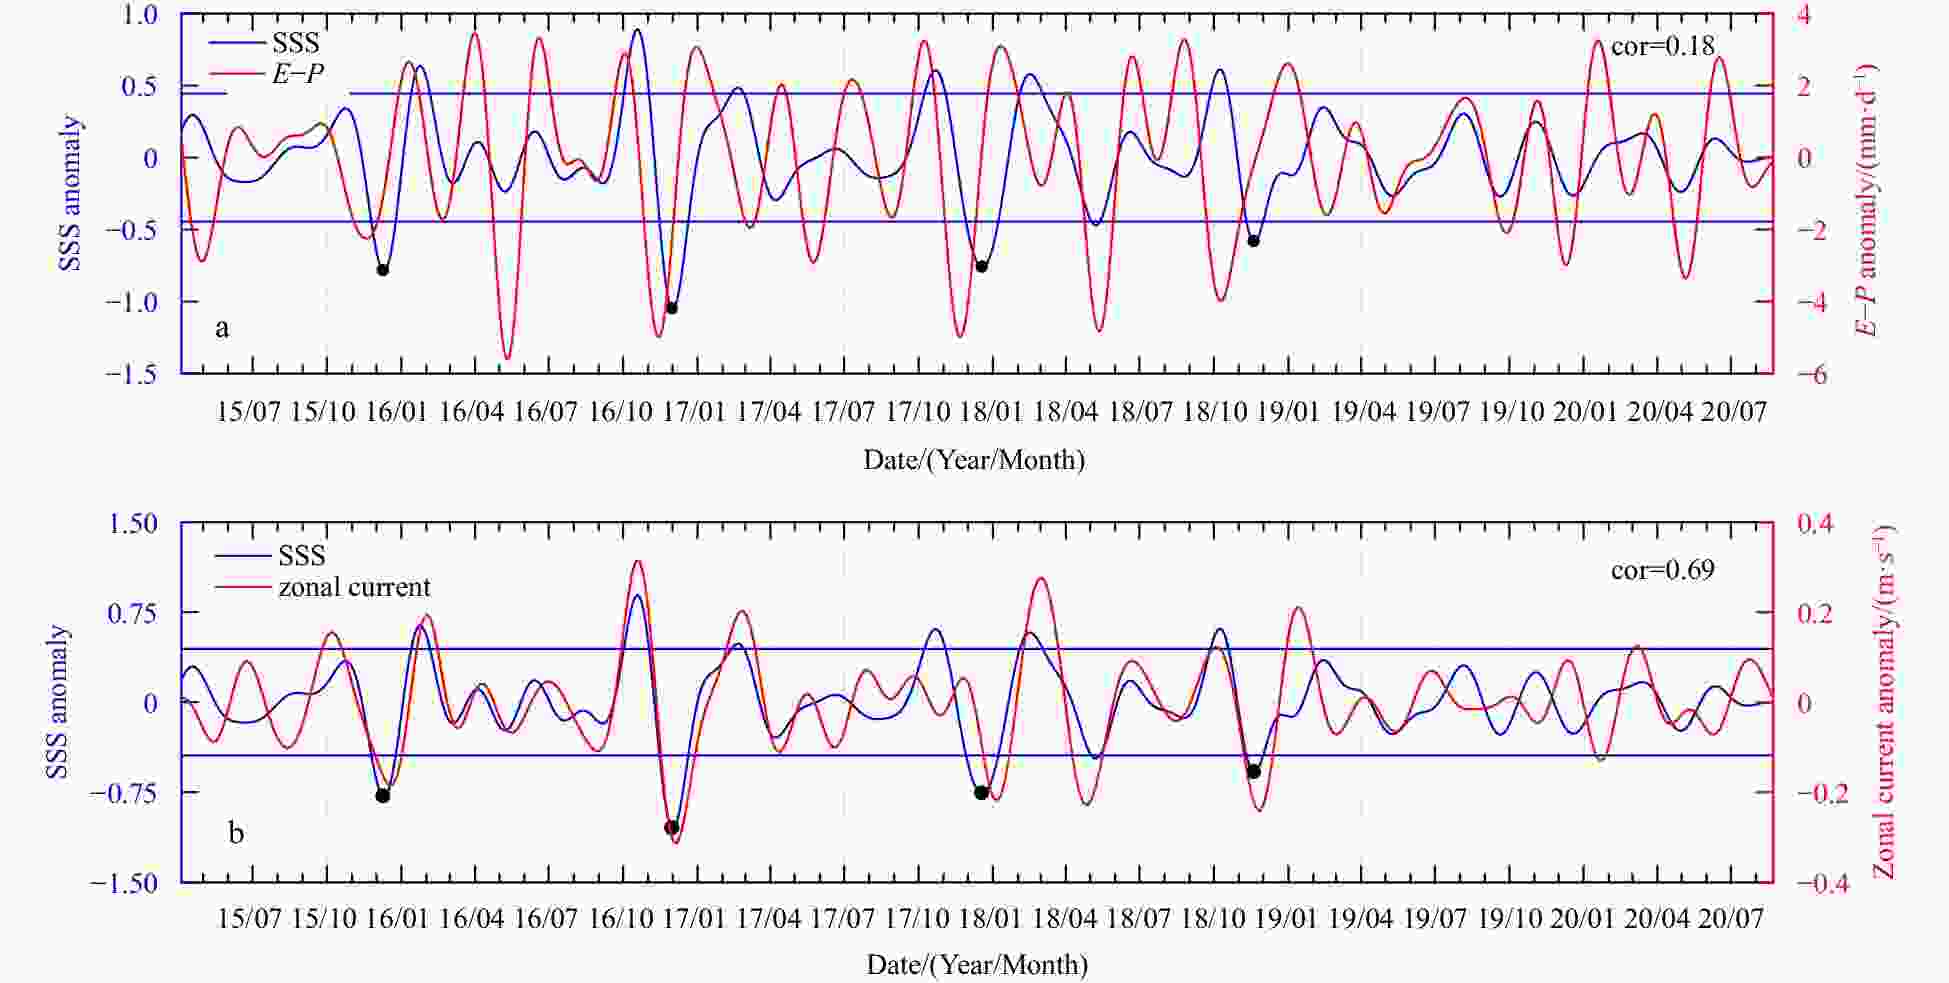
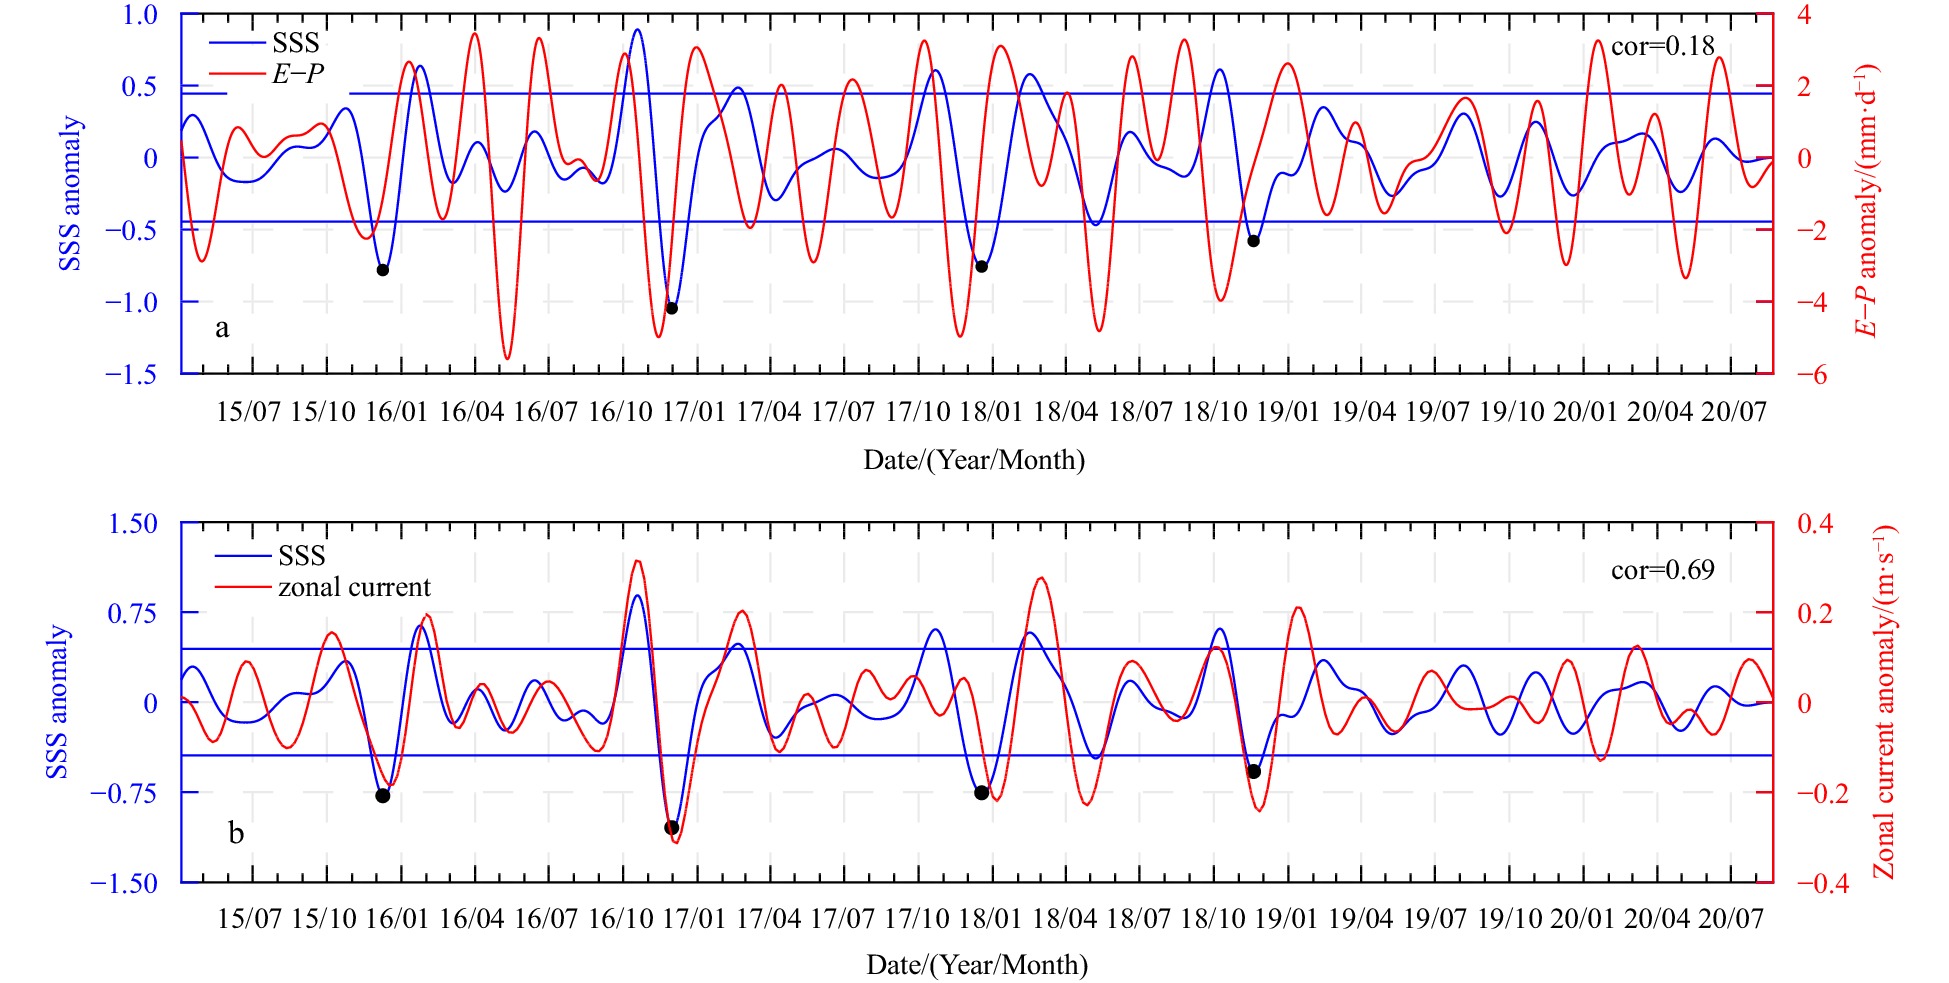
Figure 4. Time series averaged in region A (shown in Fig. 3d) for: sea surface salinity (SSS) anomaly (blue curves) and E−P anomaly (red curves) (a), SSS anomaly and zonal current anomaly (b). The blue line is 1.5 times the standard deviation of the SSS anomaly. The dark points represent the lowest anomalous salinity for the strong intraseasonal SSS events. cor: correlation coefficient.
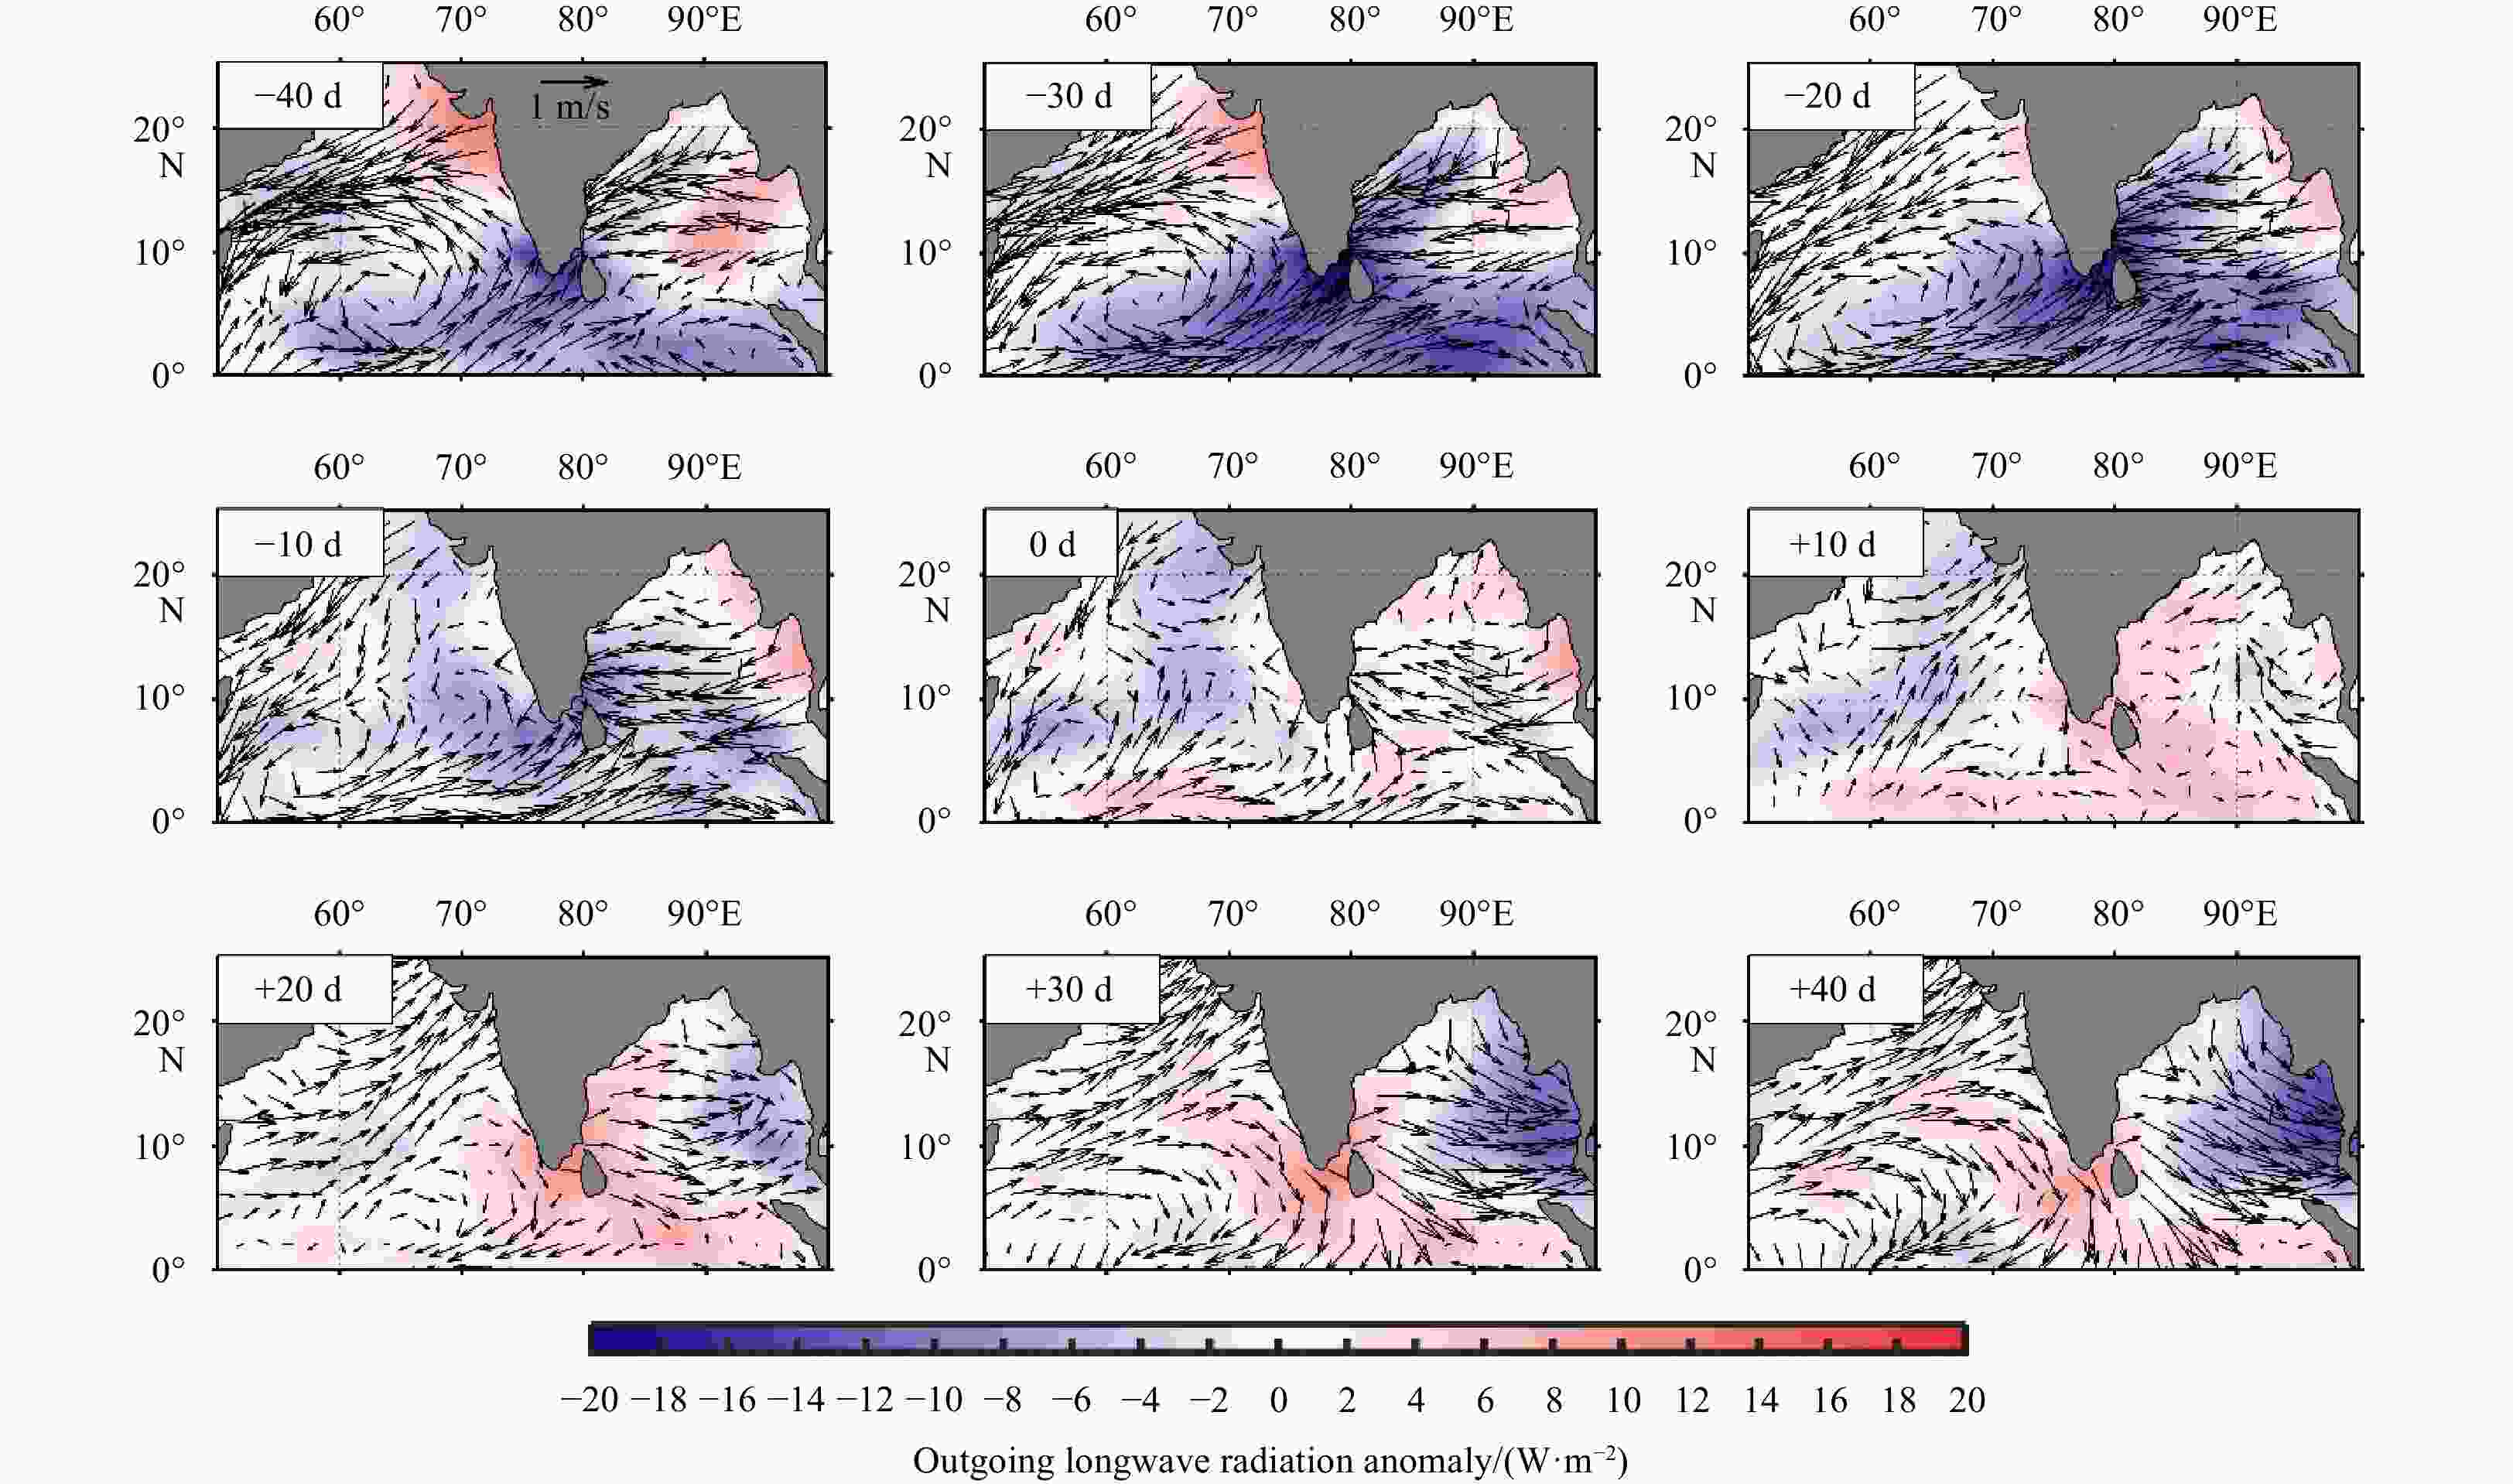
Figure 5. Composite surface wind anomaly (arrows, unit: m/s) and outgoing longwave radiation anomaly from −40 d to +40 d with 10-d intervals for the four strong intraseasonal events listed in Fig. 4. The date with the minimum salinity of each event is selected as the reference time (0 d).
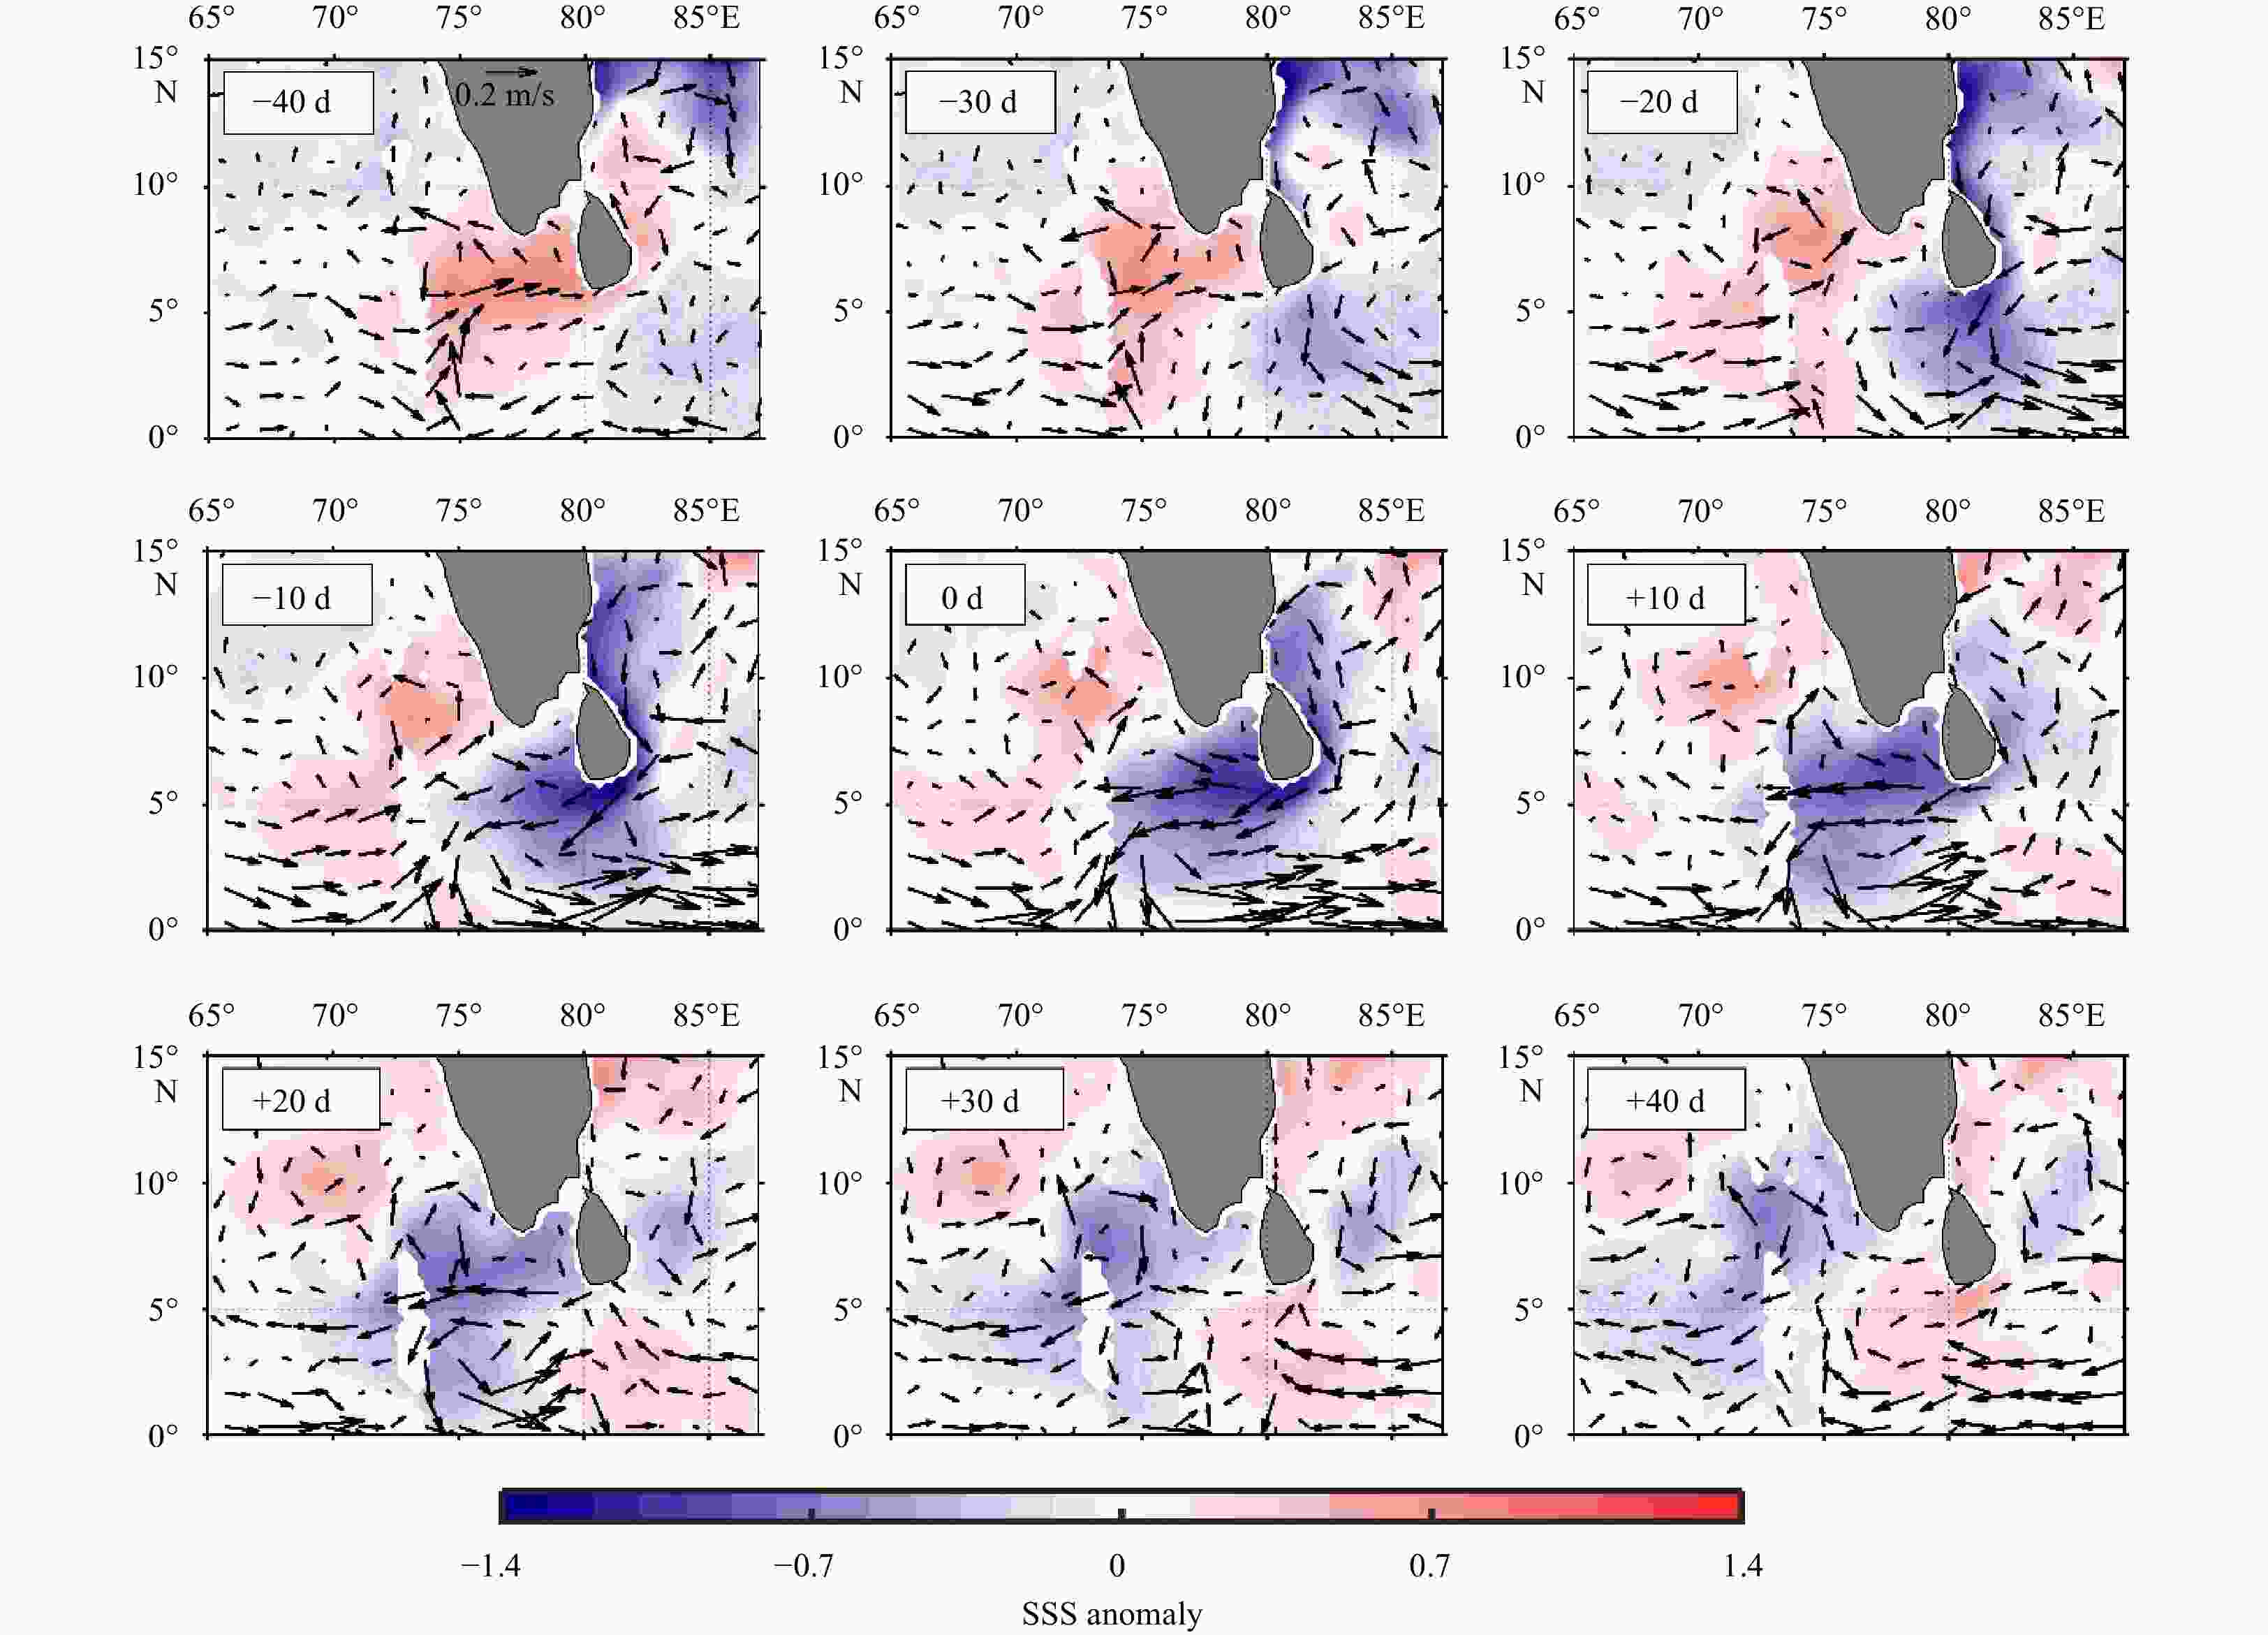
Figure 6. Composite sea surface salinity (SSS) anomalies and surface current anomalies (arrows, unit: m/s) from −40 d to +40 d with 10-d intervals for the four strong intraseasonal events listed in Fig. 4. The date with the minimum salinity of each event is selected as the reference time (0 d).

Figure 7. Composite E−P anomalies (contours, unit: mm/d) from −40 d to +40 d with 10-d intervals for the four strong intraseasonal events listed in Fig. 4. The date with the minimum salinity of each event is selected as the reference time (0 d). Composite sea surface salinity (SSS) anomalies are also shown for comparison.
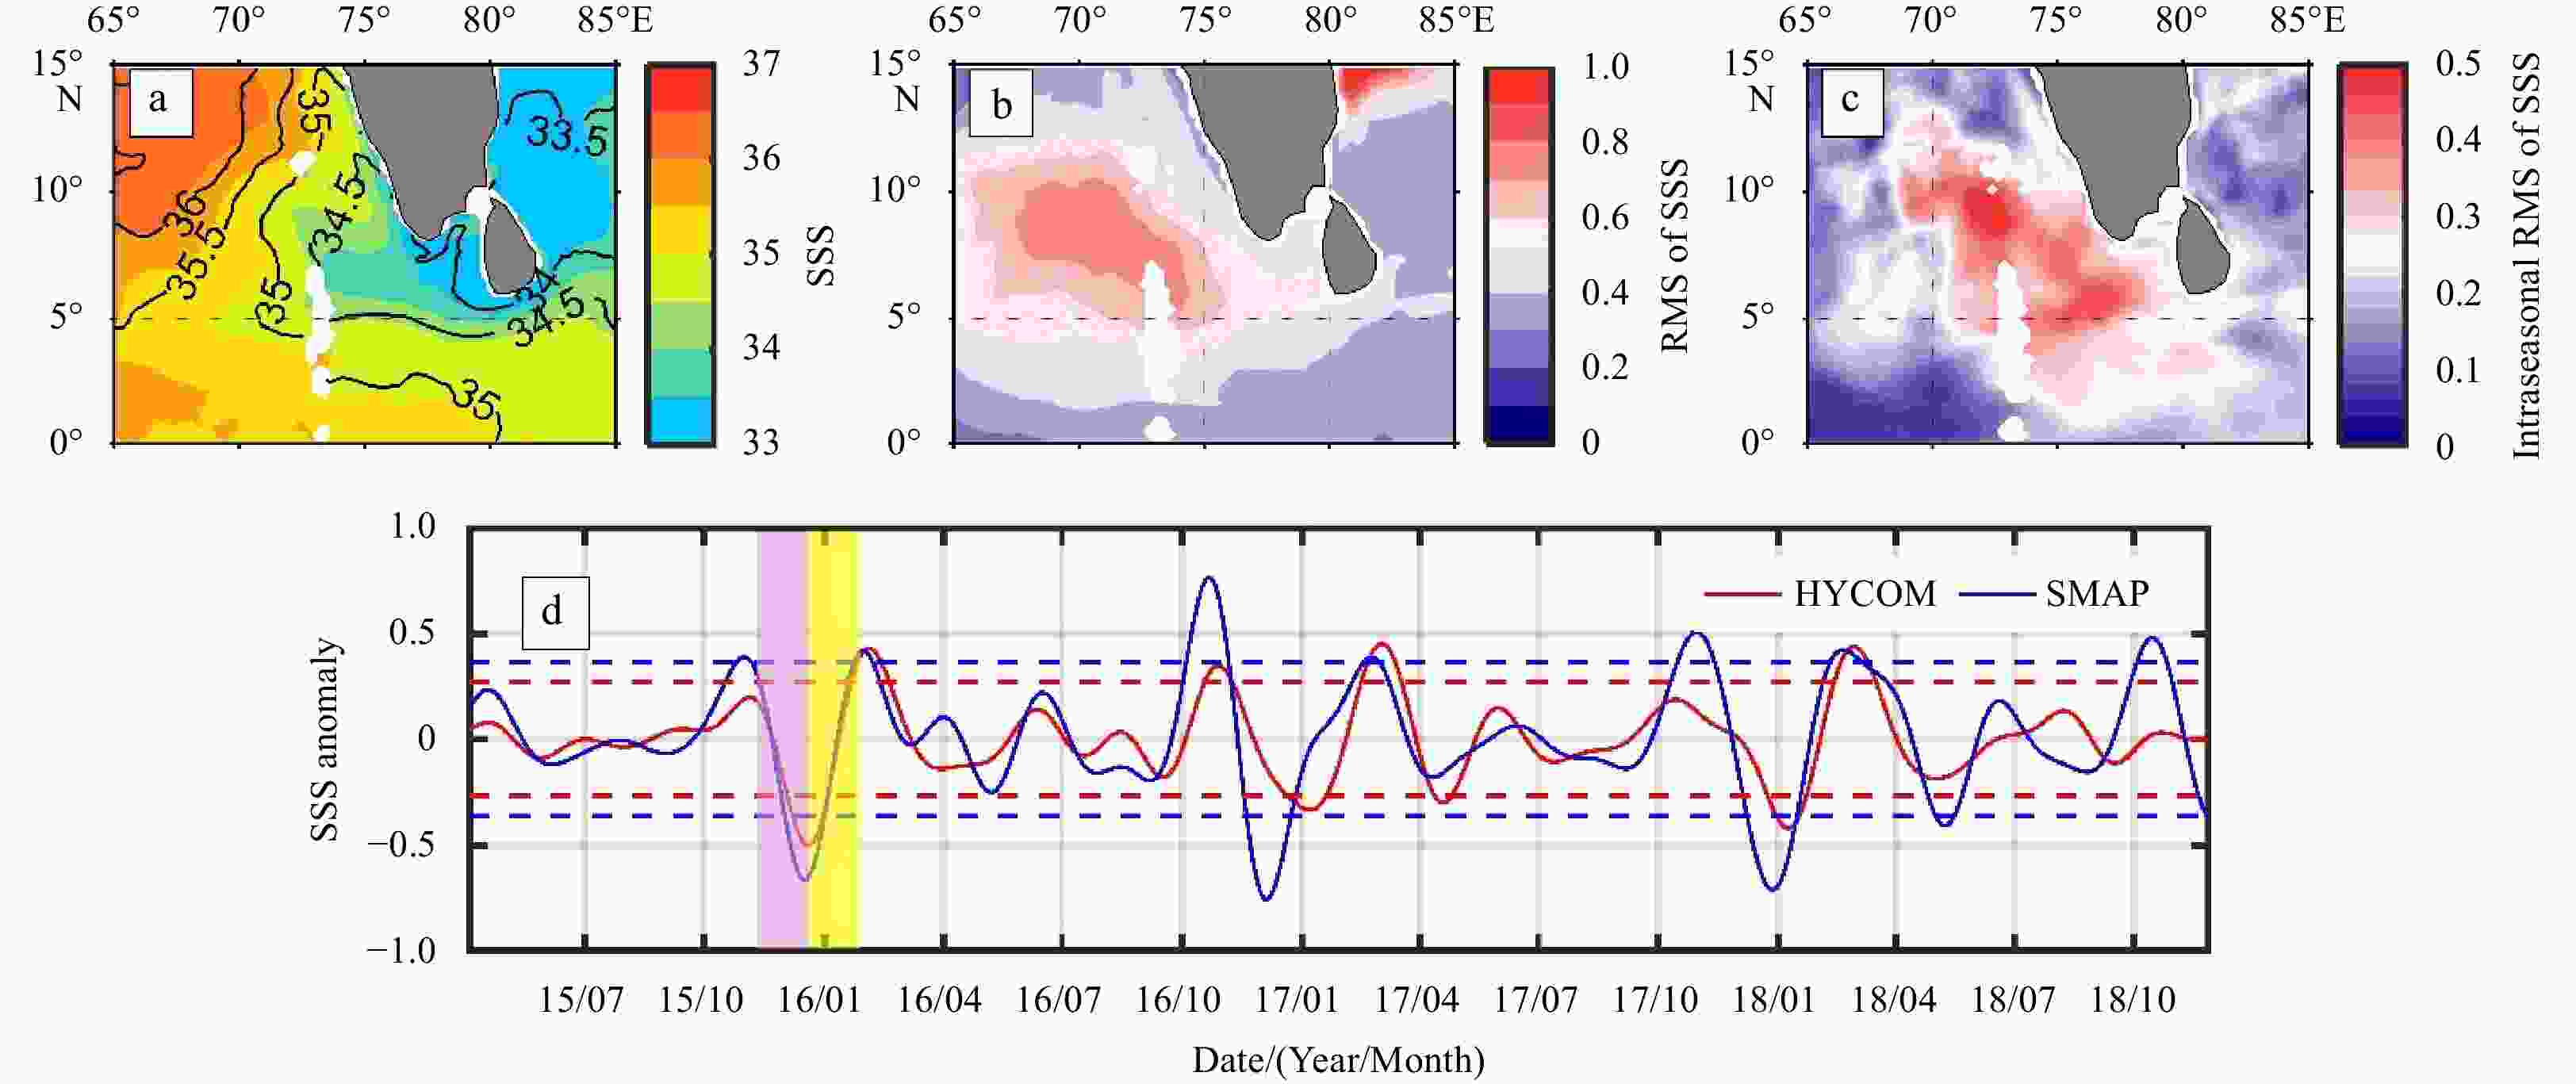
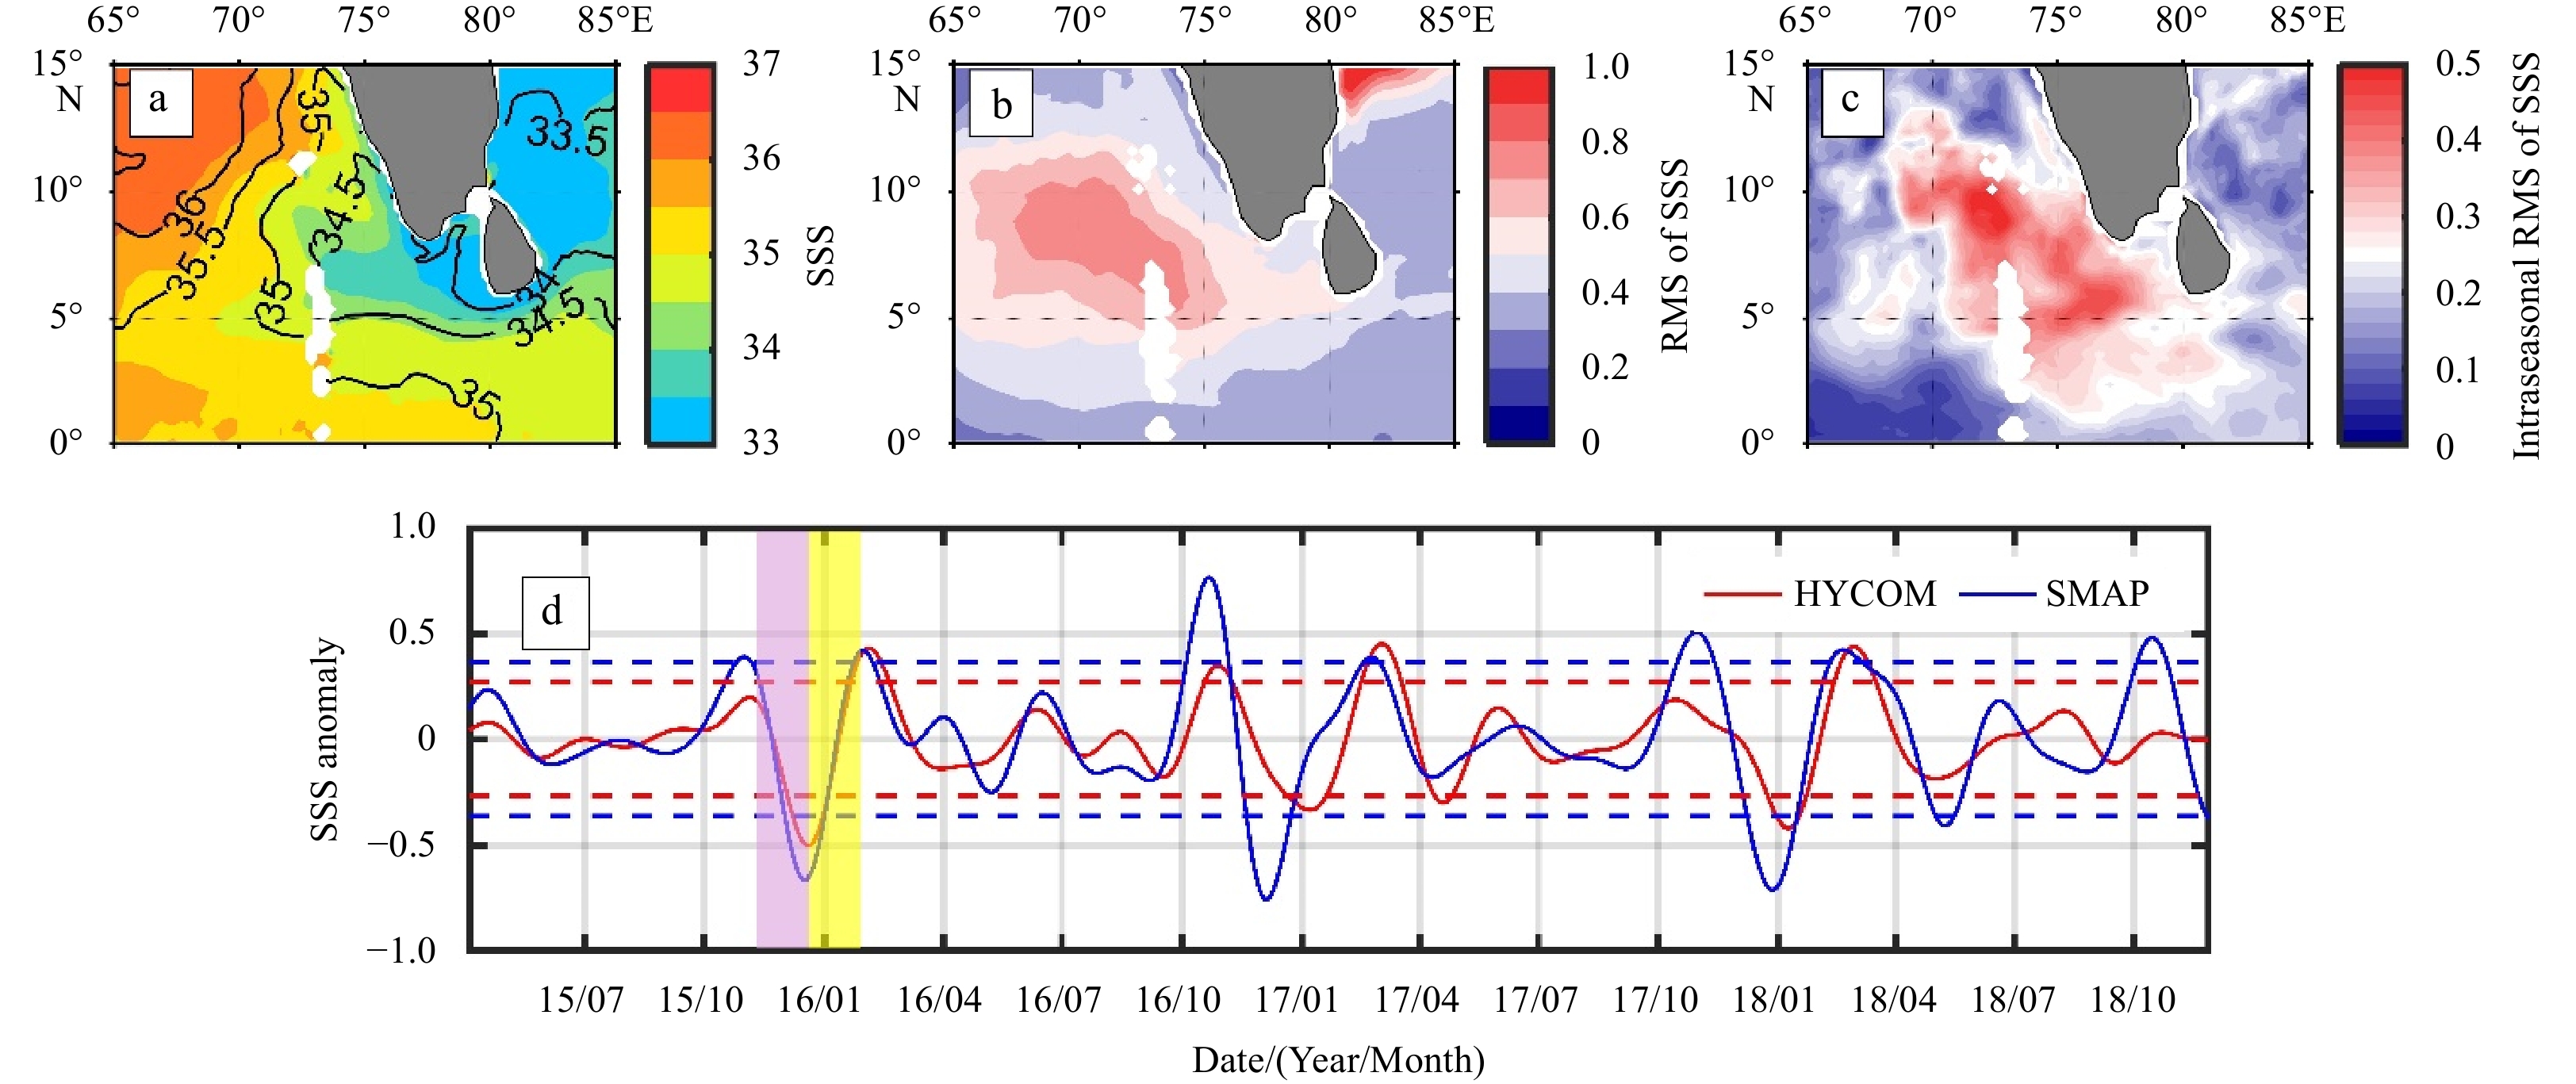
Figure 8. Soil Moisture Active Passive (SMAP) SSS and Hybrid Coordinate Ocean Model (HYCOM) SSS (contours) for winter during 2015 and 2018 (a), RMS of HYCOM SSS (b), intraseasonal RMS of HYCOM SSS (c), and time series of the HYCOM SSS anomaly (blue curves) and SMAP SSS anomaly (red curves) of region A (d). The purple shading and yellow shading in d represents Stage 1 and Stage 2, respectively. The red (blue) dashed line represents 1.5 times the standard deviation of HYCOM (SMAP) SSS.
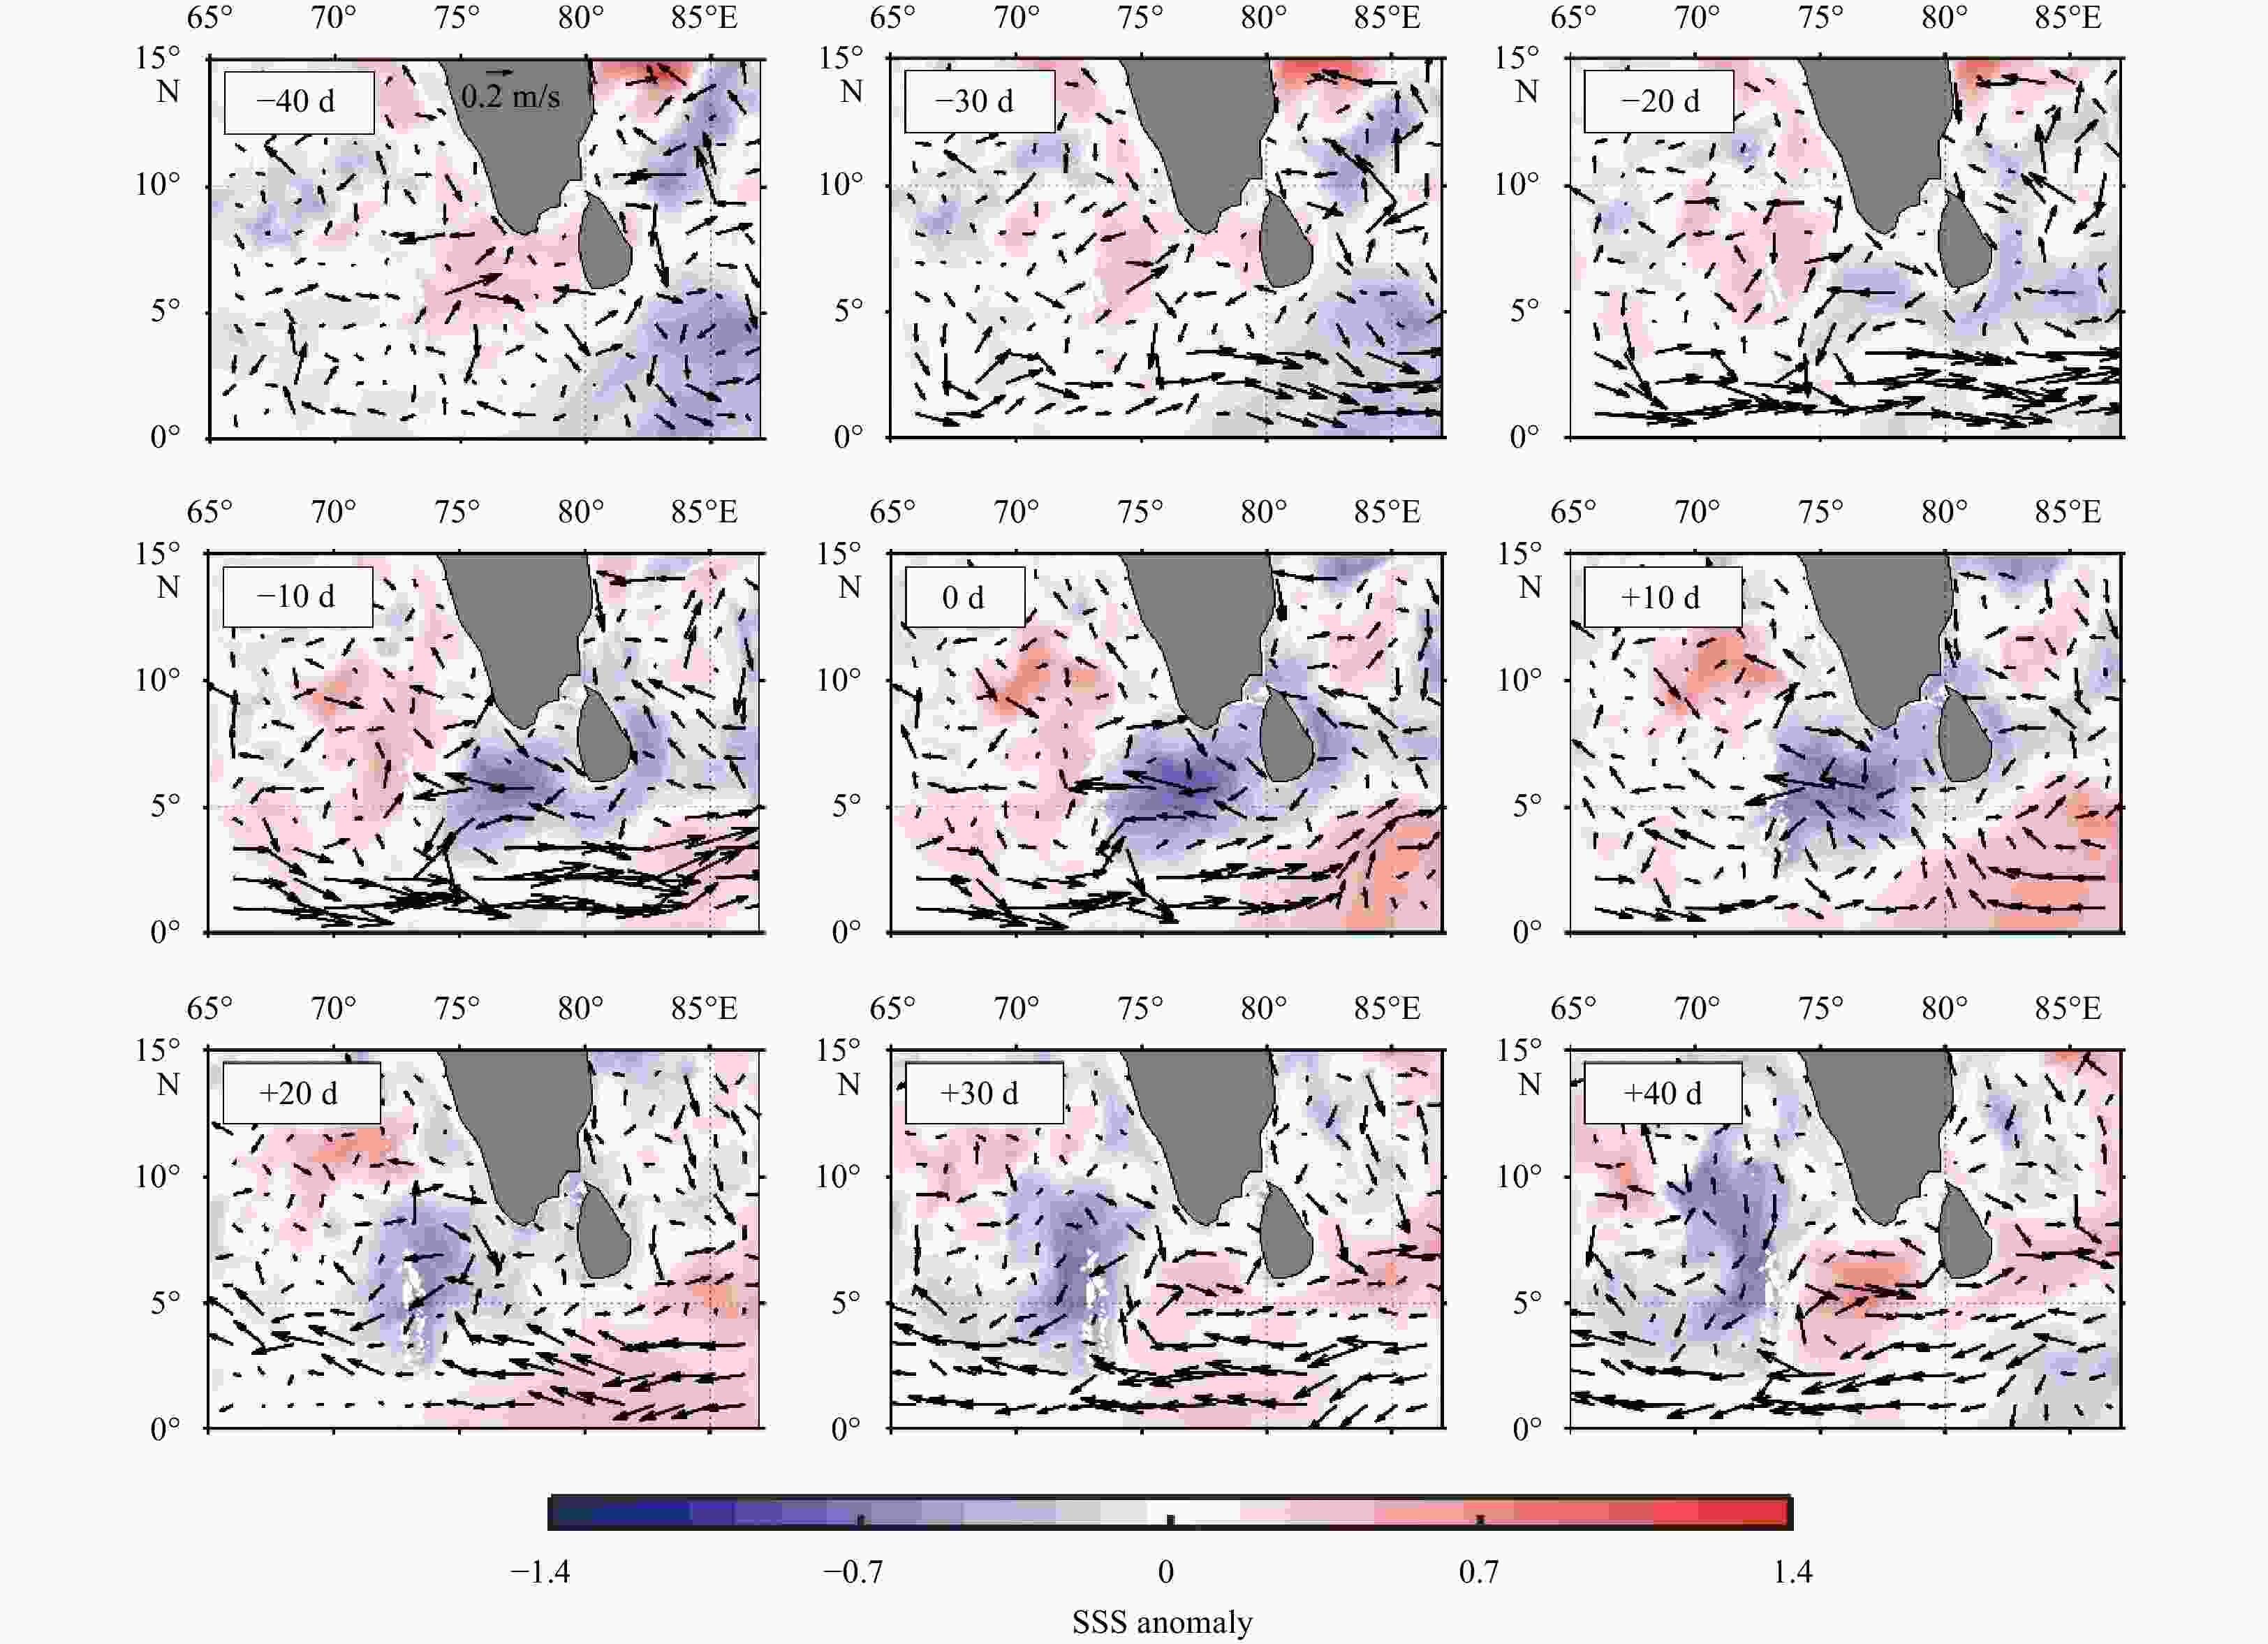
Figure 9. Evolution process of the HYCOM SSS anomaly and surface current anomaly (arrows; unit: m/s) from −40 d to +40 d with 10-d intervals for the strong intraseasonal event in 2016 winter. The date with the minimum salinity of this event is selected as the reference time (0 d).
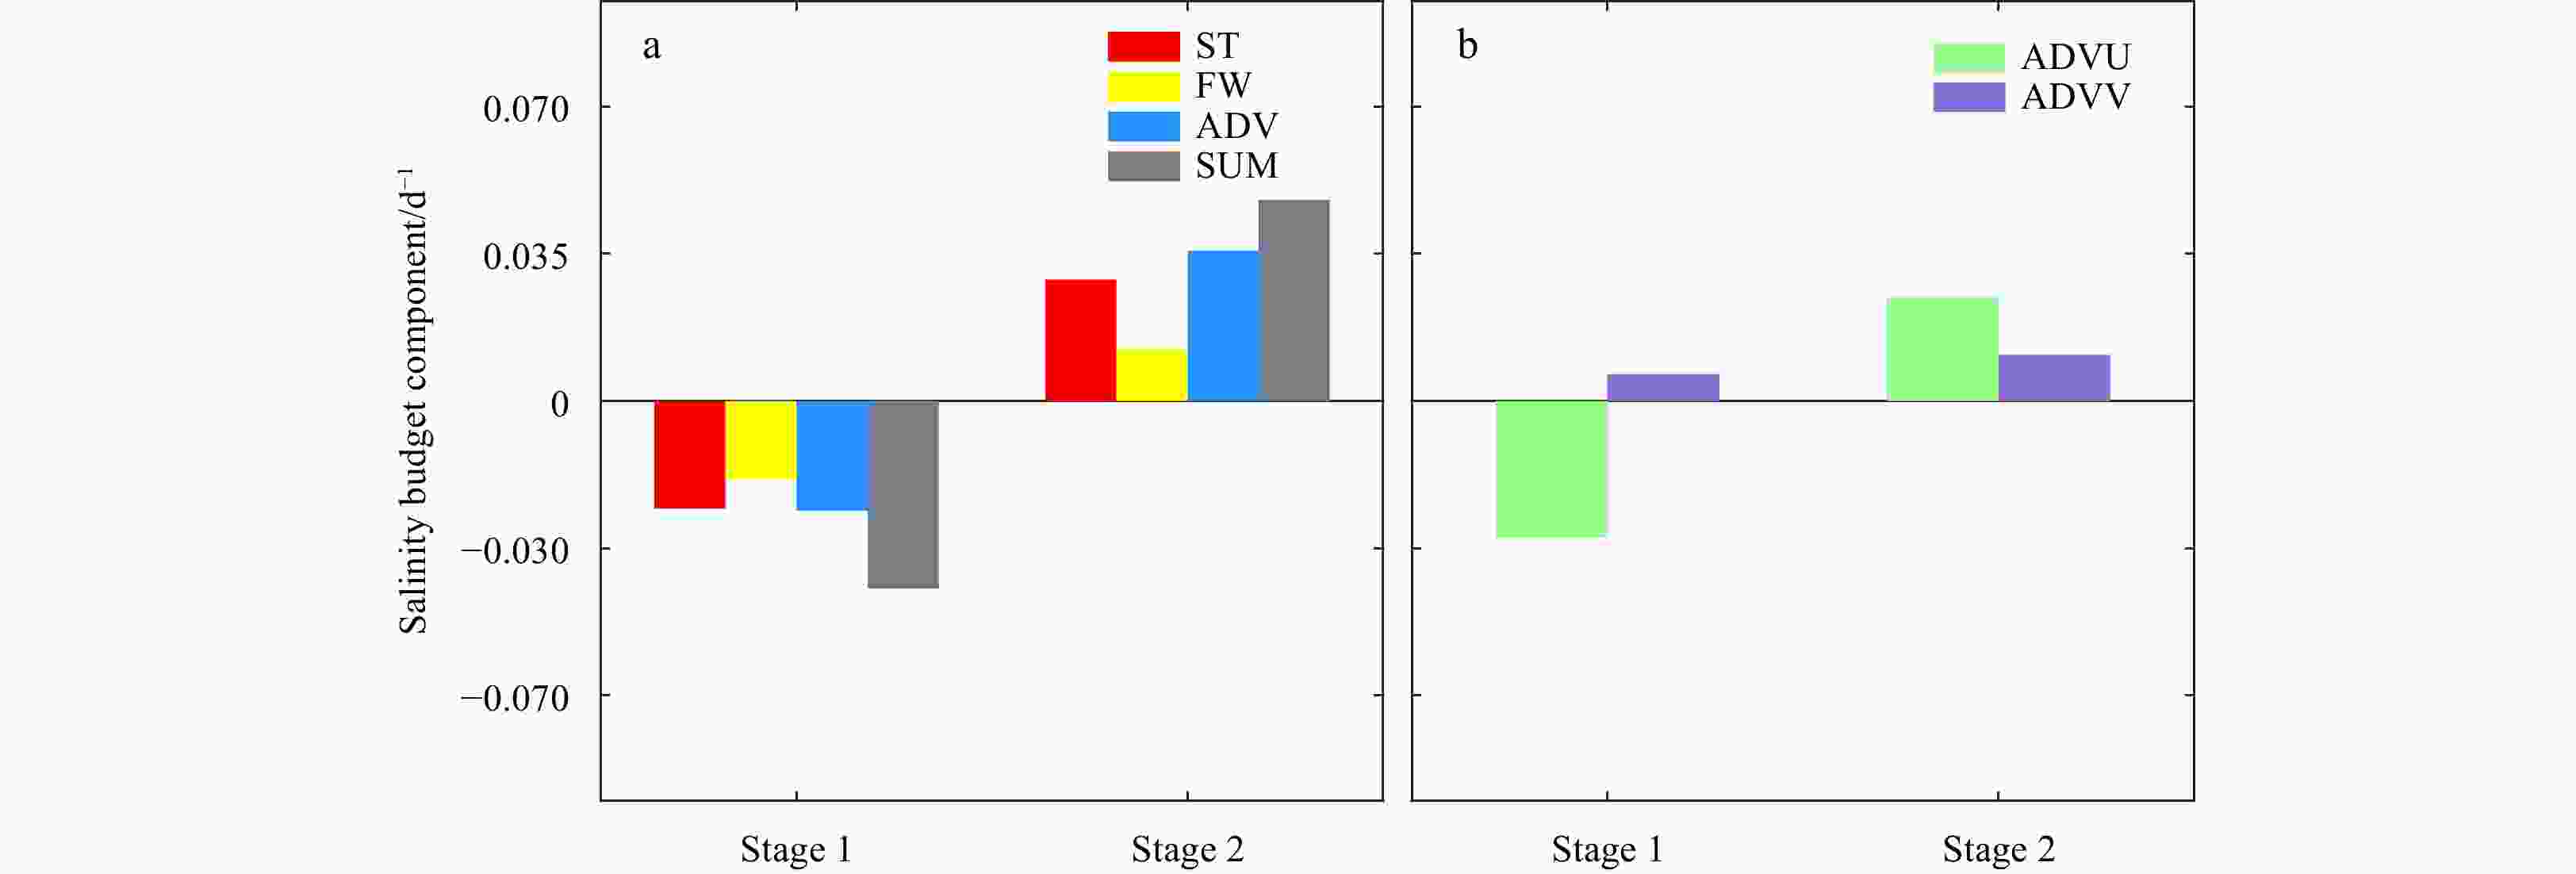
Figure 10. Salinity budget components of the mixed layer salinity anomaly over region A for the strong intraseasonal event in 2016 winter calculated from the HYCOM output. In a, ST is the tendency of the mixed layer salinity anomaly; FW and ADV represent the tendencies of the mixed layer salinity anomaly caused by surface freshwater flux and horizontal advection, respectively; the sum of these two terms is denoted as SUM. ADVU and ADVV in b as shown in a but for zonal advection and meridional advection, respectively.
-
Behara A, Vinayachandran P N, Shankar D. 2019. Influence of rainfall over eastern Arabian Sea on its salinity. Journal of Geophysical Research: Oceans, 124(7): 5003–5020. doi: 10.1029/2019JC014999 Da-Allada C Y, Gaillard F, Kolodziejczyk N. 2015. Mixed-layer salinity budget in the tropical Indian Ocean: seasonal cycle based only on observations. Ocean Dynamics, 65(6): 845–857. doi: 10.1007/s10236-015-0837-7 Feng Ming, Hacker P, Lukas R. 1998. Upper ocean heat and salt balances in response to a westerly wind burst in the western equa-torial Pacific during TOGA COARE. Journal of Geophysical Research: Oceans, 103(C5): 10289–10311. doi: 10.1029/97JC03286 Gopalakrishna V V, Johnson Z, Salgaonkar G, et al. 2005. Observed variability of sea surface salinity and thermal inversions in the Lakshadweep Sea during contrast monsoons. Geophysical Research Letters, 32(18): L18605 Horii T, Ueki I, Ando K, et al. 2016. Impact of intraseasonal salinity variations on sea surface temperature in the eastern equatorial Indian Ocean. Journal of Oceanography, 72(2): 313–326. doi: 10.1007/s10872-015-0337-x Huffman G J, Adler R F, Arkin P, et al. 1997. The Global Precipitation Climatology Project (GPCP) combined precipitation dataset. Bulletin of the American Meteorological Society, 78(1): 5–20. doi: 10.1175/1520-0477(1997)078<0005:TGPCPG>2.0.CO;2 Jayarathna W N D S, Du Yan, Zhang Yuhong, et al. 2018. Seasonal and interannual variability of sea surface salinity in the central north Arabian Sea based on satellite and Argo observations. Journal of Nanjing University of Information Science and Technology (Natural Science Edition), 10(3): 311–323 Kara A B, Rochford P A, Hurlburt H E. 2000. An optimal definition for ocean mixed layer depth. Journal of Geophysical Research: Oceans, 105(C7): 16803–16821. doi: 10.1029/2000JC900072 Li Yuanlong, Han Weiqing, Lee T. 2015. Intraseasonal sea surface salinity variability in the equatorial Indo-Pacific Ocean induced by Madden-Julian oscillations. Journal of Geophysical Research: Oceans, 120(3): 2233–2258. doi: 10.1002/2014JC010647 Li Xin, Yin Ming, Chen Xiong, et al. 2020. Impacts of the tropical Pacific–Indian Ocean associated mode on Madden–Julian oscillation over the maritime continent in boreal winter. Atmosphere, 11(10): 1049. doi: 10.3390/atmos11101049 Matthews A J, Singhruck P, Heywood K J. 2010. Ocean temperature and salinity components of the Madden–Julian oscillation observed by Argo floats. Climate Dynamics, 35(7–8): 1149–1168 Narvekar J, D’Mello J R, Prasanna Kumar S, et al. 2017. Winter-time variability of the eastern Arabian Sea: A comparison between 2003 and 2013. Geophysical Research Letters, 44(12): 6269–6277. doi: 10.1002/2017GL072965 Nyadjro E S, Subrahmanyam B, Murty V S N, et al. 2012. The role of salinity on the dynamics of the Arabian Sea mini warm pool. Journal of Geophysical Research: Oceans, 117(C9): C09002 Prakash S, Mahesh C, Mohan Gairola R. 2012. Observed relationship between surface freshwater flux and salinity in the north Indian Ocean. Atmospheric and Oceanic Science Letters, 5(3): 163–169. doi: 10.1080/16742834.2012.11446984 Price J F, Weller R A, Pinkel R. 1986. Diurnal cycling: Observations and models of the upper ocean response to diurnal heating, cooling, and wind mixing. Journal of Geophysical Research: Oceans, 91(C7): 8411–8427. doi: 10.1029/JC091iC07p08411 Rao R R, Sivakumar R. 2003. Seasonal variability of sea surface salinity and salt budget of the mixed layer of the north Indian Ocean. Journal of Geophysical Research: Oceans, 108(C1): 3009. doi: 10.1029/2001JC000907 Schiller A, Godfrey J S. 2003. Indian Ocean intraseasonal variability in an ocean general circulation model. Journal of Climate, 16(1): 21–39. doi: 10.1175/1520-0442(2003)016<0021:IOIVIA>2.0.CO;2 Schott F A, Xie Shangping, McCreary J P Jr. 2009. Indian Ocean circulation and climate variability. Reviews of Geophysics, 47(1): RG1002 Shankar D, Shetye S R. 1997. On the dynamics of the Lakshadweep high and low in the southeastern Arabian Sea. Journal of Geophysical Research: Oceans, 102(C6): 12551–12562. doi: 10.1029/97JC00465 Sun Qiwei, Du Yan, Zhang Yuhong, et al. 2019. Evolution of sea surface salinity anomalies in the southwestern tropical Indian Ocean during 2010–2011 influenced by a Negative IOD Event. Journal of Geophysical Research: Oceans, 124(5): 3428–3445. doi: 10.1029/2018JC014580 Vinayachandran P N, Kurian J, Neema C P. 2007. Indian Ocean response to anomalous conditions in 2006. Geophysical Research Letters, 34(15): L15602 Wang Lin, Kodera K, Chen Wen. 2012. Observed triggering of tropical convection by a cold surge: implications for MJO initiation. Quarterly Journal of the Royal Meteorological Society, 138(668): 1740–1750. doi: 10.1002/qj.1905 Wang Yanxin, Yang Xiaoyi, Hu Jianyu. 2016. Position variability of the Kuroshio Extension sea surface temperature front. Acta Oceanologica Sinica, 35(7): 30–35. doi: 10.1007/s13131-016-0909-7 Wu Yue, Liu Lin, Zheng Xiaotong. 2020. Influence of El Niño events on sea surface salinity over the central equatorial Indian Ocean. Environmental Research, 182: 109097. doi: 10.1016/j.envres.2019.109097 Wu Yue, Zheng Xiaotong, Sun Qiwei, et al. 2021. Decadal variability of the upper-ocean salinity in the Southeast Indian Ocean: Role of local ocean–atmosphere dynamics. Journal of Climate, 34(19): 7927–7942. doi: 10.1175/JCLI-D-21-0122.1 Xu Jindian, Gao Lu. 2018. The temporal-spatial features of evaporation and precipitation and the effect on sea surface salinity in the tropical Indian Ocean. Haiyang Xuebao (in Chinese), 40(7): 90–102 Zhang Yuhong, Du Yan. 2012. Seasonal variability of salinity budget and water exchange in the northern Indian Ocean from HYCOM assimilation. Chinese Journal of Oceanology and Limnology, 30(6): 1082–1092. doi: 10.1007/s00343-012-1284-7 -

 下载:
下载:


 点击查看大图
计量
- 文章访问数: 422
- HTML全文浏览量: 177
- PDF下载量: 36
- 被引次数: 0

