

Arctic sea ice volume export through the Fram Strait: variation and its effect factors
-
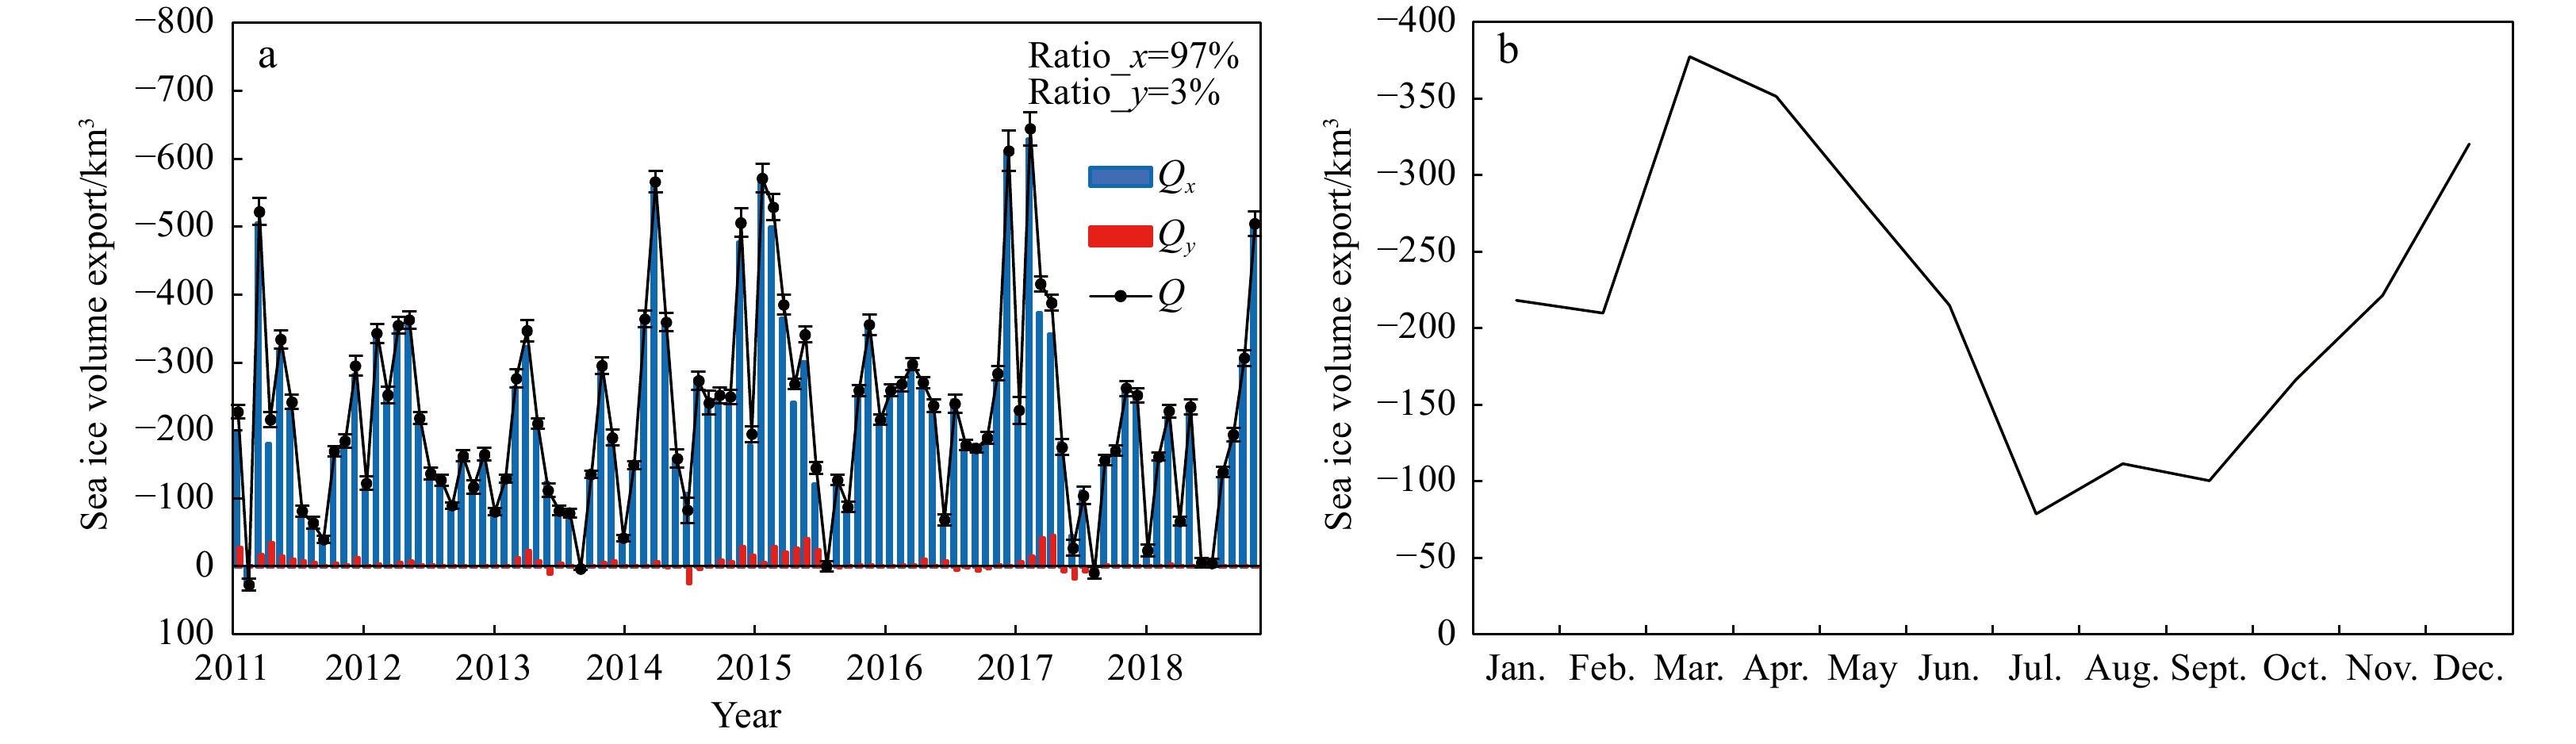
Abstract: Arctic sea ice export is important for the redistribution of freshwater and sea ice mass. Here, we use the sea ice thickness, sea ice velocity, and sea ice concentration (SIC) to estimate the exported sea ice volume through the Fram Strait from 2011 to 2018. We further analyse the contributions of the sea ice thickness, velocity and concentration to sea ice volume export. Then, the relationships between atmospheric circulation indices (Arctic Oscillation (AO), North Atlantic Oscillation (NAO), and Arctic Dipole (AD)) and the sea ice volume export are discussed. Finally, we analyse the impact of wind-driven oceanic circulation indices (Ekman transport (ET)) on the sea ice volume export. The sea ice volume export rapidly increases in winter and decreases in spring. The exported sea ice volume in winter is likely to exceed that in spring in the future. Among sea ice thickness, velocity and SIC, the greatest contribution to sea ice export comes from the ice velocity. The exported sea ice volume through the zonal gate of the Fram Strait (which contributes 97% to the total sea ice volume export of the Fram Strait) is much higher than that through the meridional gate (3%) because the sea ice flowing out of the zonal gate has the characteristics of a high thickness (mainly thicker than 1 m), a high velocity (mainly faster than 0.06 m/s) and a high concentration (mainly higher than 80%). The AD and ET explain 53.86% and 38.37% of the variation in sea ice volume export, respectively.
-
Key words:
- sea ice thickness /
- sea ice velocity /
- sea ice concentration /
- sea ice volume export /
- Arctic Dipole /
- Ekman transport /
- Fram Strait
-
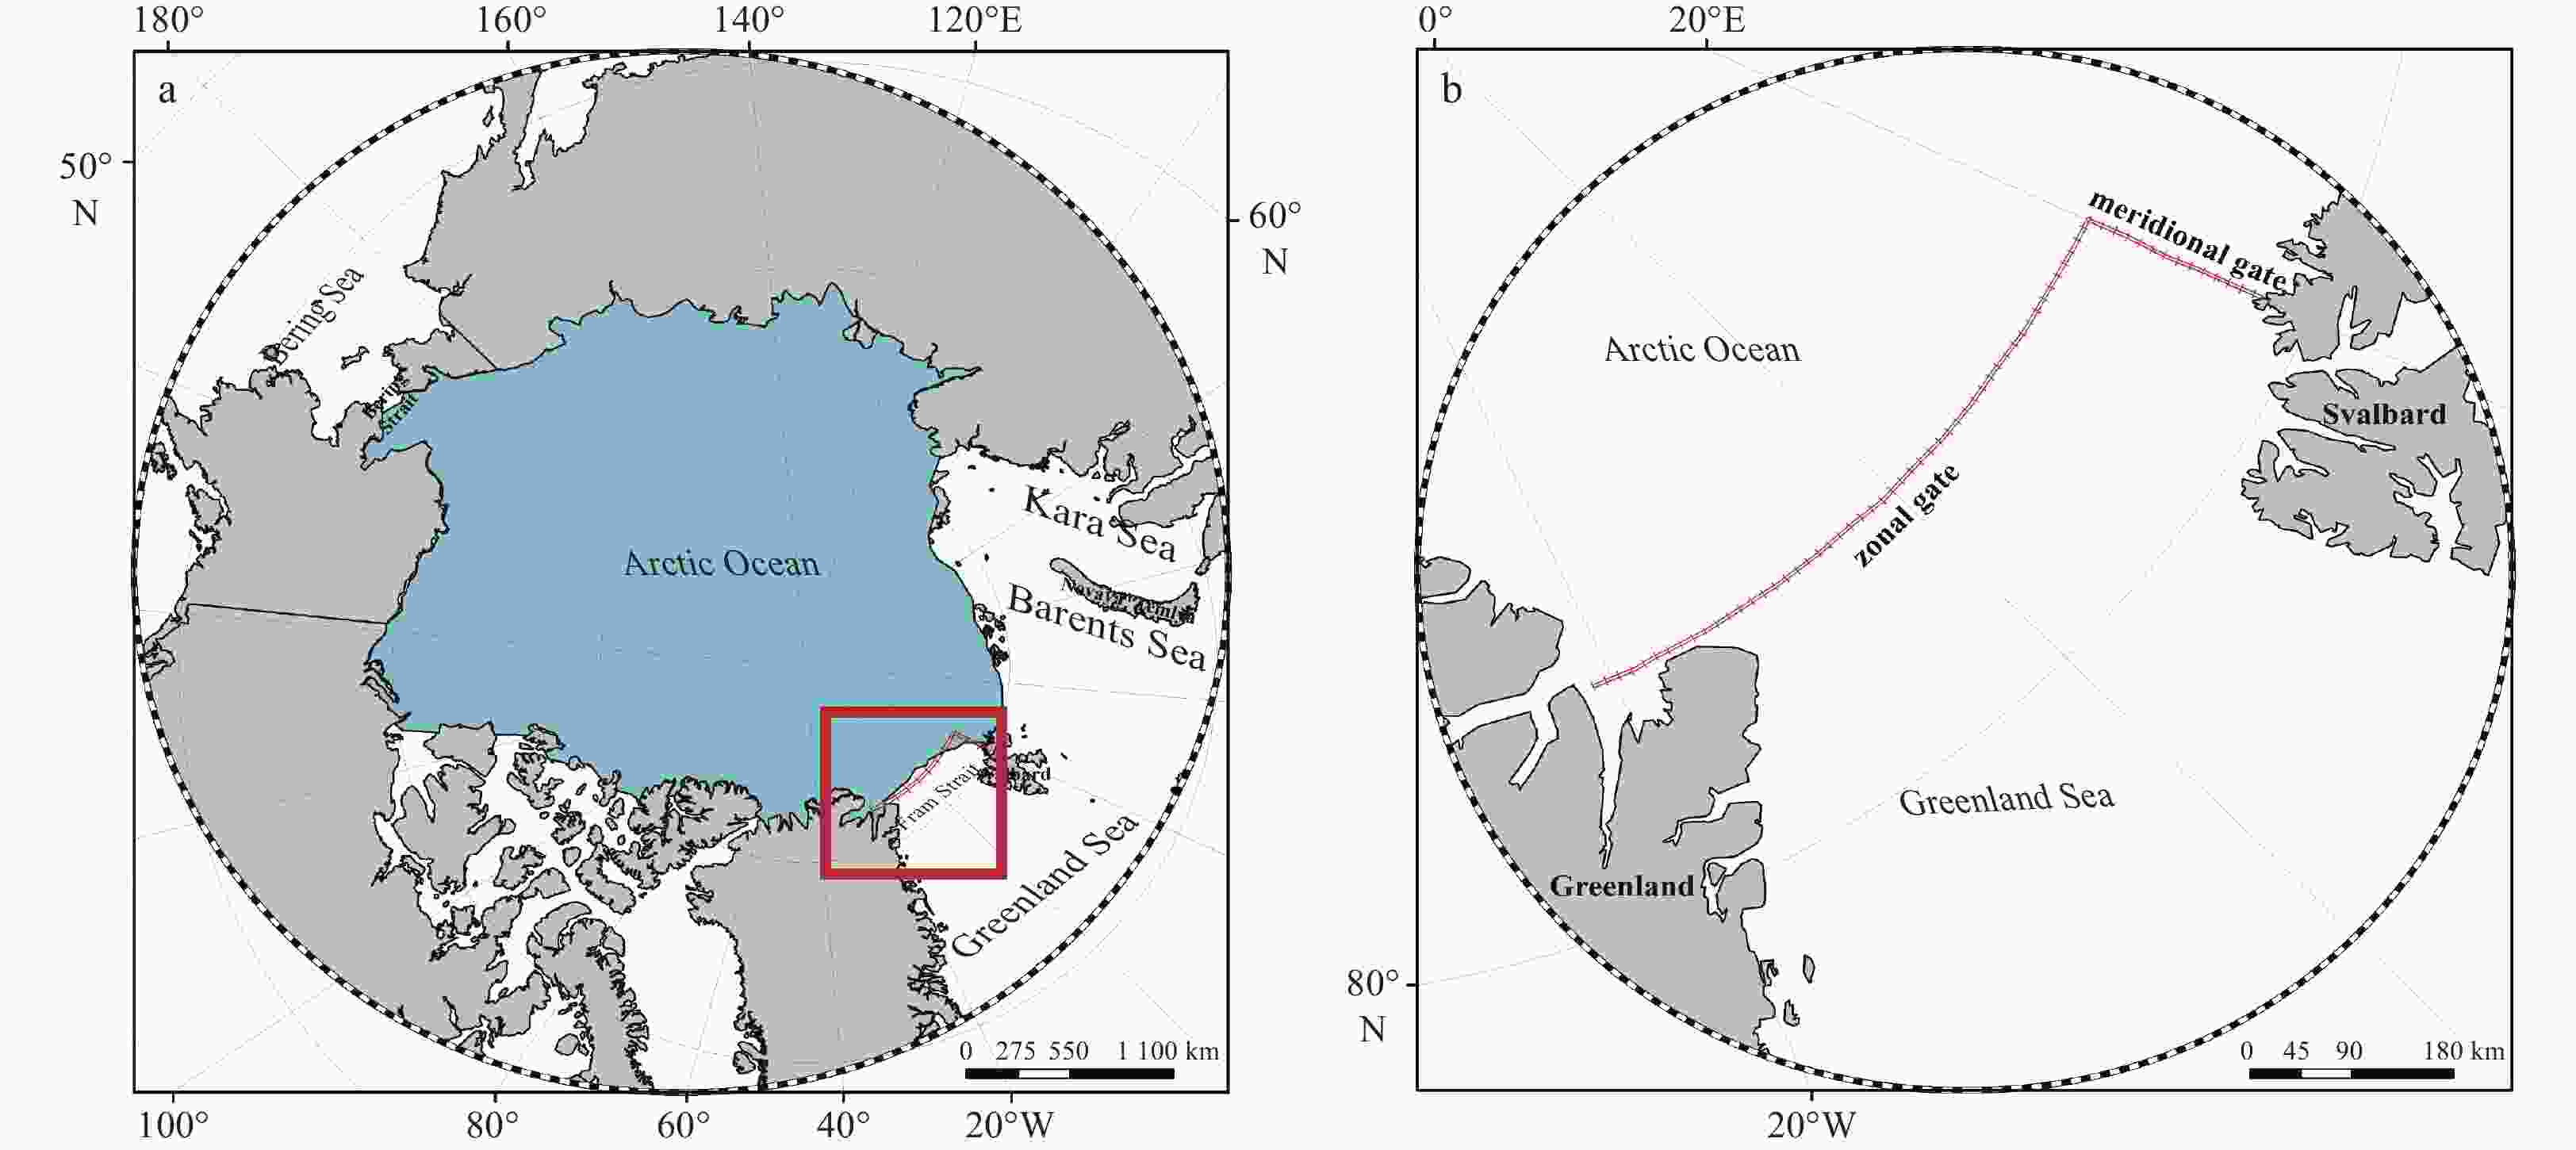
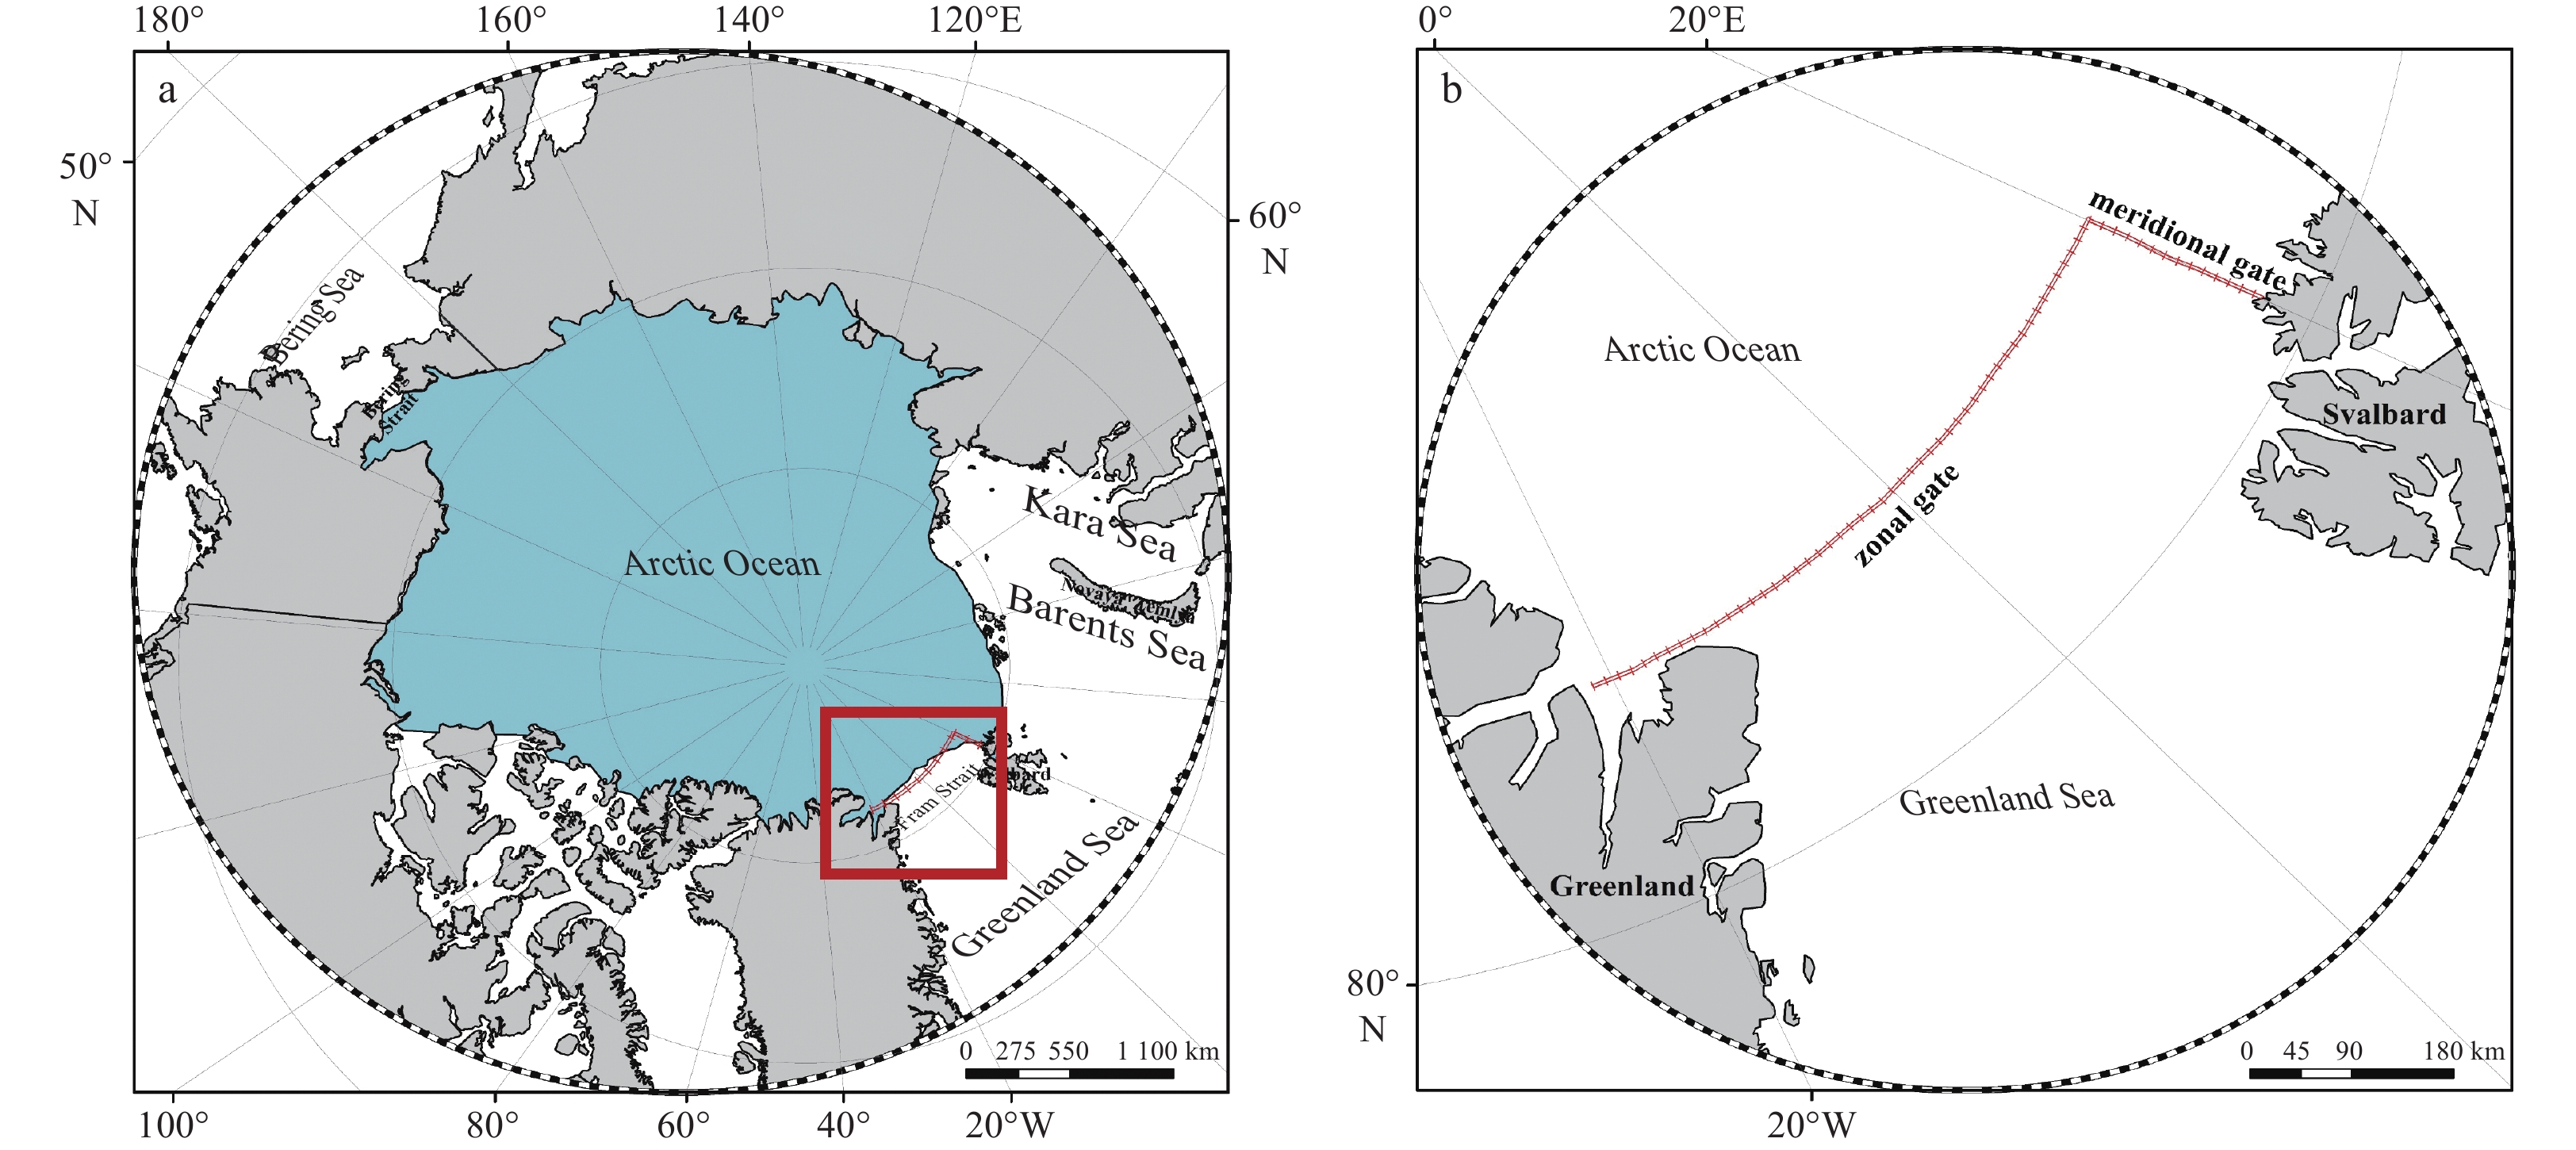
Figure 1. Extents of the Arctic Ocean and its marginal sea areas (red box shows the location of the Fram Strait) (a), and zonal gate and meridional gate of the Fram Strait (b).

Figure 2. Variations in the total sea ice volume export (Q), export flux through the zonal gate (Qx), and export flux through the meridional gate (Qy) from 2011 to 2018. The black dotted line represents the monthly average total sea ice volume export with the corresponding uncertainty, and Ratio_x (Ratio_y) represents the contribution of Qx (Qy) to Q (a); multi-year (2011–2018) monthly average sea ice volume export (b).
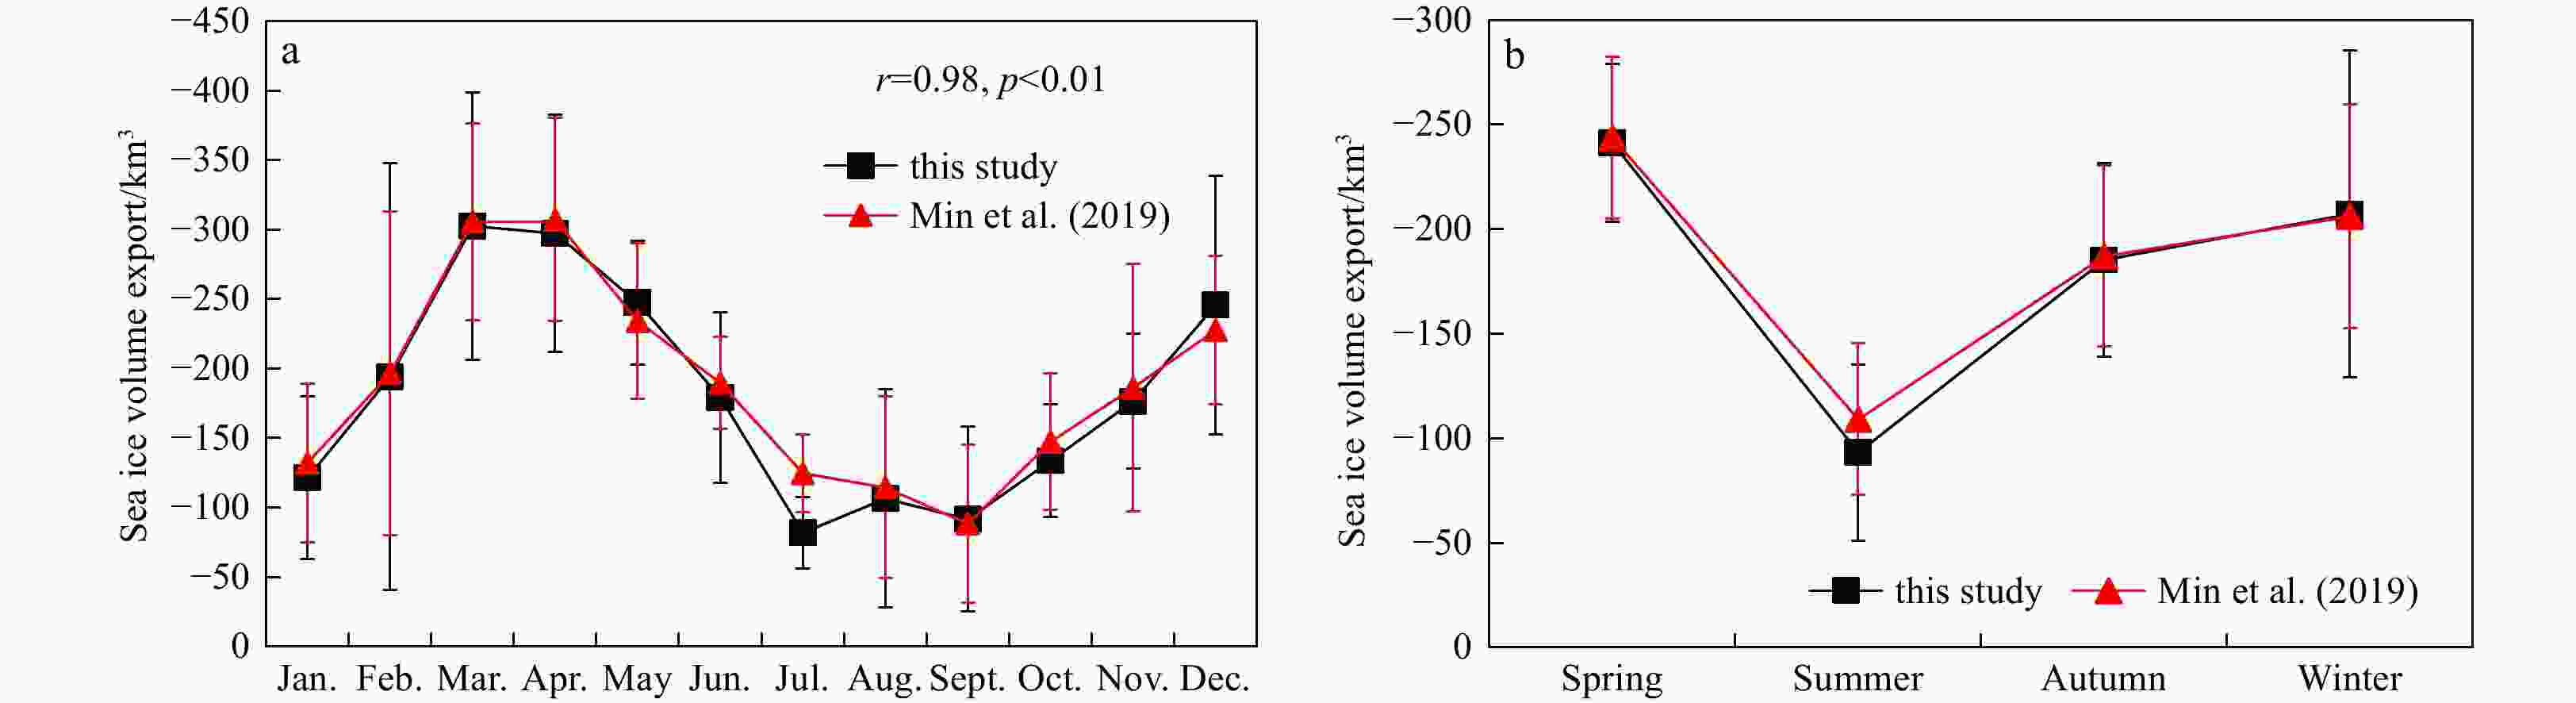
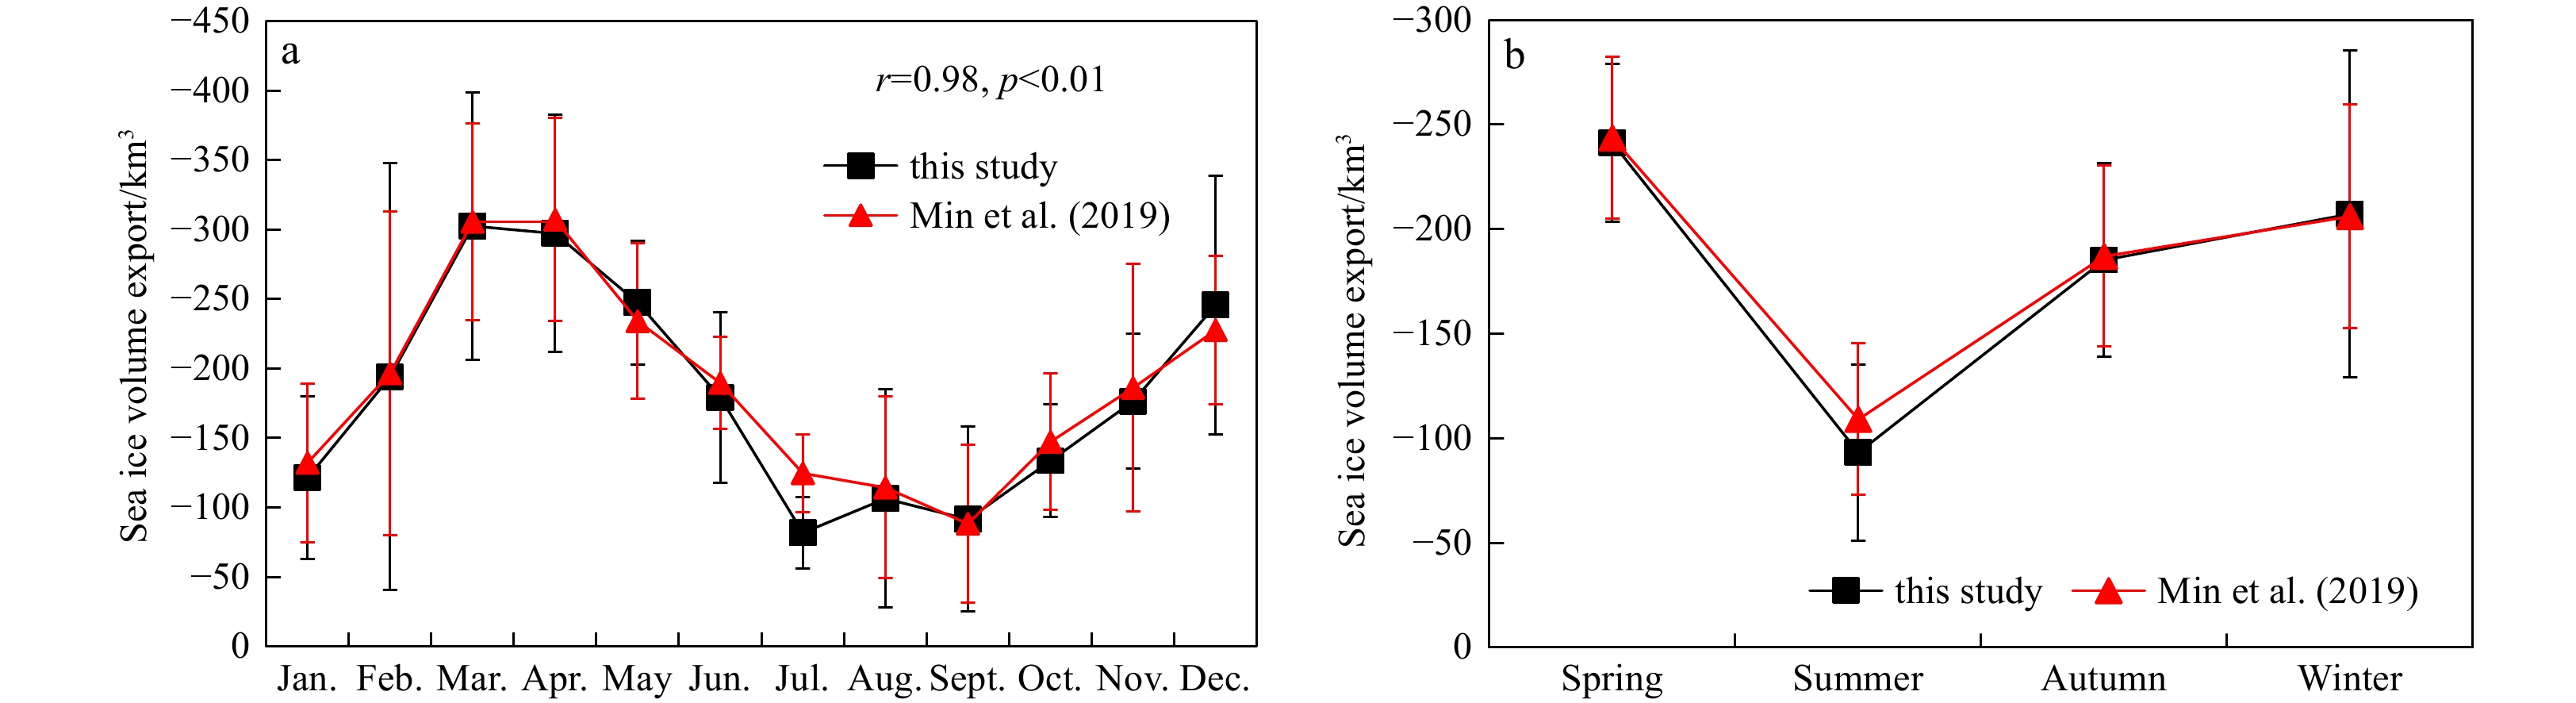
Figure 4. Monthly (a) and seasonal (b) average sea ice volume export through the gate A from this study (black line) and from Min et al. (2019) (red line). Note that error bars show one standard deviation.
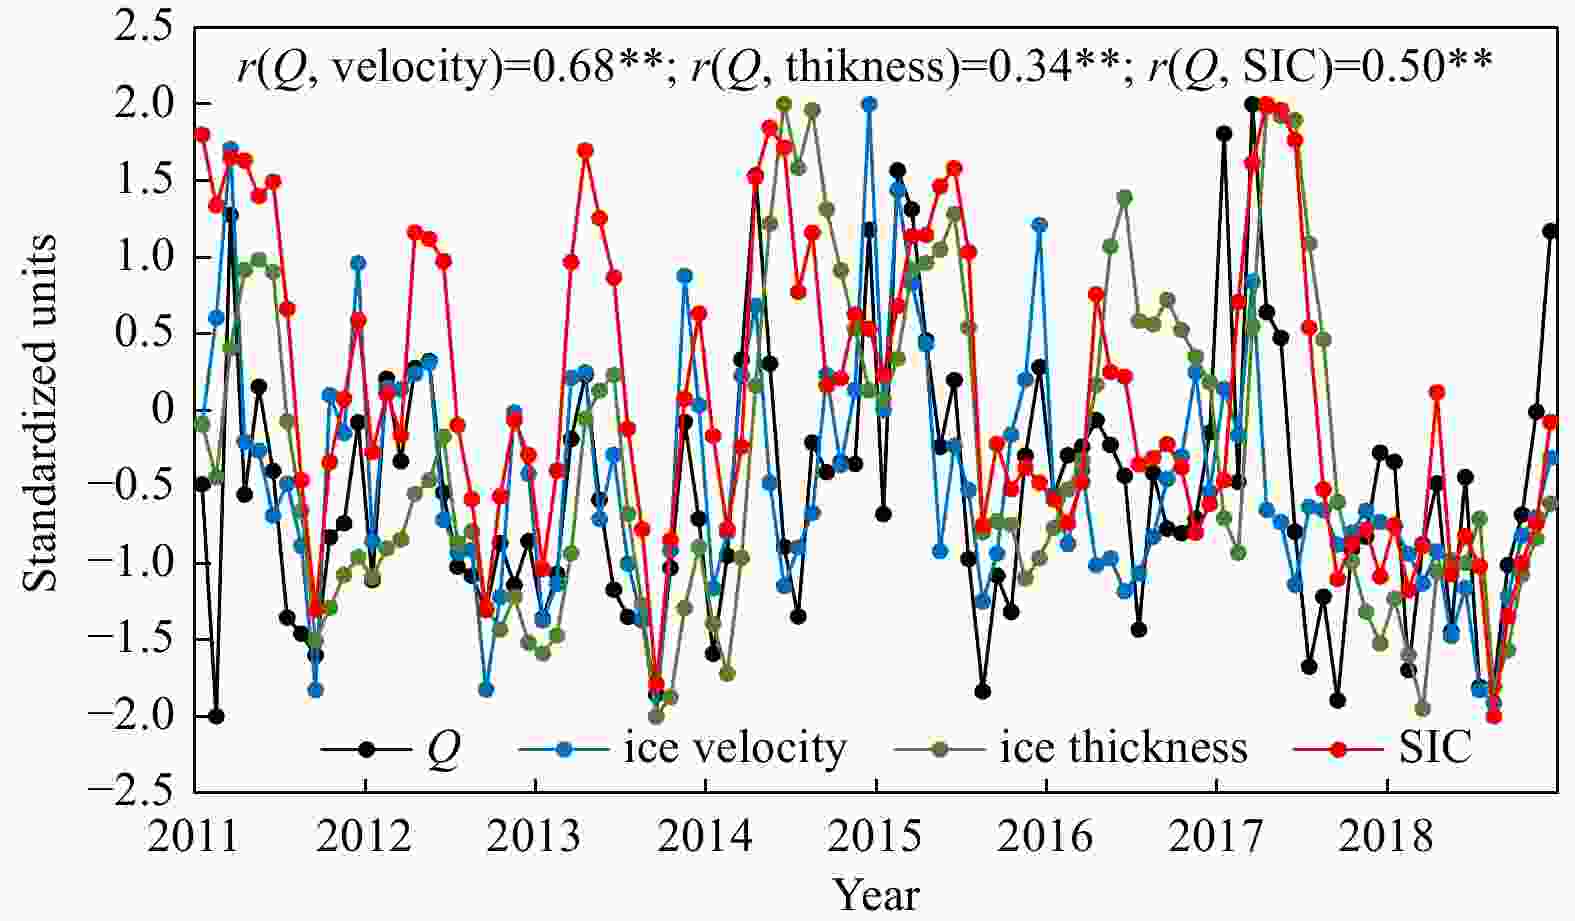
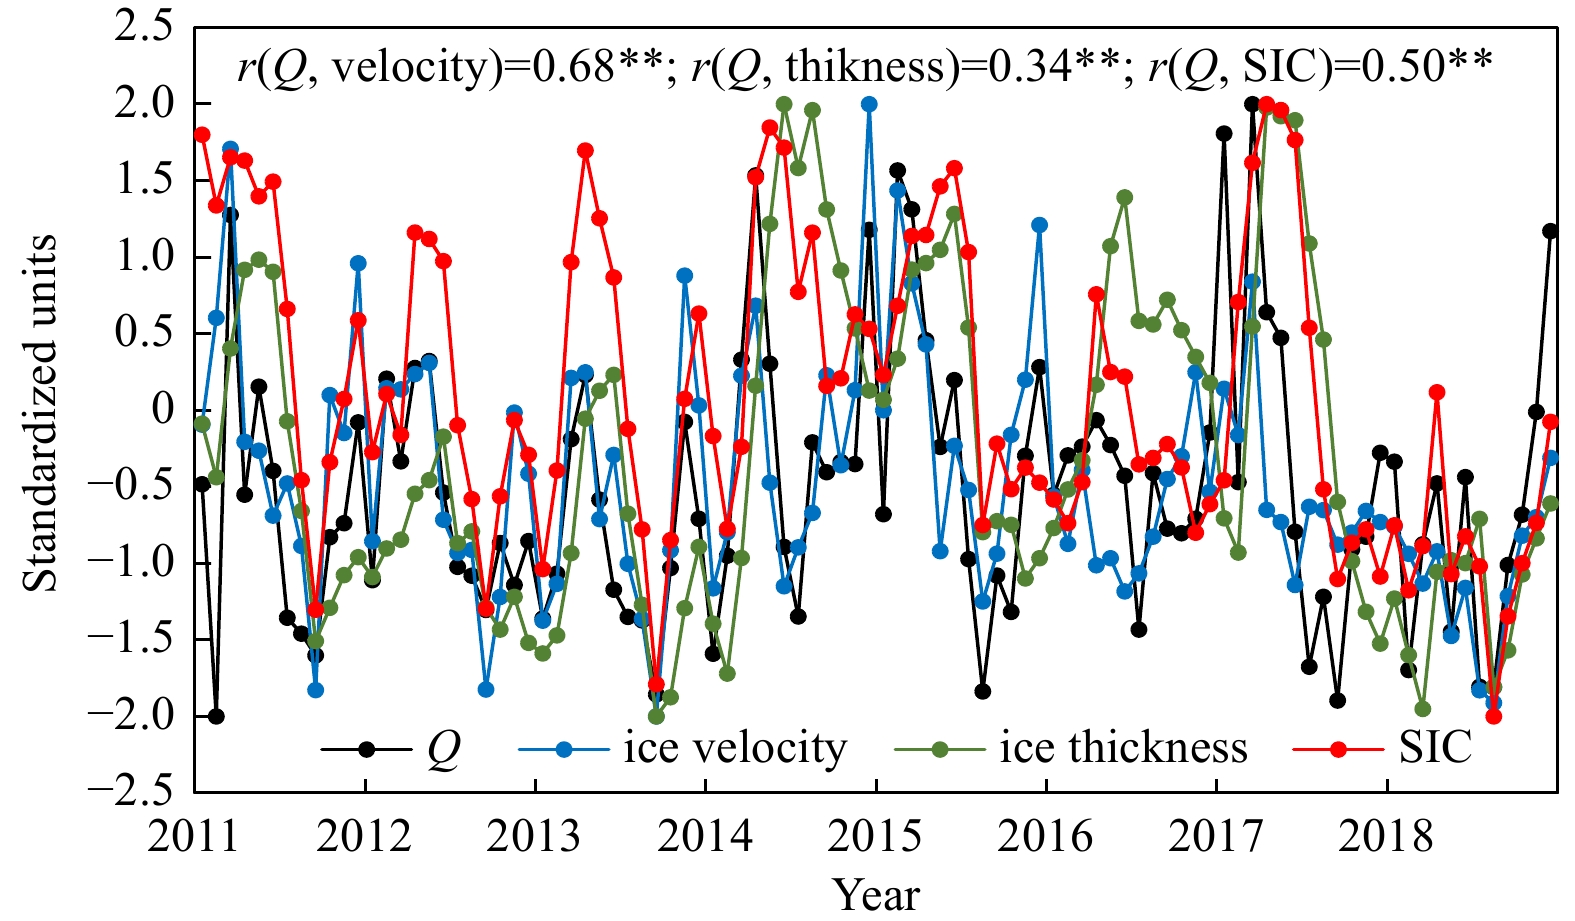
Figure 5. Standardized monthly mean sea ice volume export (Q, black line) and the corresponding monthly mean sea ice velocity (blue line), sea ice thickness (green line) and sea ice concentration (SIC) (red line) from 2011 to 2018. ** denotes p< 0.01.
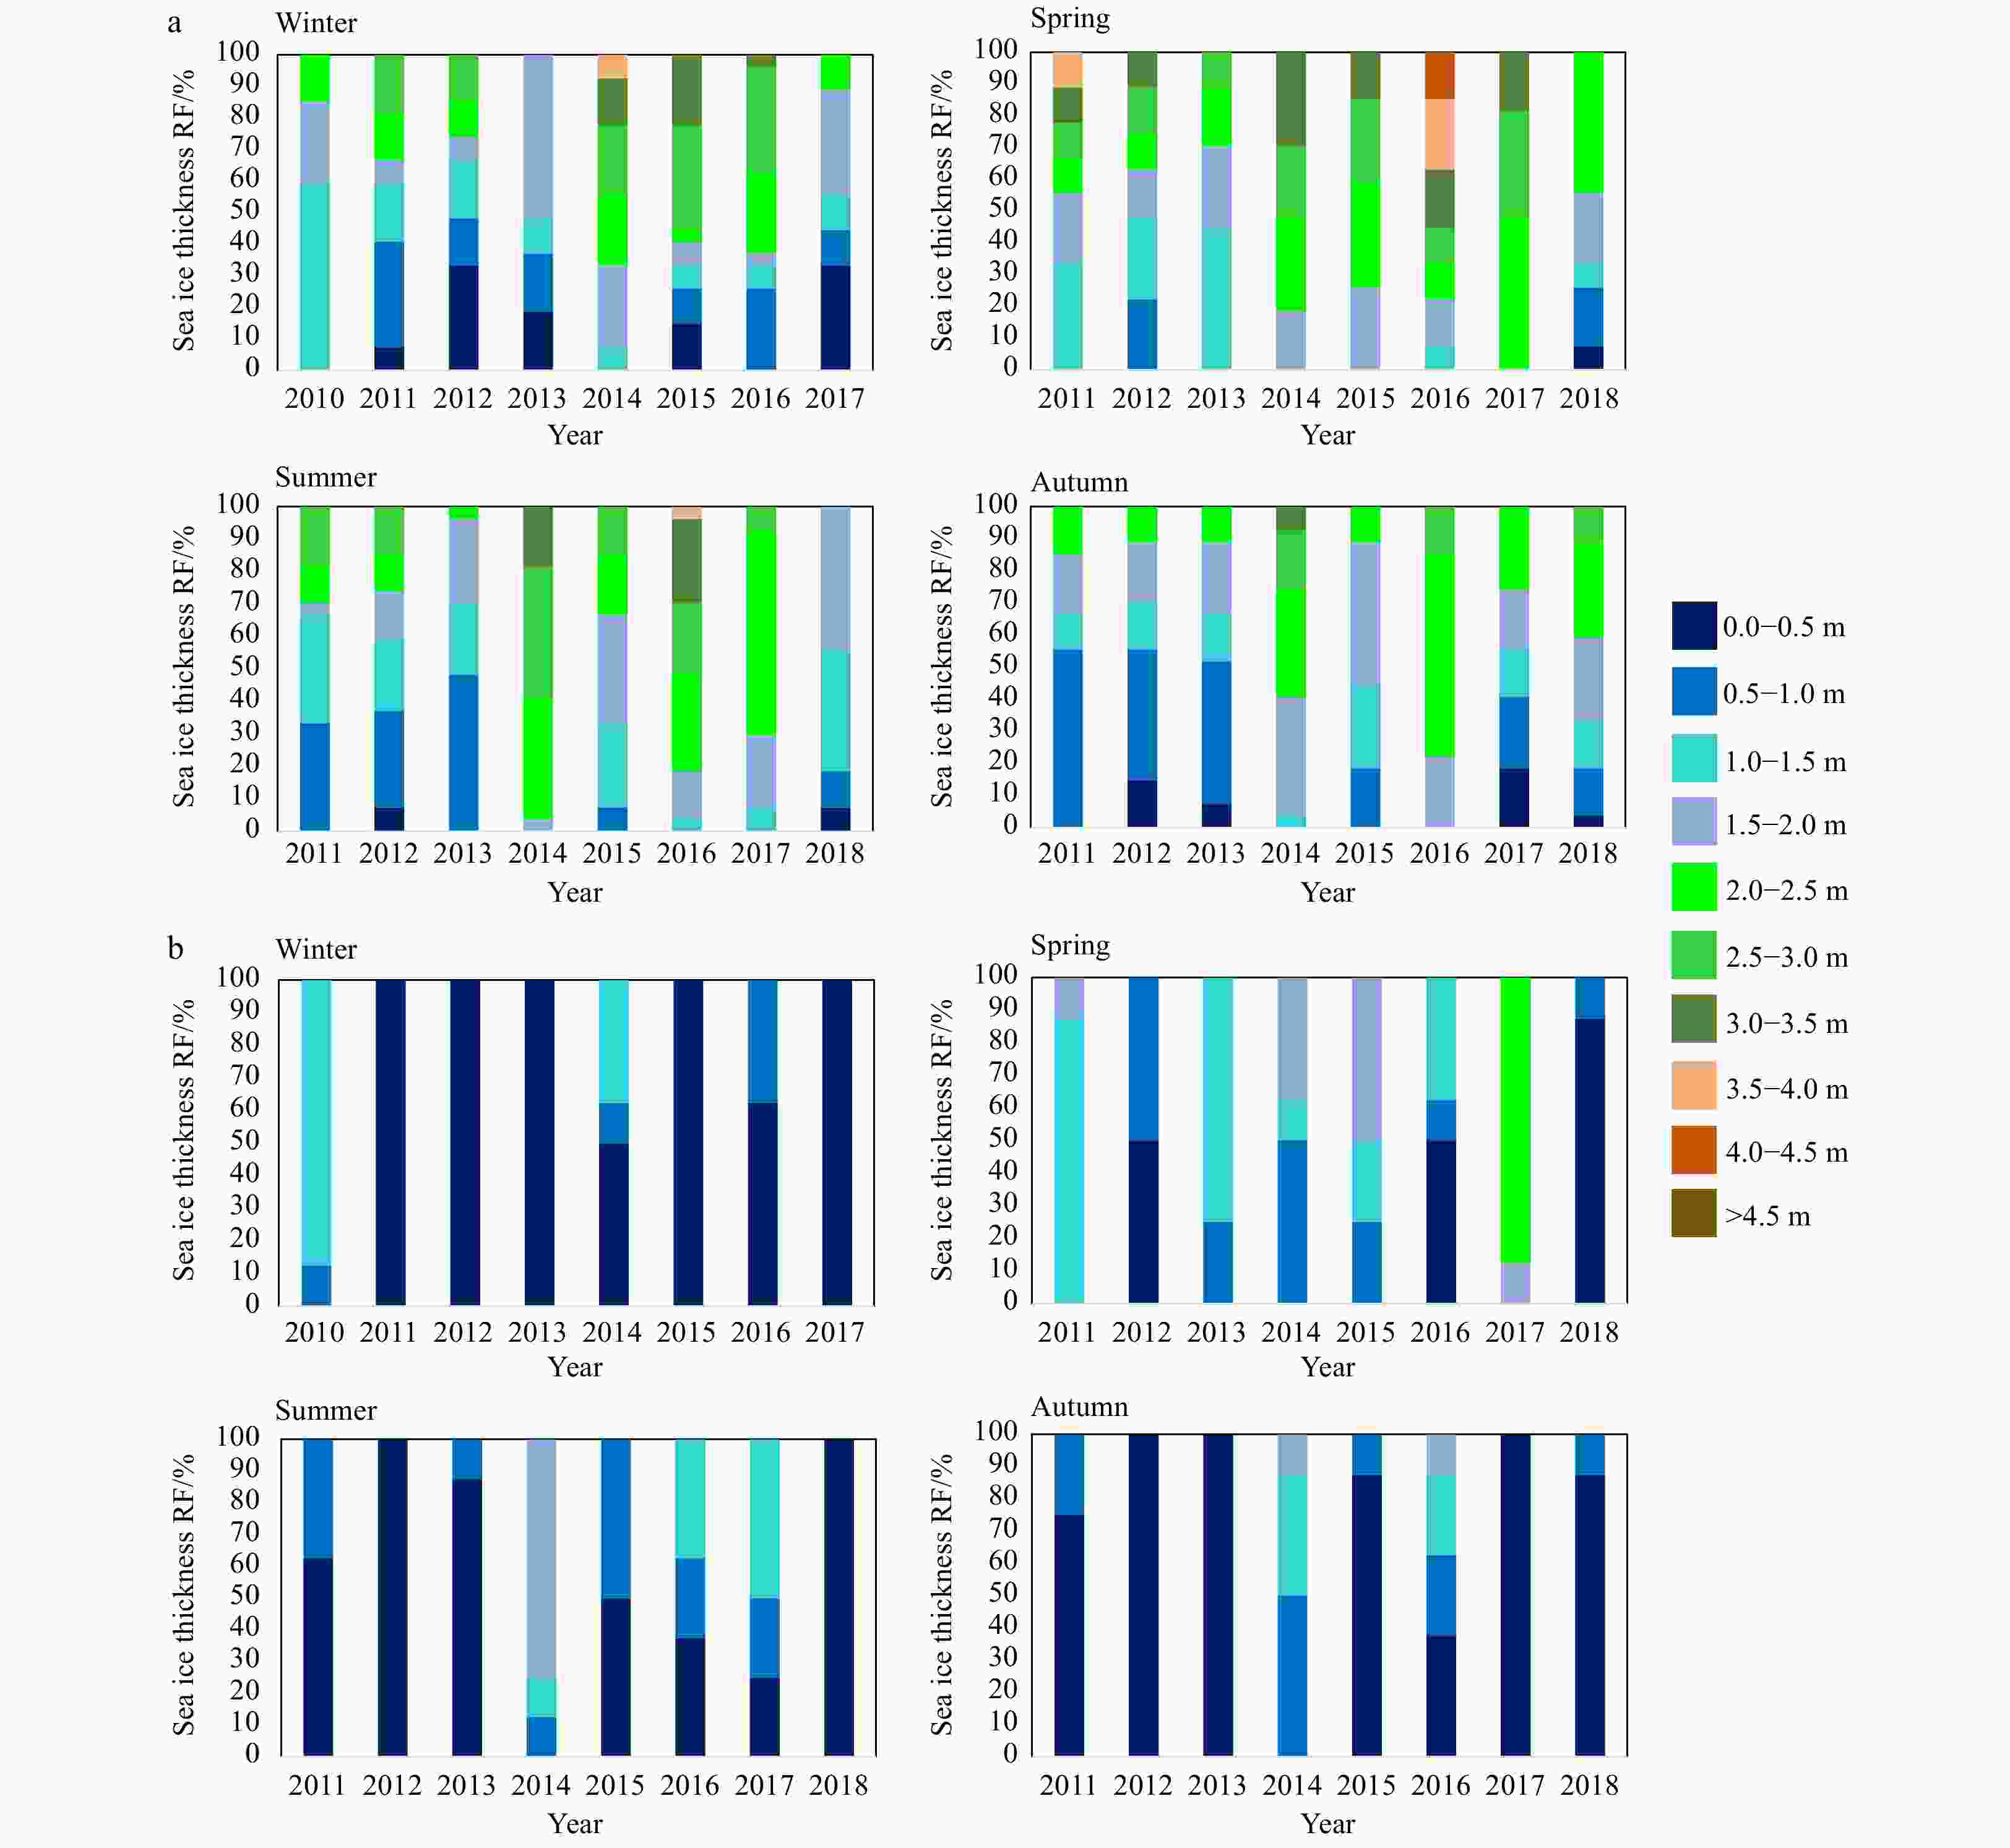
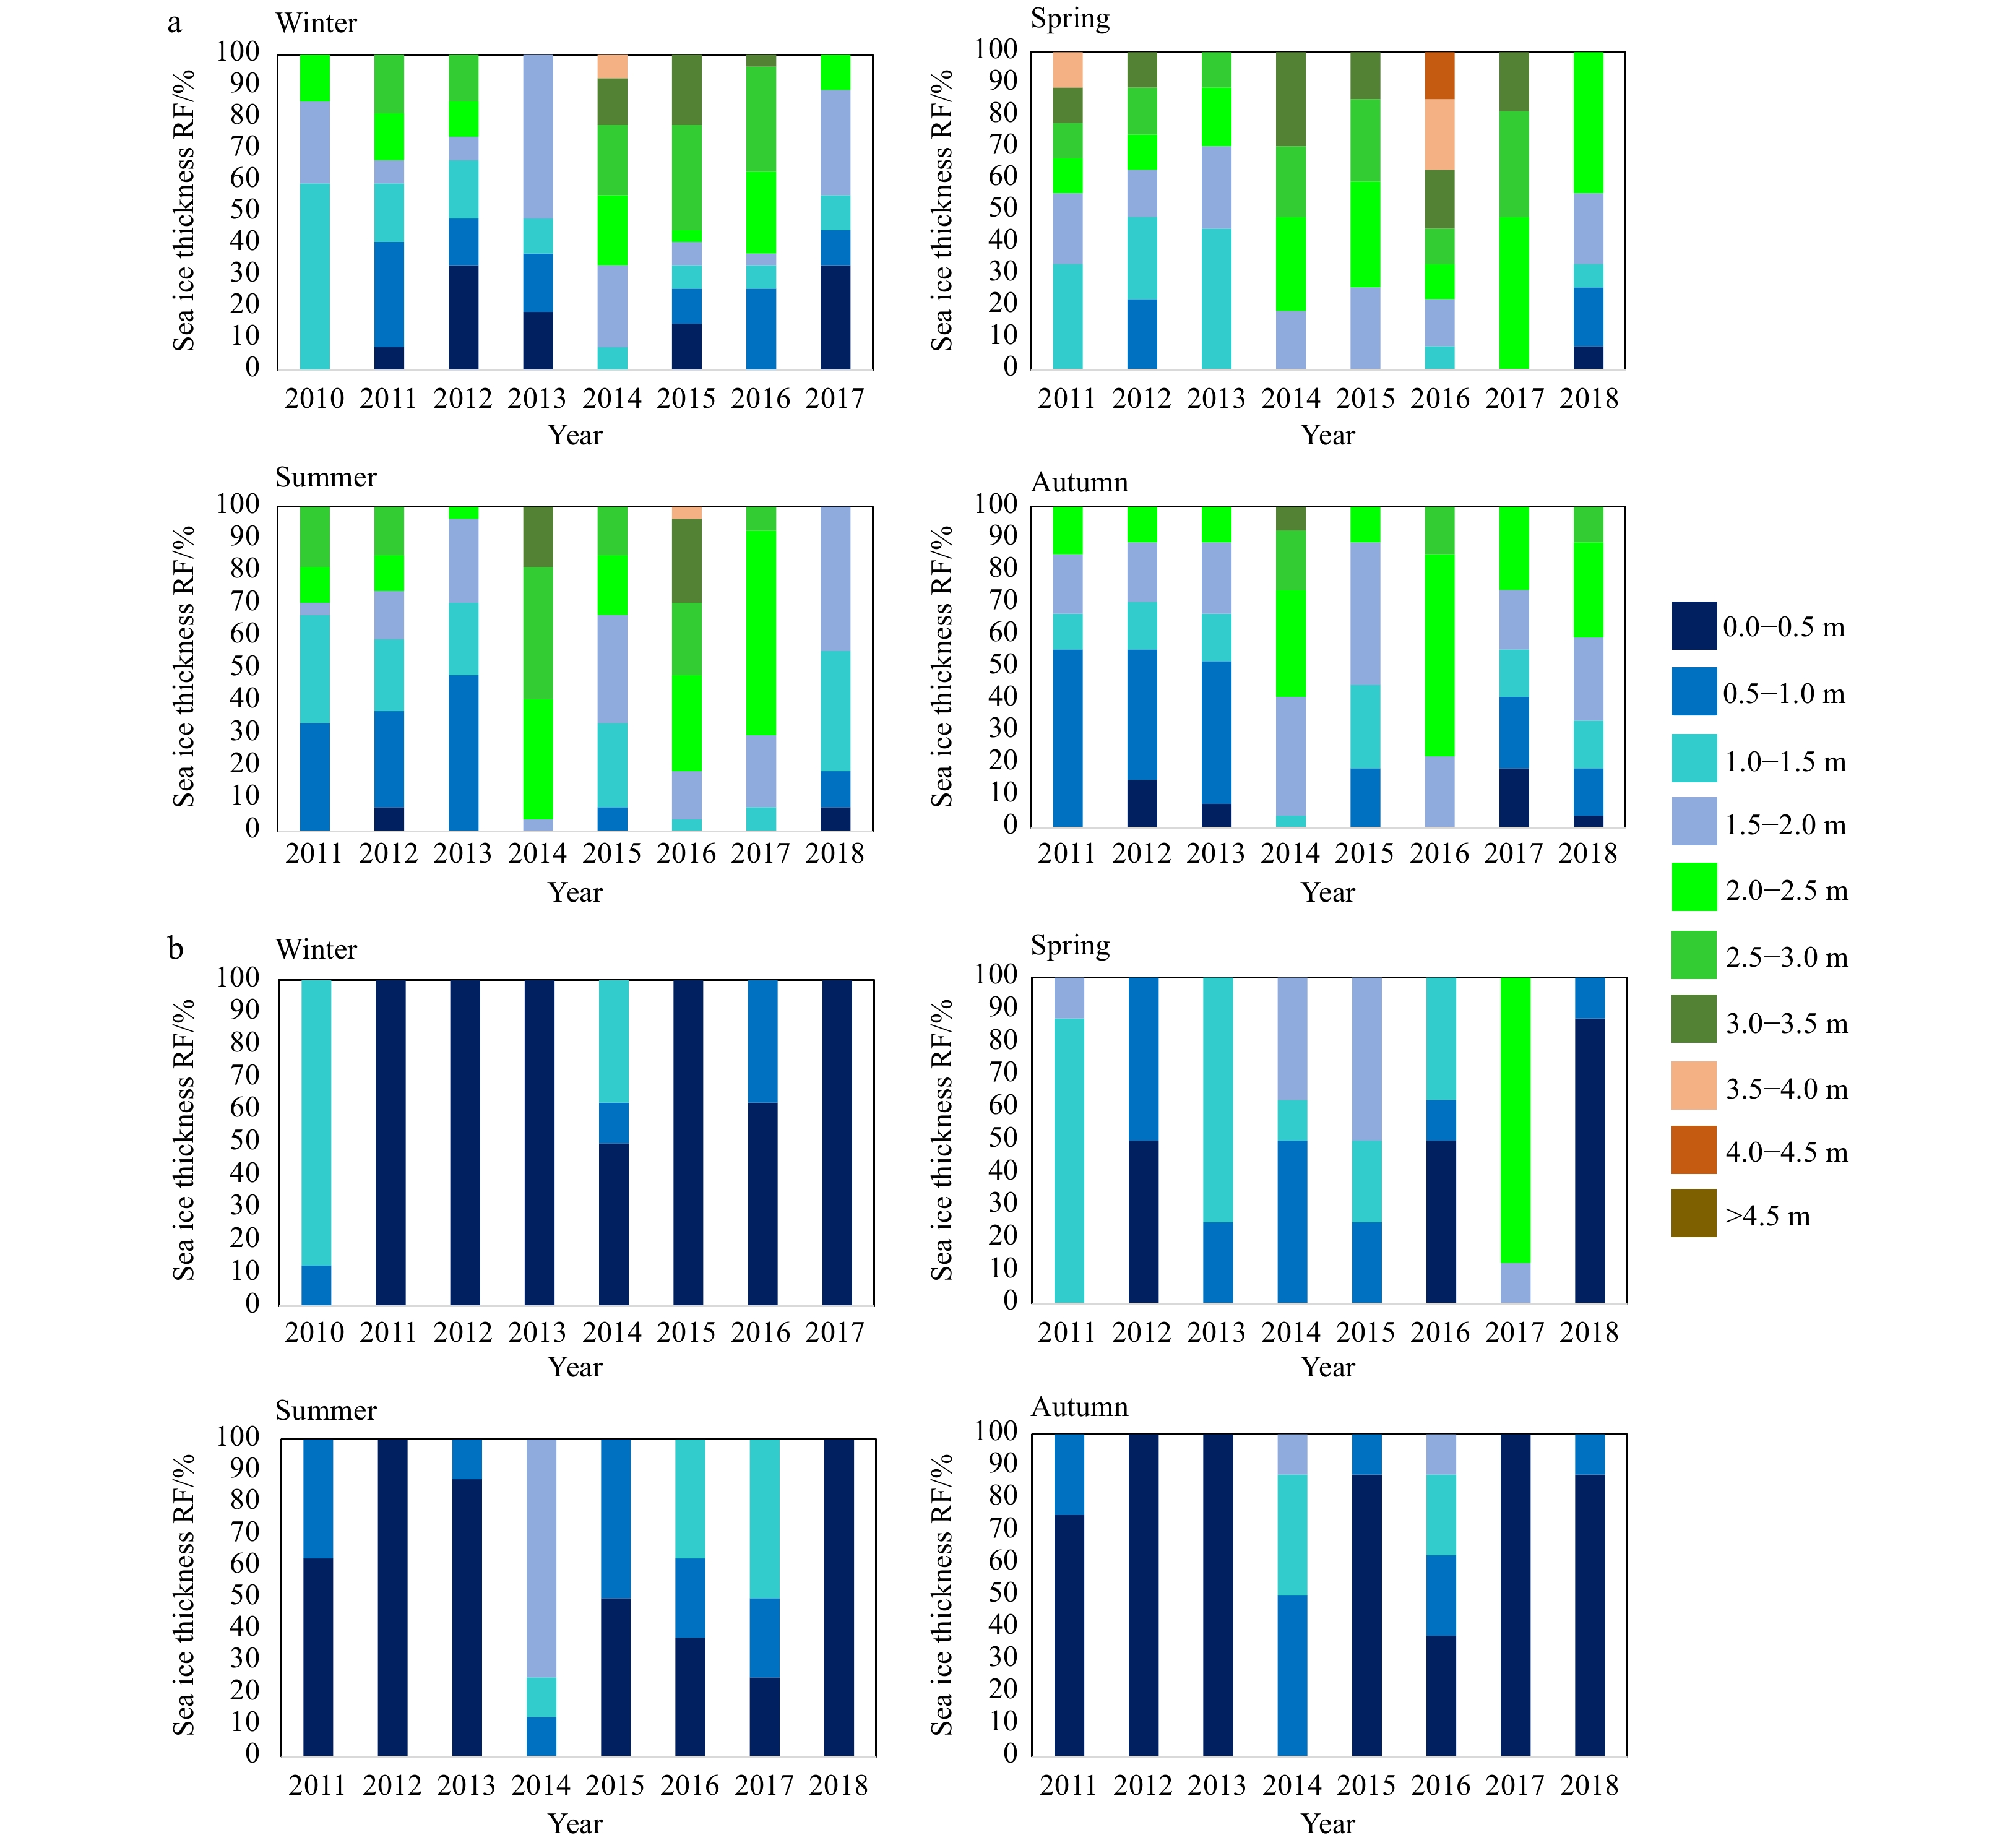
Figure 6. Seasonal variation in the relative frequency (RF) (%) of the sea ice thickness over the zonal gate (a) and meridional gate (b) of the Fram Strait from 2011 to 2018.
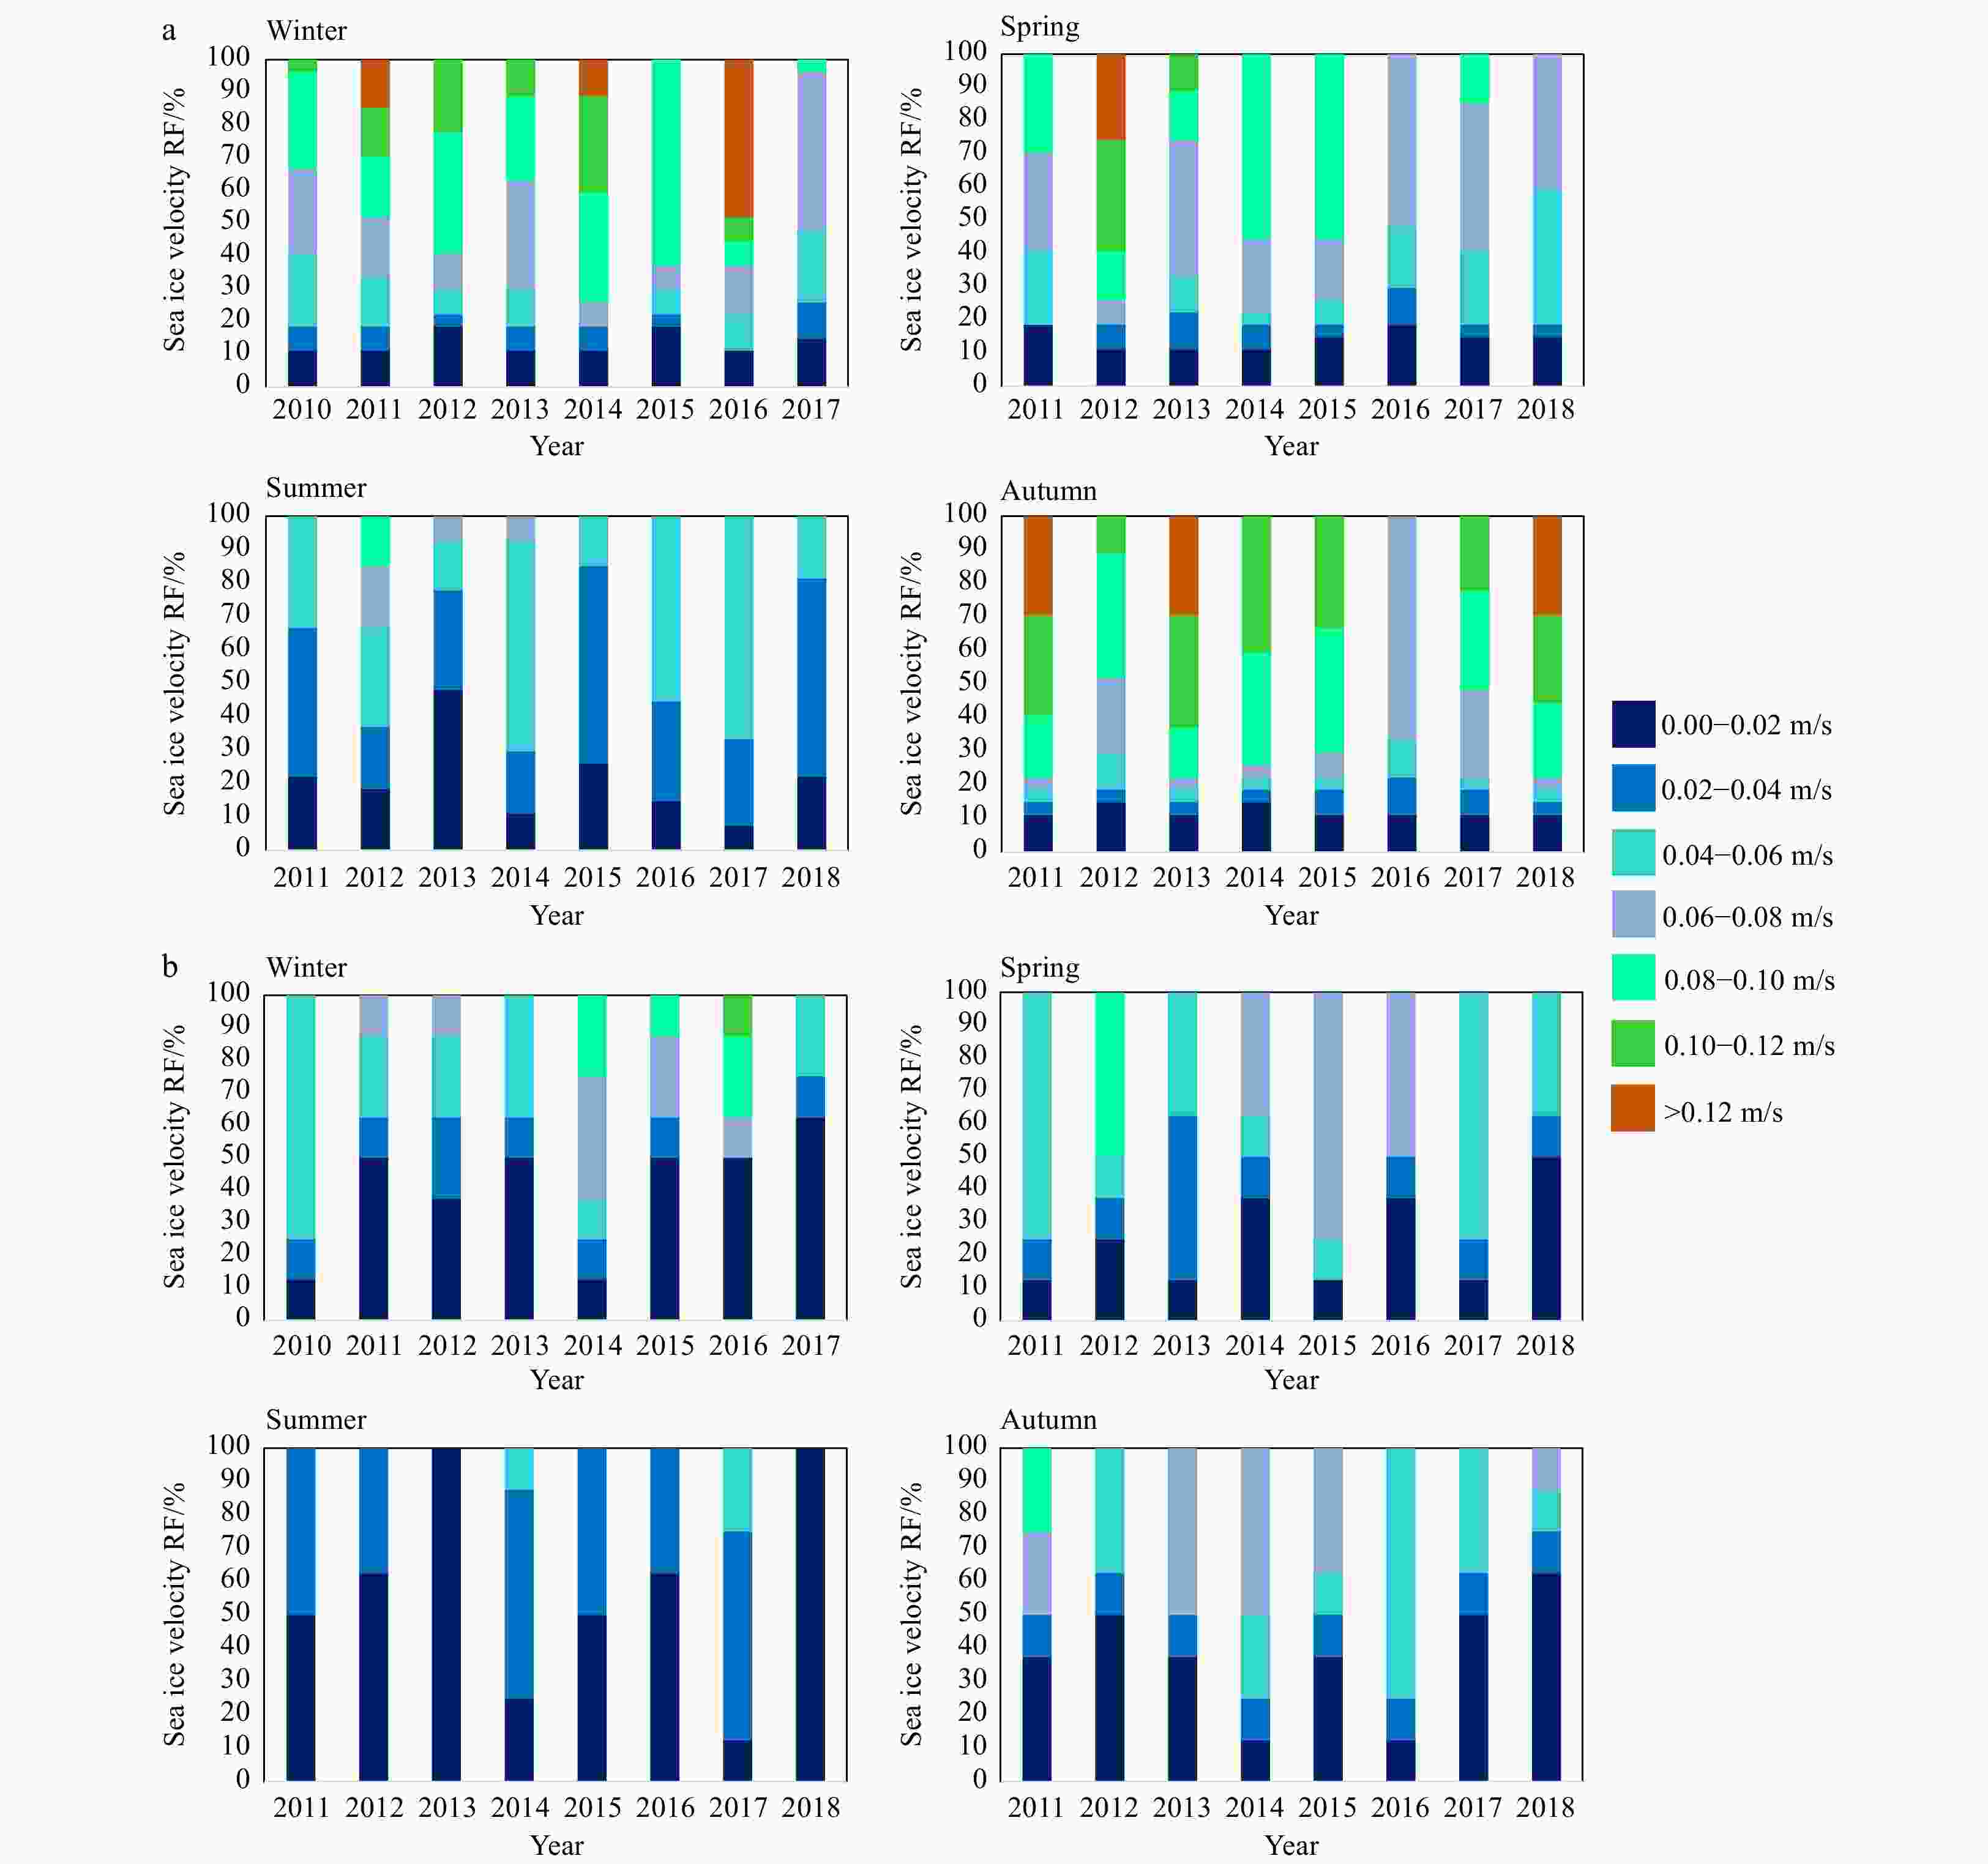
Figure 7. Seasonal variation in the relative frequency (RF) (%) of the sea ice velocity over the zonal gate (a) and meridional gate (b) of the Fram Strait from 2011 to 2018.
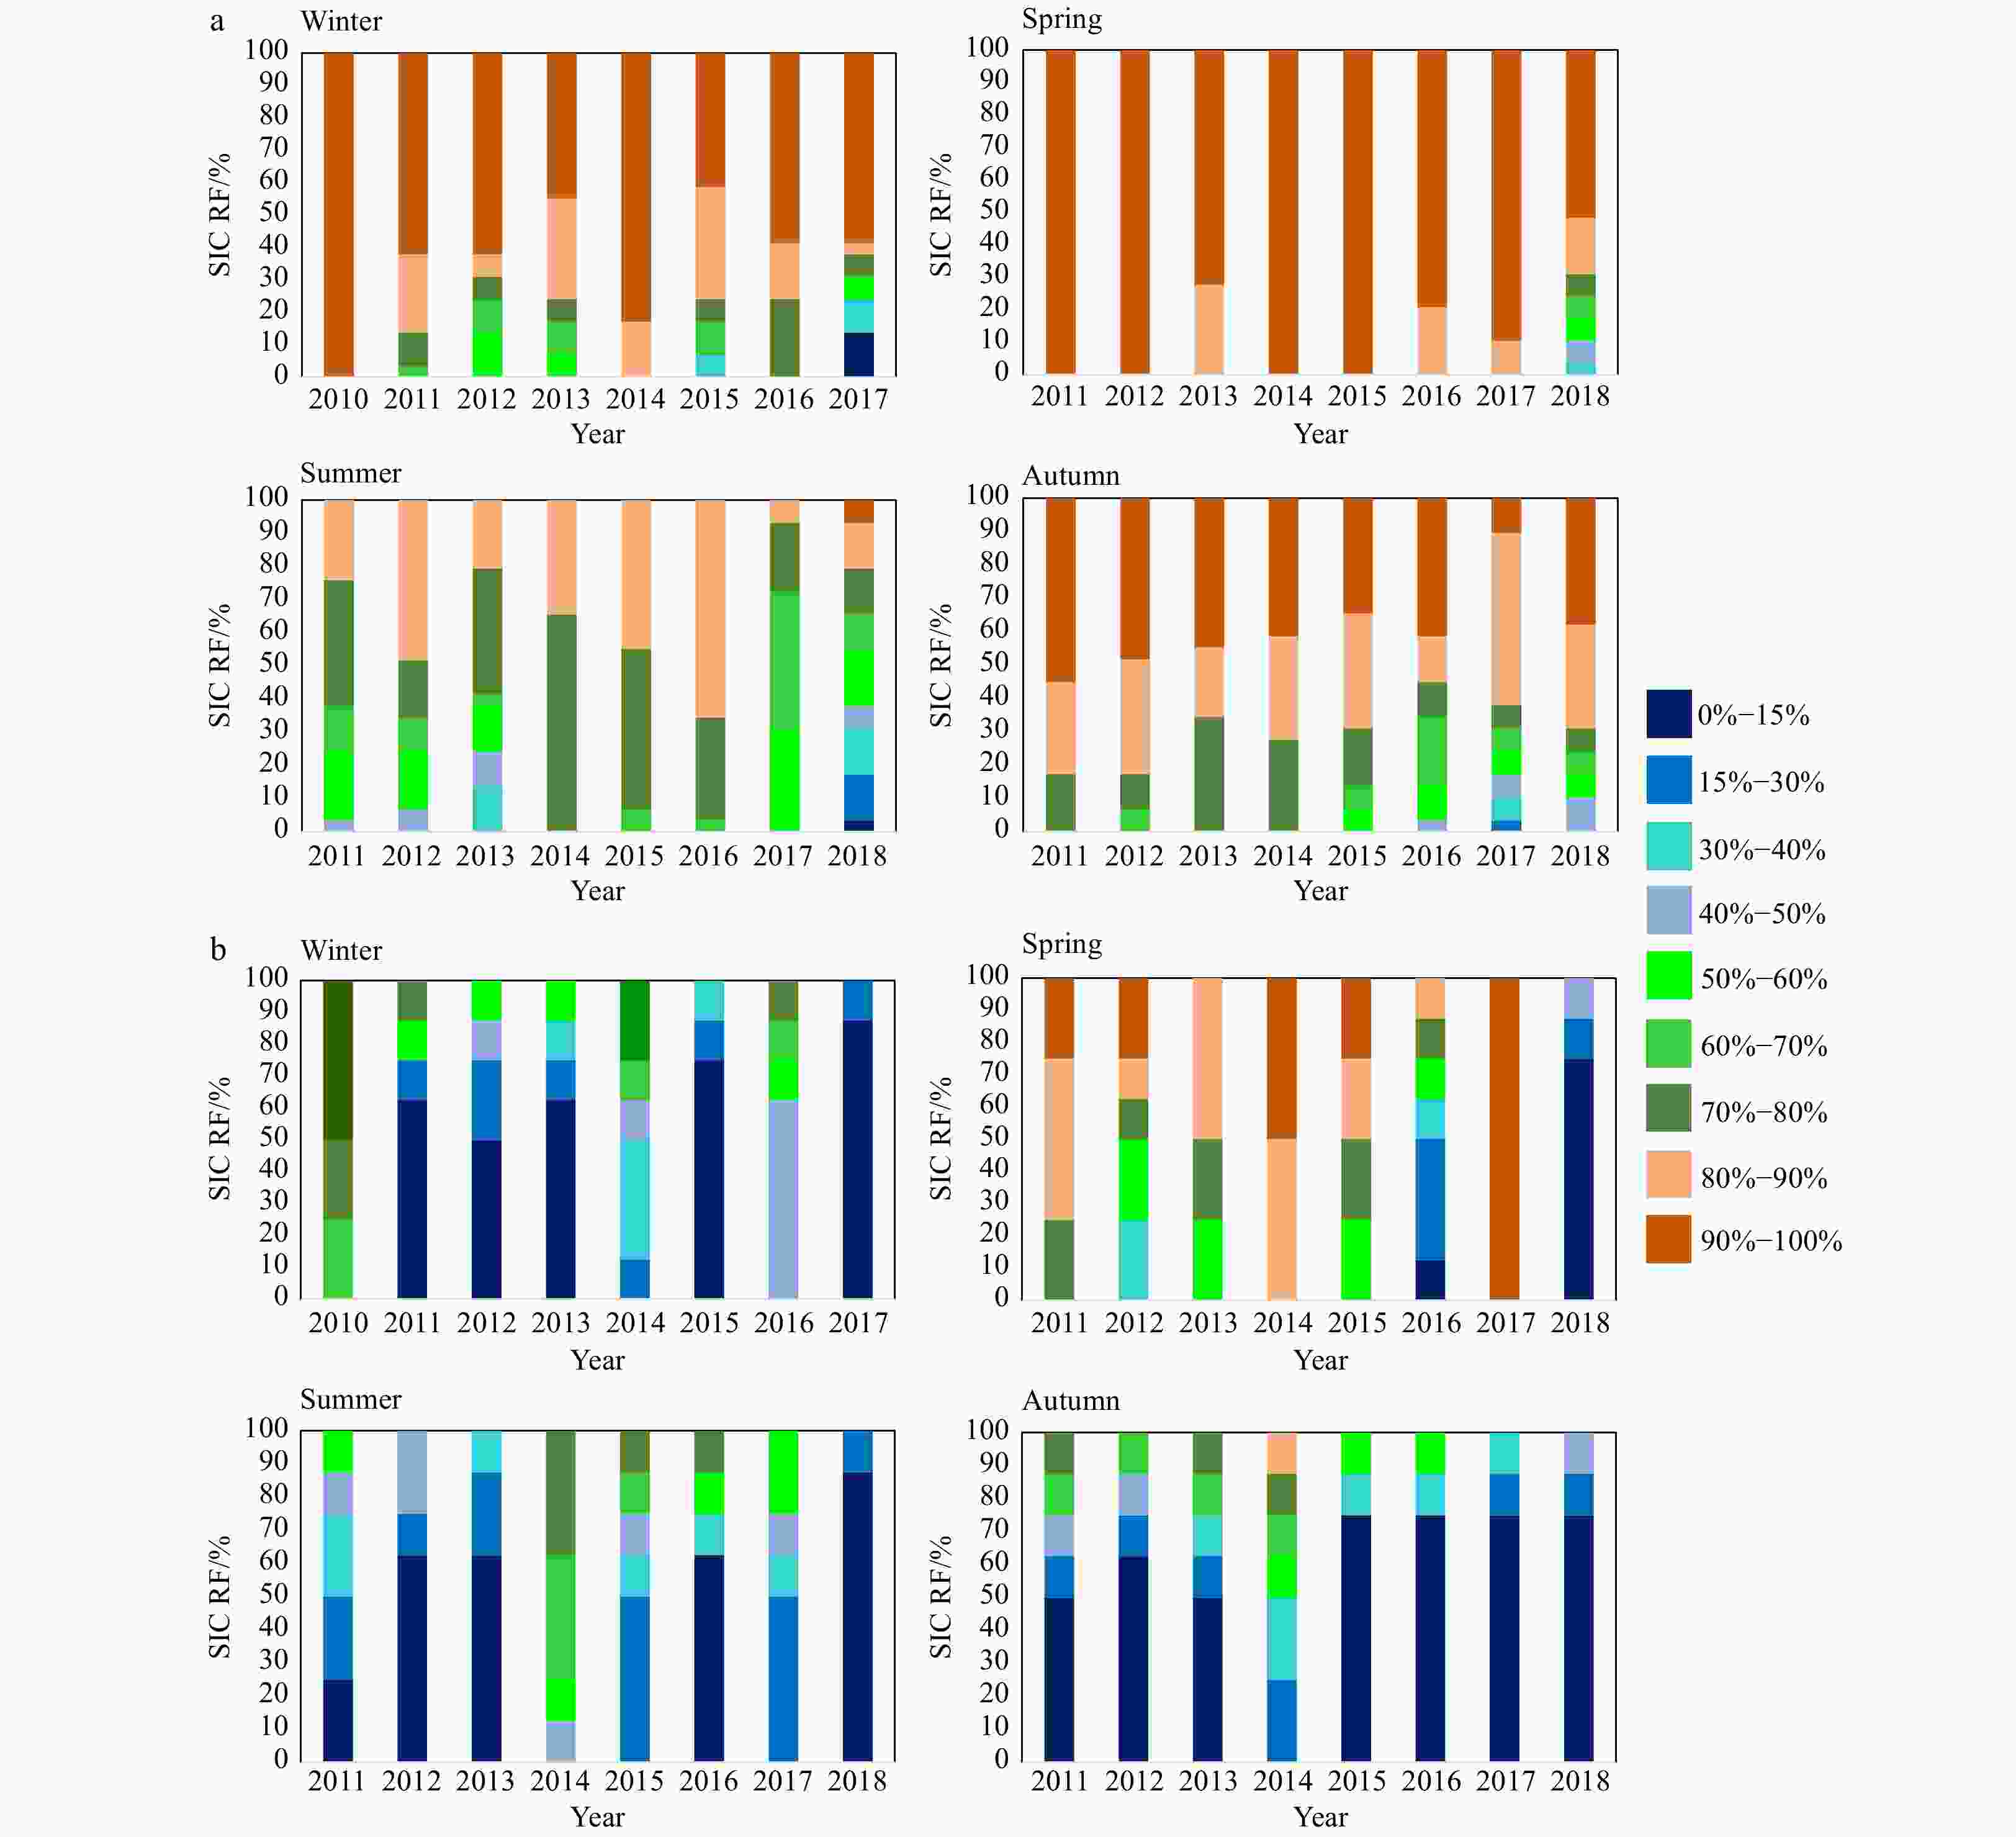
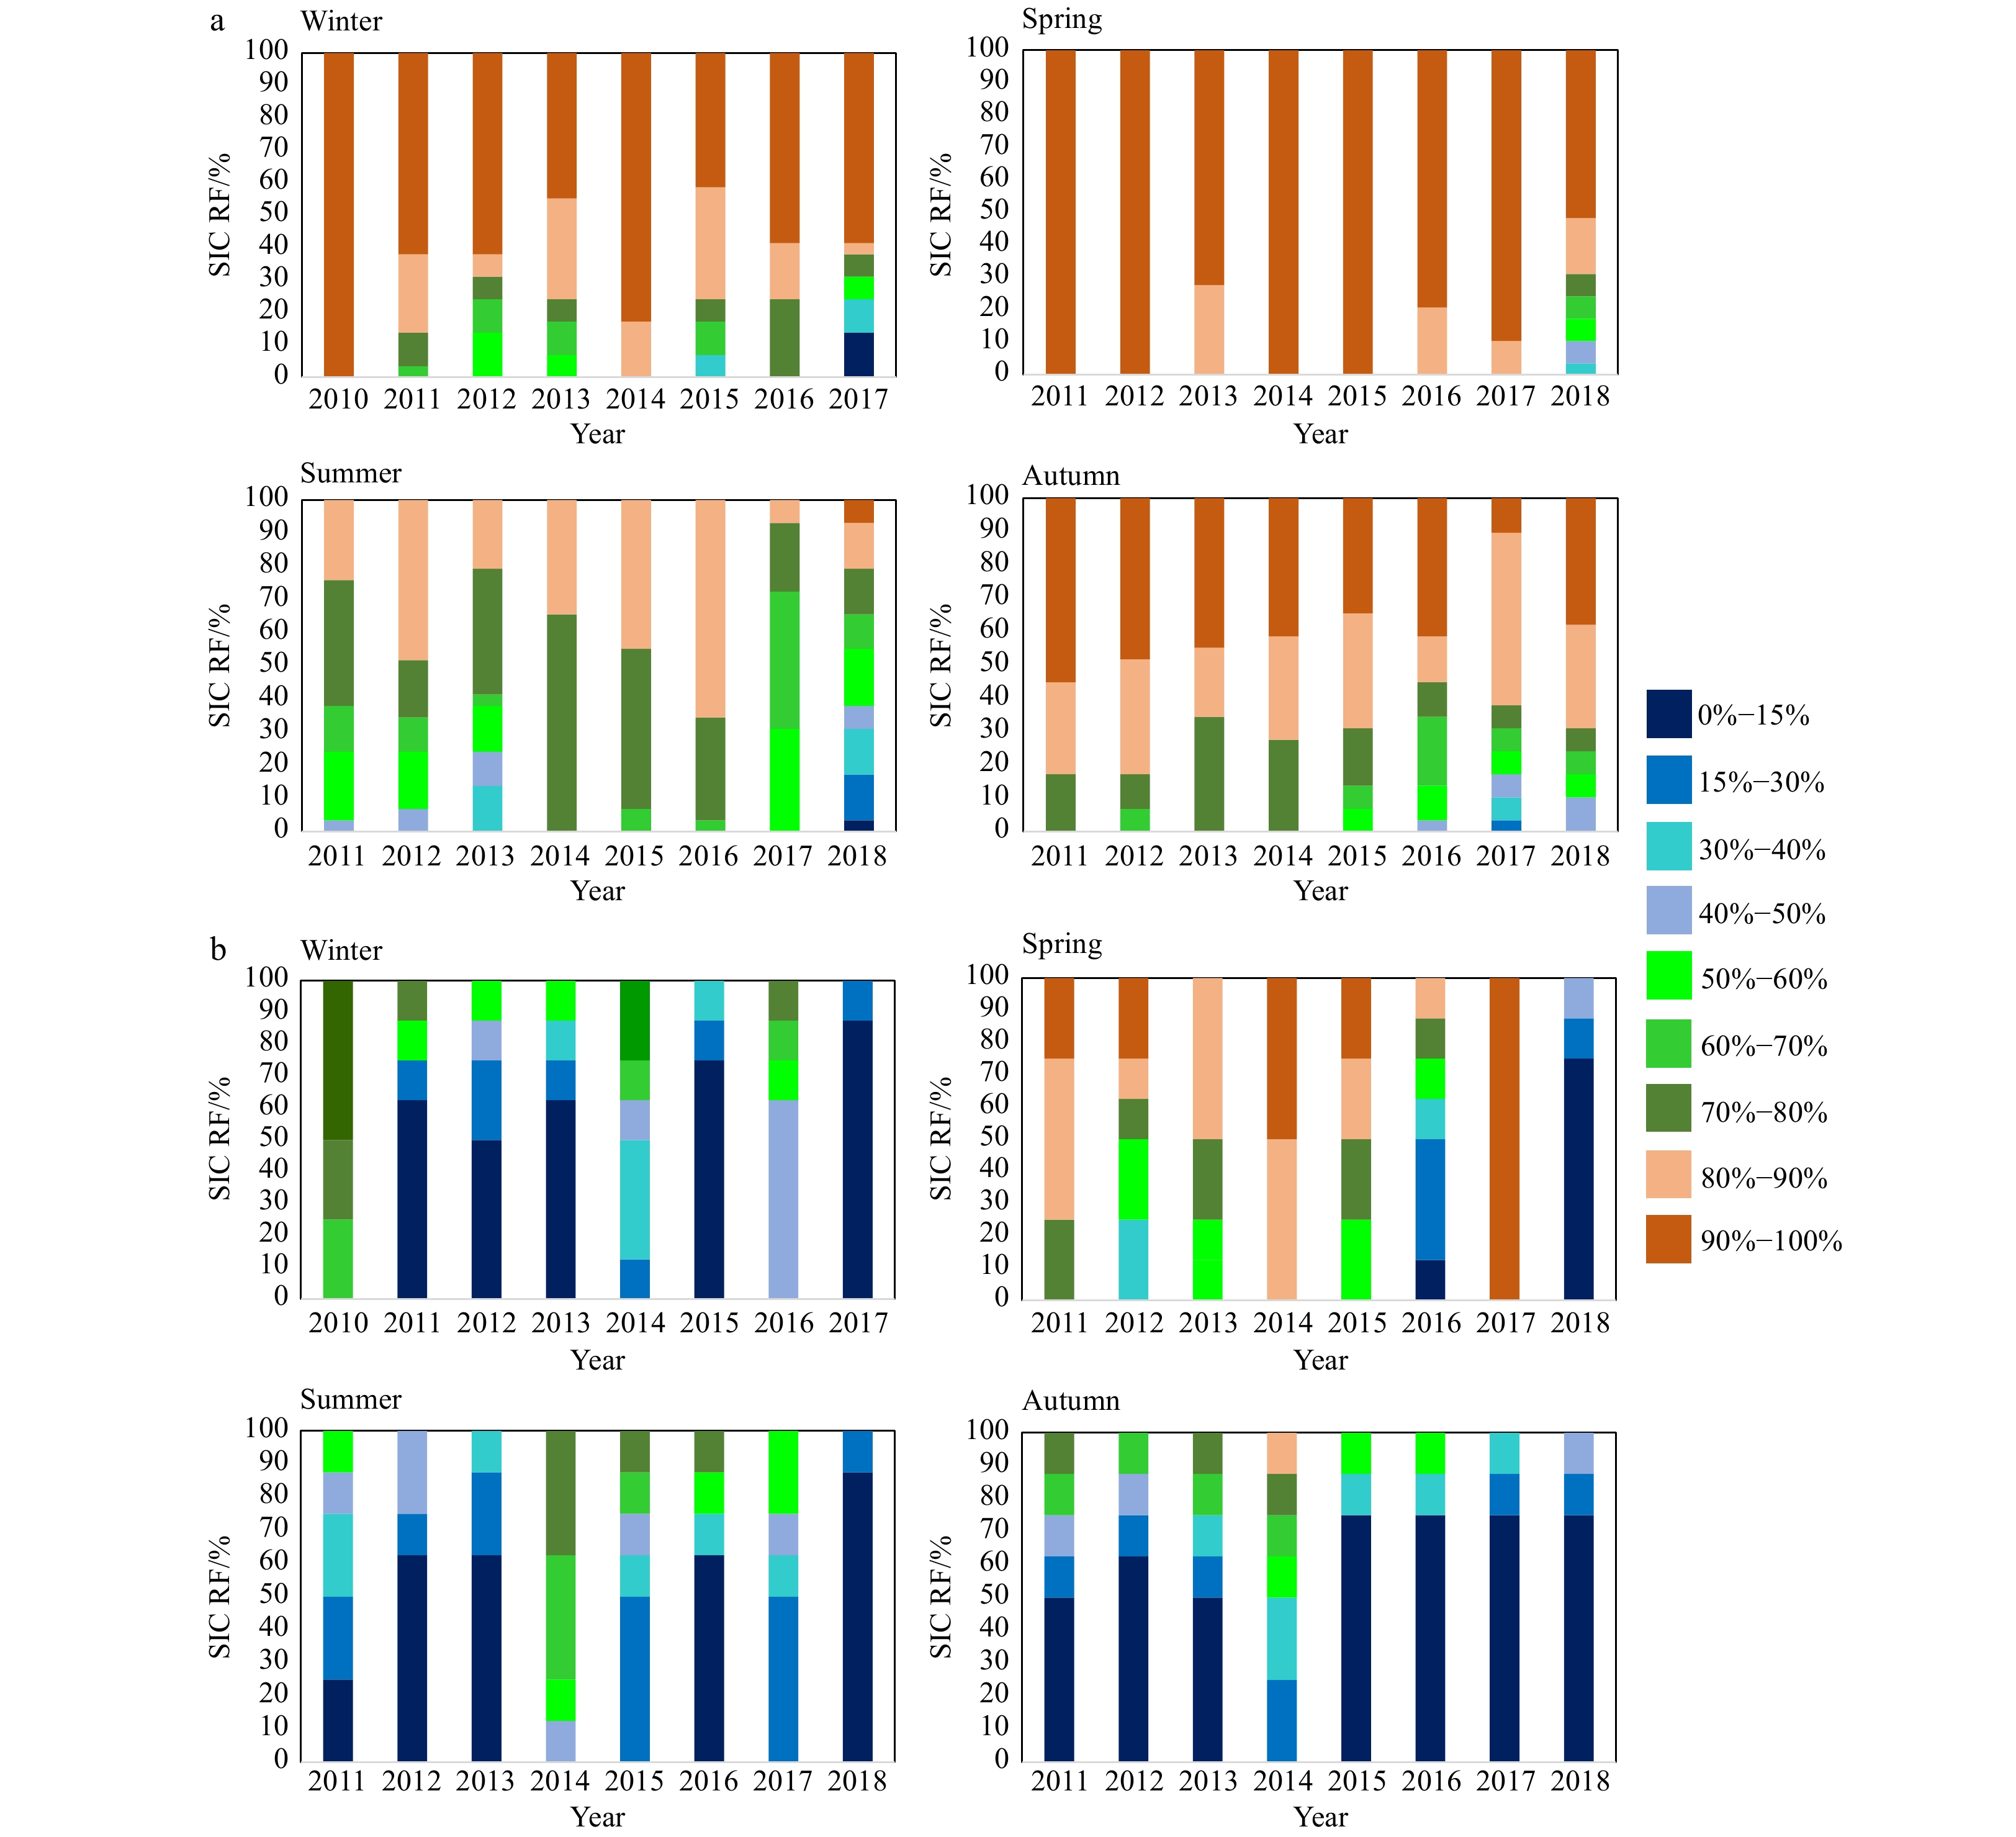
Figure 8. Seasonal variation in the relative frequency (RF) (%) of the sea ice concentration (SIC) over the zonal gate (a) and meridional gate (b) of the Fram Strait from 2011 to 2018.

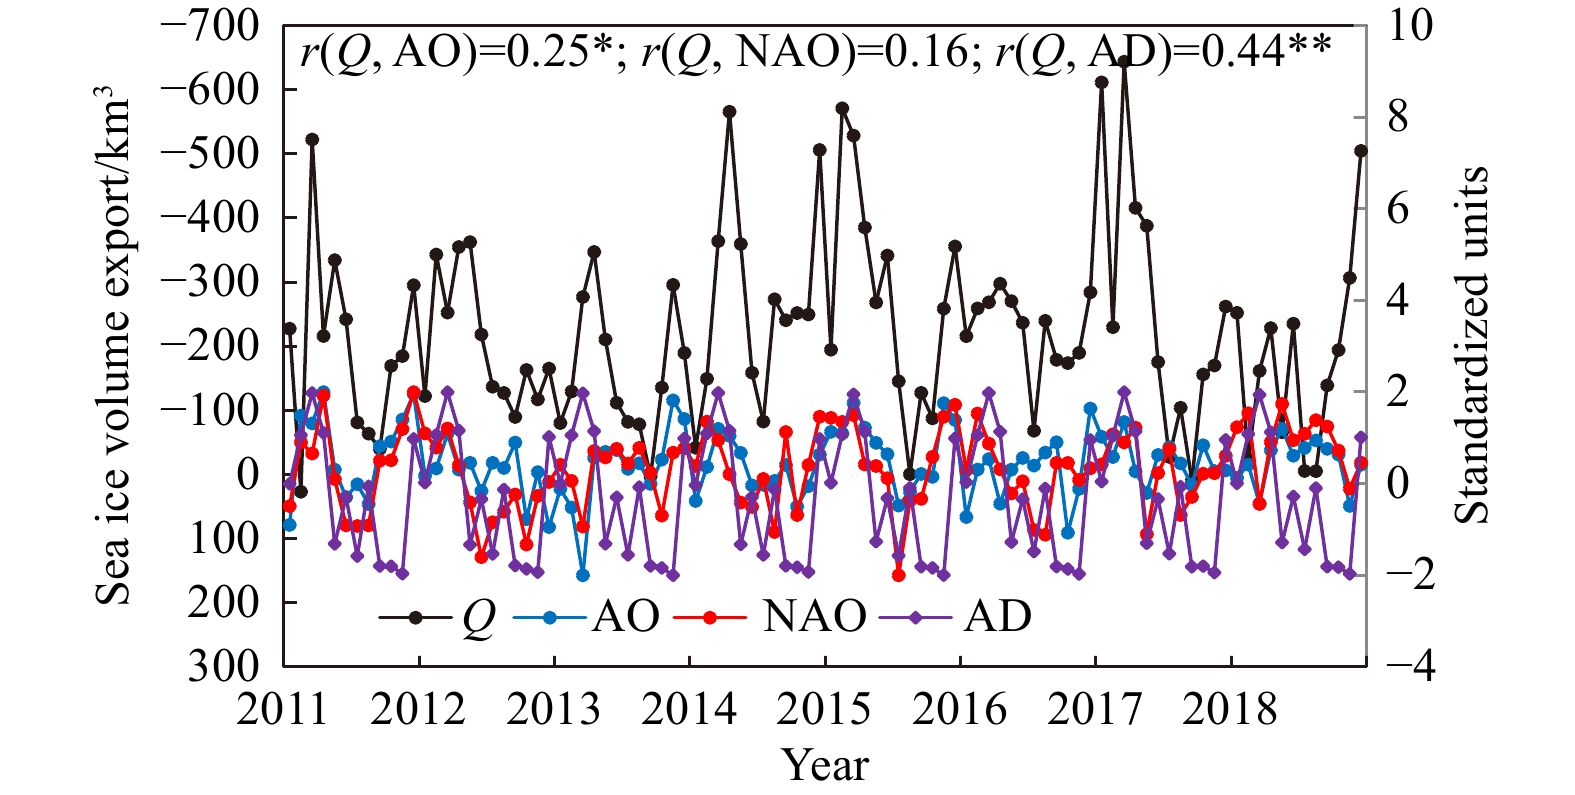
Figure 9. The monthly mean sea ice volume export (Q, black line) and the corresponding standardized mean monthly Arctic Oscillation (AO) (blue line), North Atlantic Oscillation (NAO) (red line) and Arctic Dipole (AD) (purple line) indices from 2011 to 2018, including the correlation coefficient (r). ** denotes p<0.01, * denotesp<0.05.
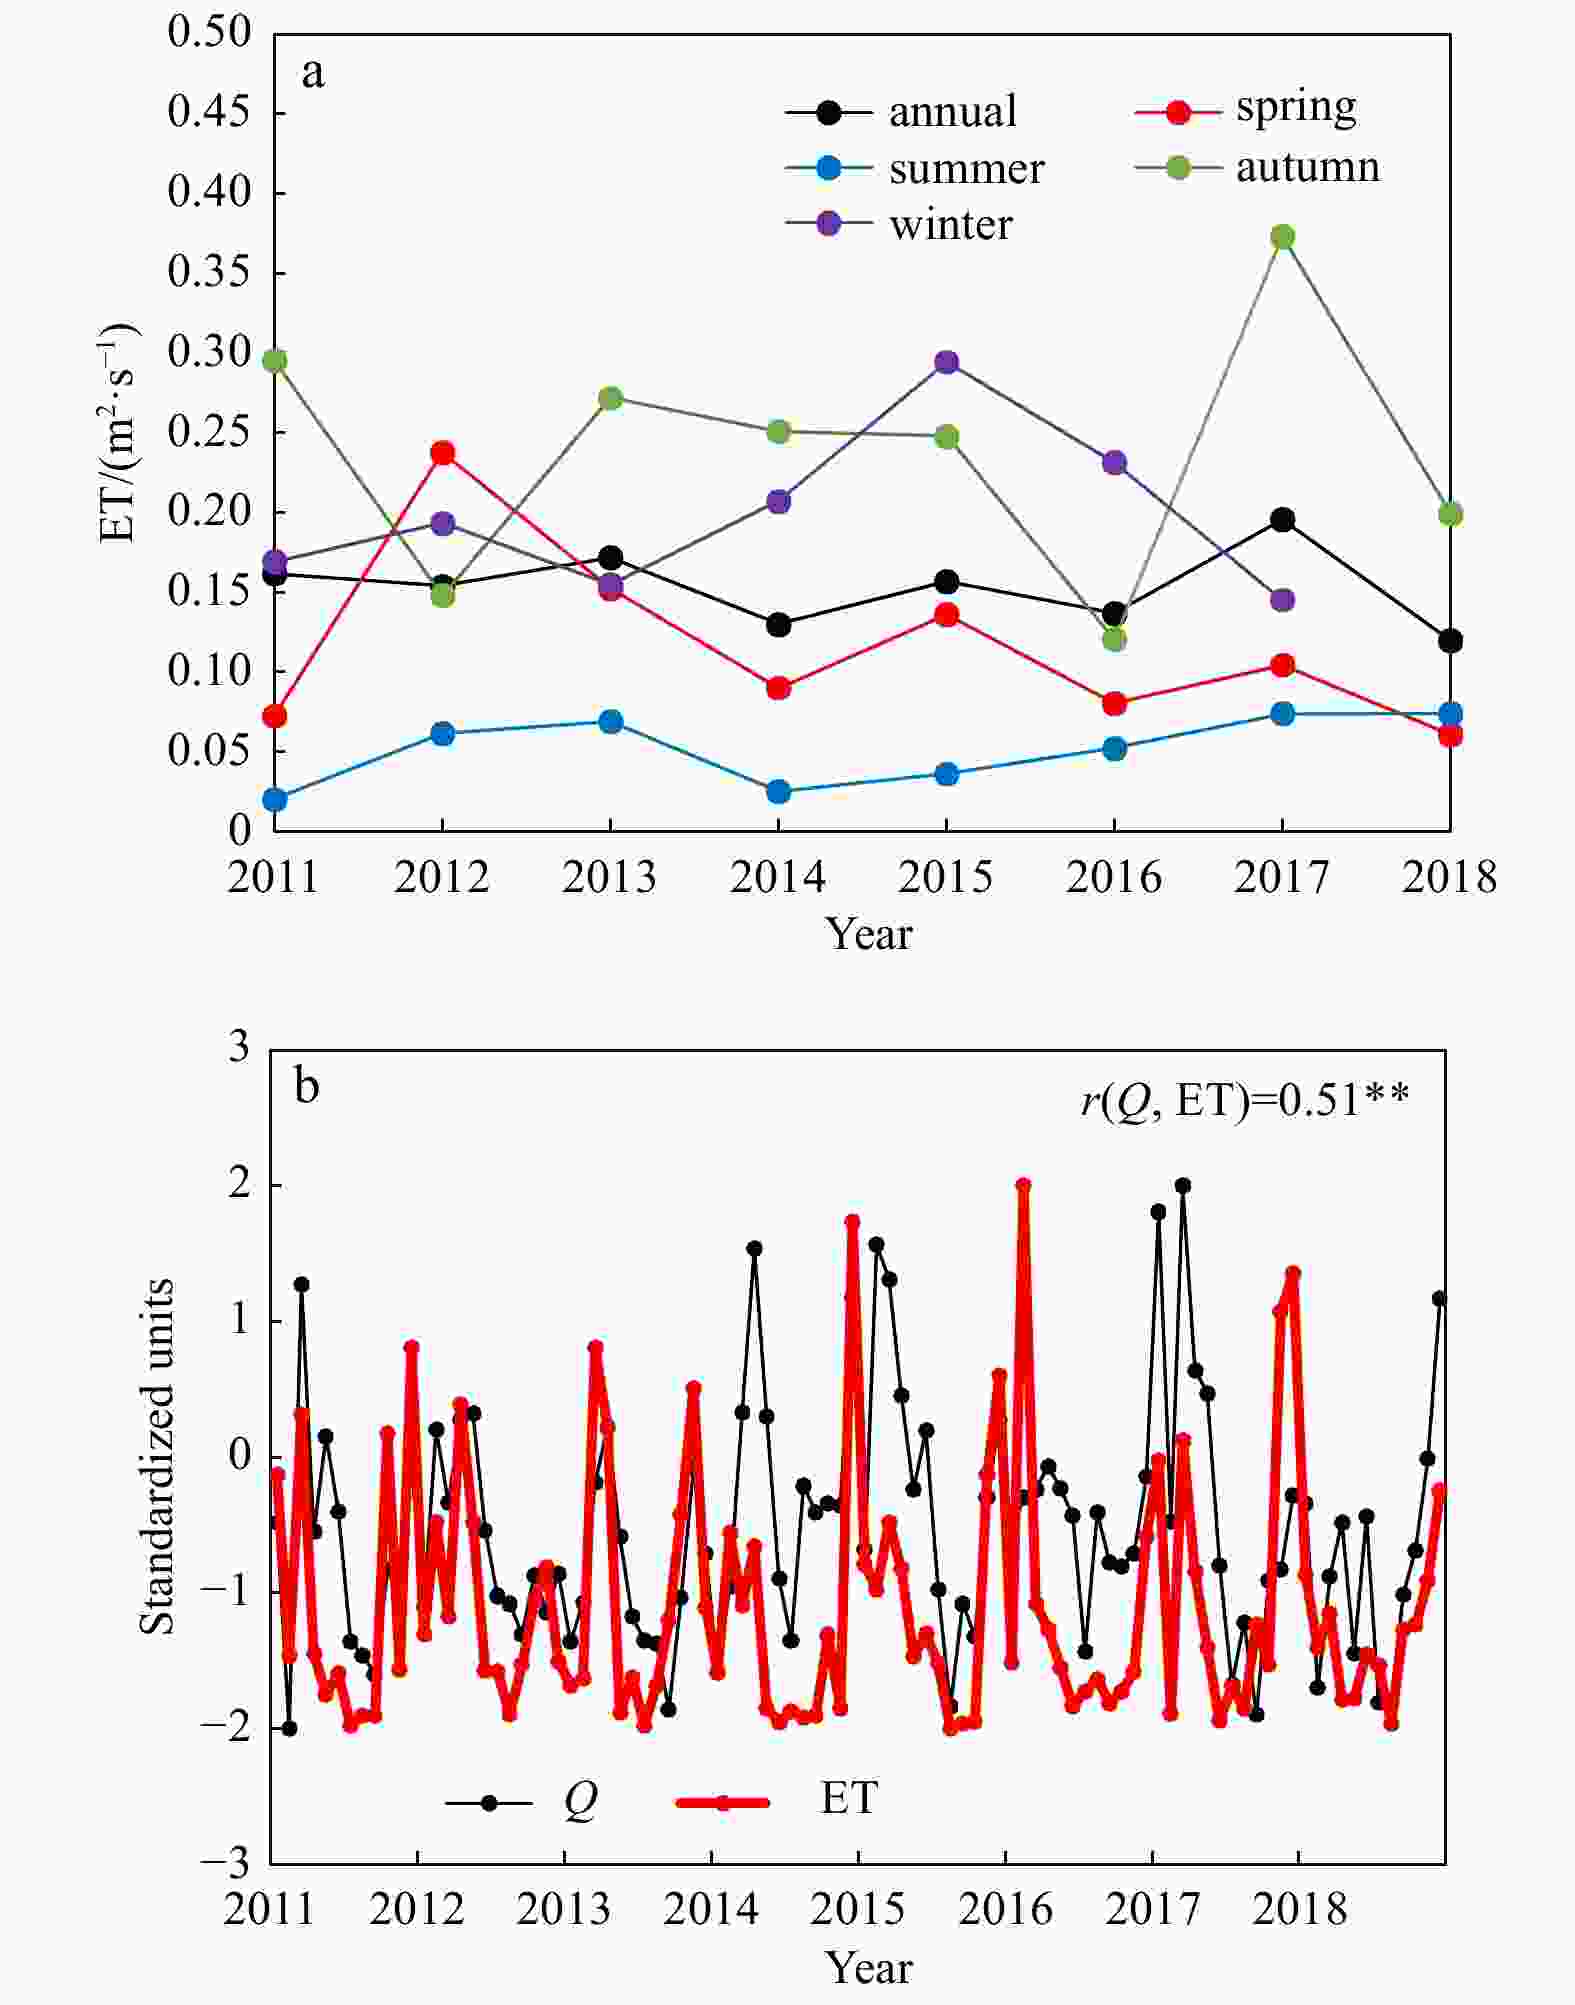
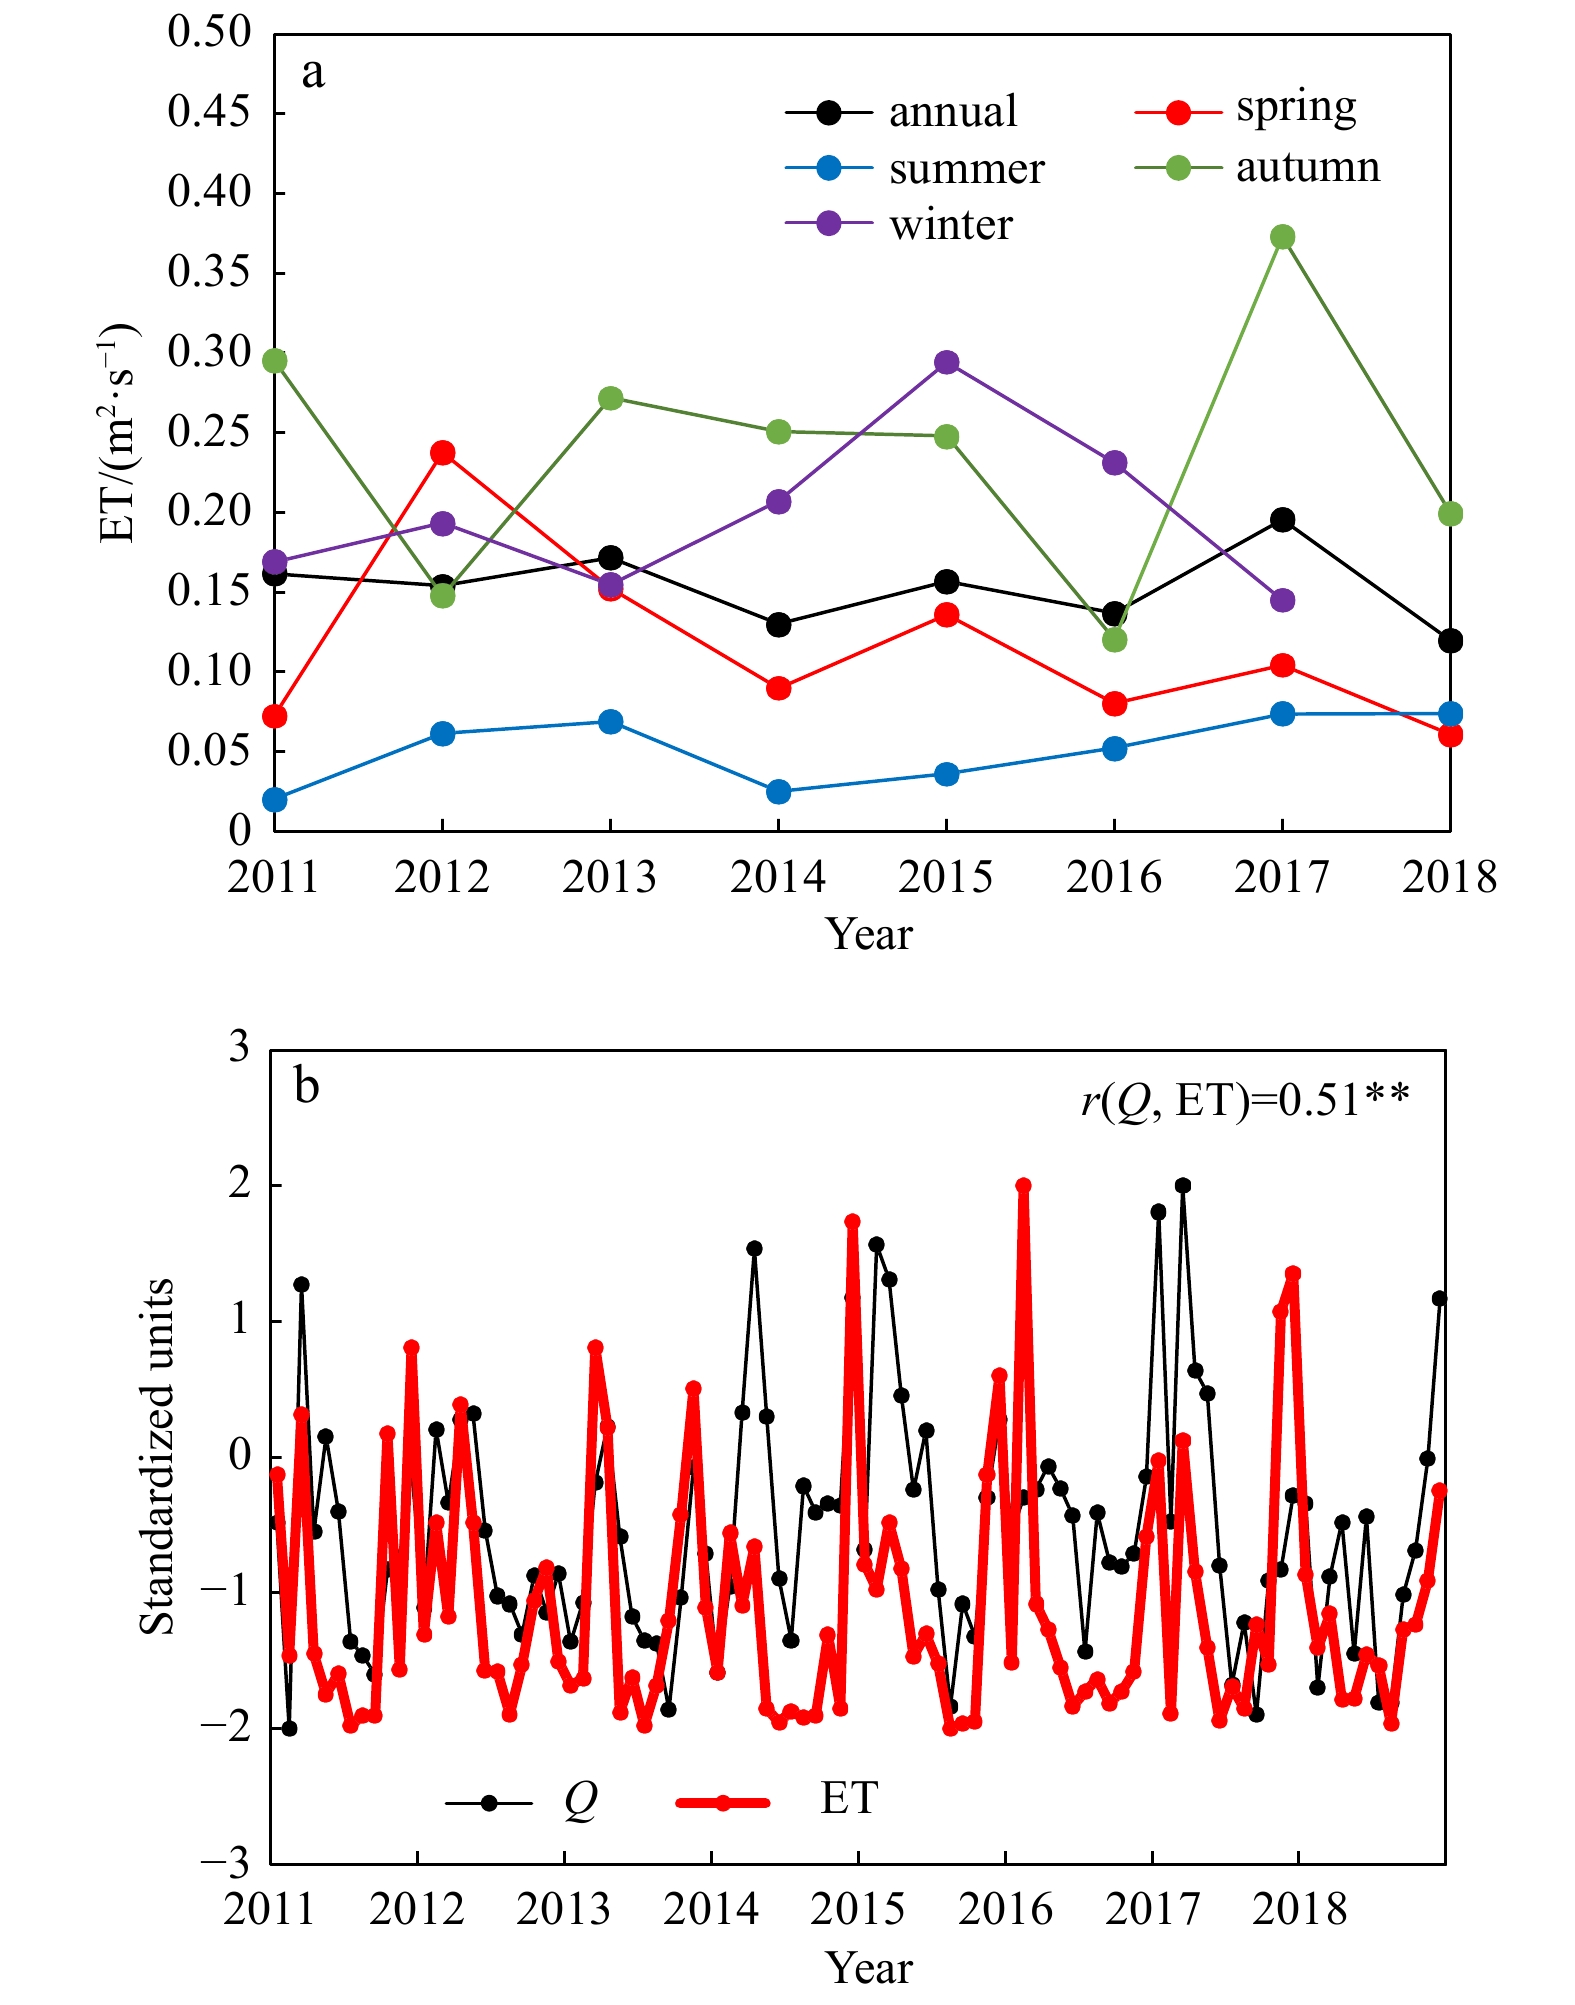
Figure 10. Changes in yearly and seasonally Ekman transport (ET) from 2011 to 2018 (a); the standardized monthly mean sea ice volume export (Q, black line) and the corresponding standardized mean monthly ET (red line) index from 2011 to 2018, including the correlation coefficient (r) (b). ** denotes p<0.01.
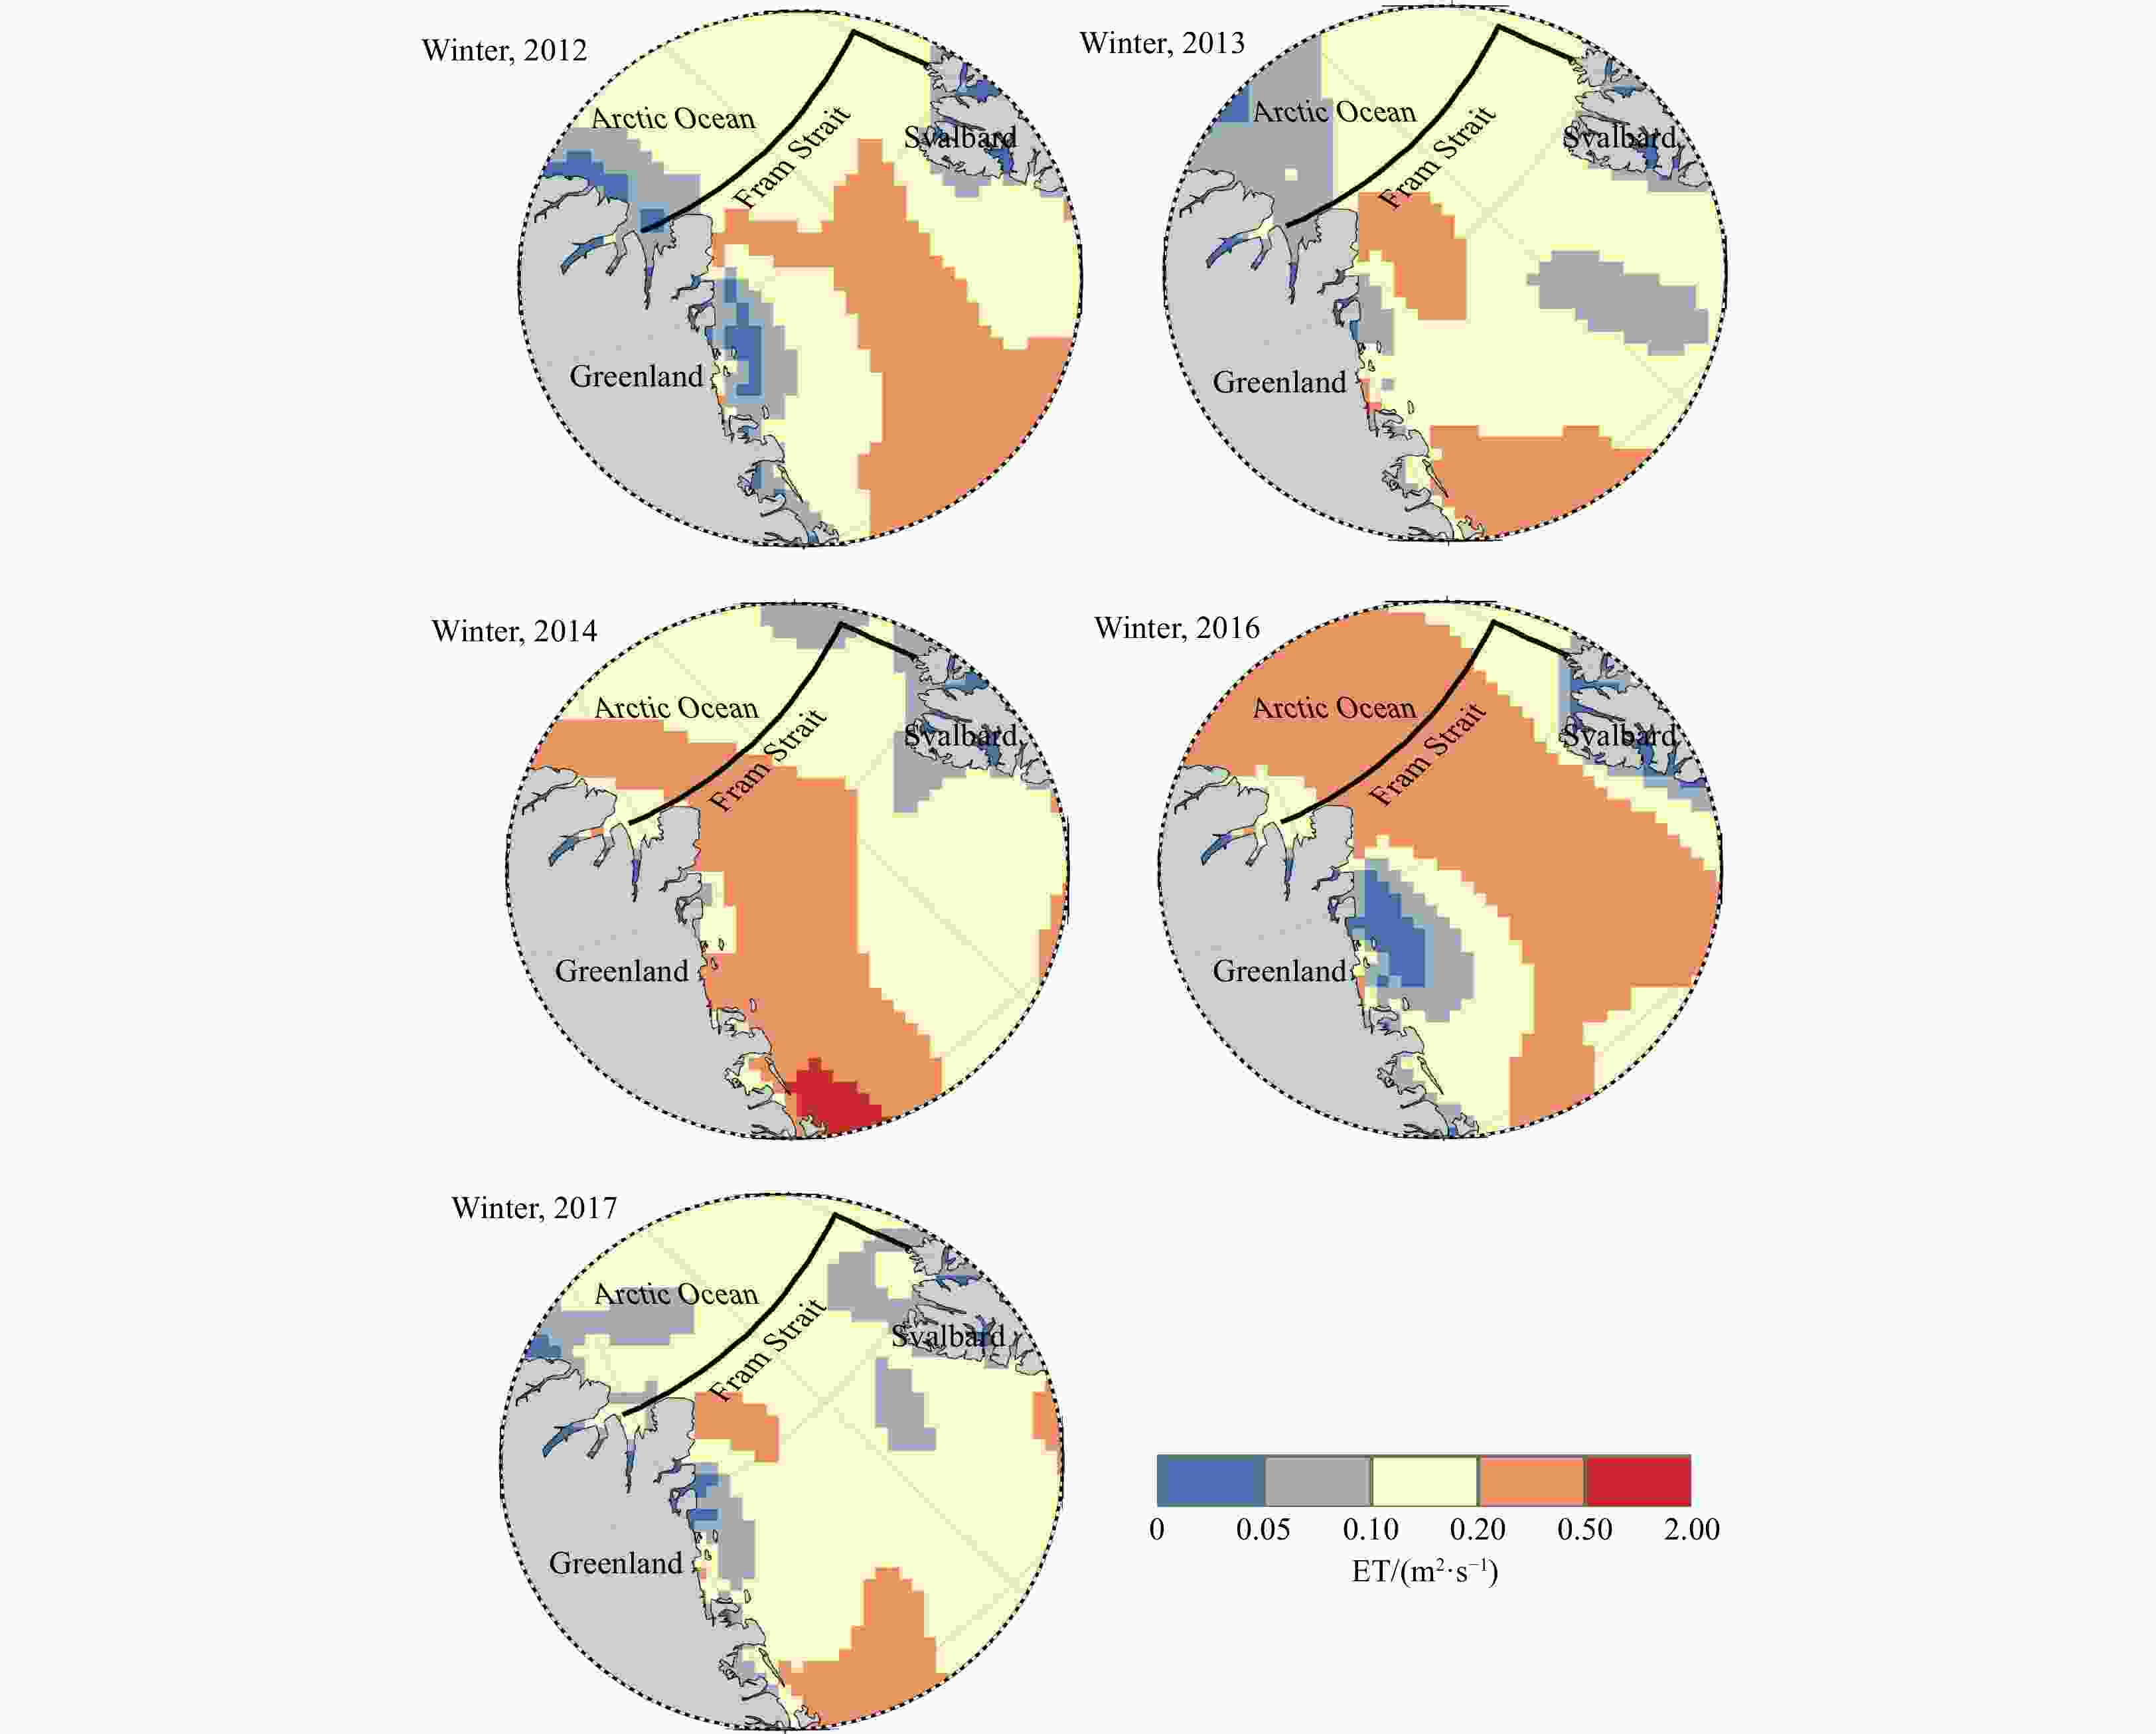
Figure 11. The spatial distribution of Ekman transport (ET) in the Fram Strait and its surrounding regions in winter 2012, 2013, 2014, 2016 and 2017.
Table 1. Monthly sea ice volume export (km3) from 2011 to 2018
2011 2012 2013 2014 2015 2016 2017 2018 Jan. −227.53 −122.42 −80.35 −41.85 −194.73 −215.87 −611.79 −252.26 Feb. 26.84 −343.20 −129.60 −149.29 −571.36 −259.18 −229.89 −24.00 Mar. −522.62 −252.66 −276.96 −364.08 −528.74 −268.73 −643.99 −161.75 Apr. −216.12 −354.94 −347.20 −565.98 −385.36 −297.74 −416.06 −228.46 May −334.43 −362.59 −210.71 −359.62 −268.48 −270.51 −388.01 −66.13 Jun. −242.20 −218.45 −112.01 −158.85 −341.68 −236.83 −175.53 −235.36 Jul. −81.29 −137.02 −82.21 −82.65 −145.51 −68.31 −27.57 −5.64 Aug. −63.81 −127.32 −78.40 −273.41 −0.53 −239.83 −104.25 −5.28 Sept. −40.05 −89.80 2.74 −240.72 −127.48 −178.92 9.42 −139.09 Oct. −169.52 −163.13 −135.72 −251.95 −87.66 −173.86 −156.18 −194.21 Nov. −184.85 −117.19 −295.88 −249.67 −258.80 −189.79 −170.10 −306.79 Dec. −295.35 −165.31 −189.71 −506.32 −355.86 −284.26 −262.04 −504.89 Note: The absolute of underlined font indicates the maximum in a year, and the absolute of bold font indicates the minimum in a year.  下载: 导出CSV
Table 2. Statistic of different studies for the sea ice volume export
This study Min et al. (2019) Kwok and Rothrock (1999) Kwok et al. (2004) Period 2011–2018 2011–2016 2011–2016 1991–1995 1991–1998 Average volume flux/km3 −2 096/−1 299 −2 226/−1 374 −2 303/−1 352 −2 506 −2 218 Note: The underlined font indicates the sea ice volume export through the gate A, and the bold font indicates the sea ice volume export through the gate B (~79°N gate). The listed volume flux represents the average volume flux during the corresponding study period.
下载: 导出CSV
Table 3. Mean and relative standard deviation (RSD) of the sea ice thickness, sea ice velocity and sea ice concentration
Ice thickness Ice velocity Ice concentration Mean 1.20 m 0.08 m/s 60.50% RSD 0.10 0.49 0.12
下载: 导出CSV
Table 4. The multiple general linear model (GLM) analysis on the relationship between the sea ice volume export and three impact factors (Arctic Dipole (AD), ArcticOscillation (AO) and Ekman transport (ET))
AD AO ET Residuals MS 392 605 42 498 279 708 14 075 SS/% 53.86*** 5.83 38.37*** 1.93 Note: *** denotes p<0.001; MS: mean squares.
下载: 导出CSV
-
Babb D G, Galley R J, Asplin M G, et al. 2013. Multiyear sea ice export through the Bering Strait during winter 2011–2012. Journal of Geophysical Research: Oceans, 118(10): 5489–5503. doi: 10.1002/jgrc.20383 Bi Haibo, Sun Ke, Zhou Xuan, et al. 2016. Arctic sea ice area export through the fram strait estimated from satellite-based data: 1988–2012. IEEE Journal of Selected Topics in Applied Earth Observations and Remote Sensing, 9(7): 3144–3157. doi: 10.1109/JSTARS.2016.2584539 Bi Haibo, Wang Yunhe, Zhang Wenfeng, et al. 2018a. Recent satellite-derived sea ice volume flux through the Fram Strait: 2011–2015. Acta Oceanologica Sinica, 37(9): 107–115. doi: 10.1007/s13131-018-1270-9 Bi Haibo, Yang Qinghua, Liang Yu, et al. 2018b. A review of Arctic sea ice export. Marine Sciences (in Chinese), 42(10): 110–124 Boé J, Hall A, Qu Xin. 2009. September sea-ice cover in the Arctic Ocean projected to vanish by 2100. Nature Geoscience, 2(5): 341–343. doi: 10.1038/ngeo467 Butterworth B J, Miller S D. 2016. Air-sea exchange of carbon dioxide in the Southern Ocean and Antarctic marginal ice zone. Geophysical Research Letters, 43(13): 7223–7230. doi: 10.1002/2016GL069581 Cavalieri D J, Crawford J, Drinkwater M R, et al. 1992. NASA sea ice validation program for the DMSP SSM/I: final report. NASA Technical Memorandum 104559. Washington: National Aeronautics and Space Administration, 126 CMEMS. 2020. Product user manual for Arctic Ocean physical and bio analysis and forecasting products. https://marine.copernicus.eu/sites/default/files/product_improvement_migrated_files/CMEMS-ARC-PUM-002-ALL.pdf[2020-02-15/2021-08-27] Comiso J C, Meier W N, Gersten R. 2017. Variability and trends in the Arctic Sea ice cover: Results from different techniques. Journal of Geophysical Research: Oceans, 122(8): 6883–6900. doi: 10.1002/2017JC012768 Dang Xiaoyan, Bai Yan, Gong Fang, et al. 2022. Different responses of phytoplankton to the ENSO in two upwelling systems of the south China Sea. Estuaries and Coasts, 45(2): 485–500. doi: 10.1007/s12237-021-00987-2 DeRepentigny P, Jahn A, Holland M M, et al. 2020. Arctic sea ice in two configurations of the CESM2 during the 20th and 21st centuries. Journal of Geophysical Research: Oceans, 125(9): e2020JC016133 Fujiwara A, Hirawake T, Suzuki K, et al. 2014. Timing of sea ice retreat can alter phytoplankton community structure in the western Arctic Ocean. Biogeosciences, 11(7): 1705–1716. doi: 10.5194/bg-11-1705-2014 Geyer F, Fer I, Eldevik T. 2009. Dense overflow from an Arctic fjord: Mean seasonal cycle, variability and wind influence. Continental Shelf Research, 29(17): 2110–2121. doi: 10.1016/j.csr.2009.08.003 Halpern D. 2002. Offshore Ekman transport and Ekman pumping off Peru during the 1997–1998 El Niño. Geophysical Research Letters, 29(5): 1075 Hilmer M, Jung T. 2000. Evidence for a recent change in the link between the North Atlantic Oscillation and Arctic sea ice export. Geophysical Research Letters, 27(7): 989–992. doi: 10.1029/1999GL010944 Hurrell J W. 2005. North Atlantic Oscillation. In: Oliver J E, ed. Encyclopedia of World Climatology. Dordrecht: Springer, 536–539 Ikeda M. 2009. Mechanisms of the recent sea ice decay in the Arctic Ocean related to the Pacific-to-Atlantic pathway. In: Nihoul J C J, Kostianoy A G, eds. Influence of Climate Change on the Changing Arctic and Sub-Arctic Conditions. Dordrecht: Springer, 161–169 IPCC. 2019. IPCC special report on the ocean and cryosphere in a changing climate. https://www.ipcc.ch/site/assets/uploads/sites/3/2022/03/SROCC_Citations_FINAL.pdf[2020-06-27] Jung T, Hilmer M. 2001. The link between the North Atlantic Oscillation and Arctic sea ice export through Fram Strait. Journal of Climate, 14(19): 3932–3943. doi: 10.1175/1520-0442(2001)014<3932:TLBTNA>2.0.CO;2 Ke Changqing, Peng Haitao, Sun Bo, et al. 2013. Spatio-temporal variability of Arctic sea ice from 2002 to 2011. Journal of Remote Sensing (in Chinese), 17(2): 459–466, 452–458 Krumpen T, Gerdes R, Haas C, et al. 2016. Recent summer sea ice thickness surveys in Fram Strait and associated ice volume fluxes. The Cryosphere, 10(2): 523–534. doi: 10.5194/tc-10-523-2016 Kwok R. 2009. Outflow of Arctic Ocean Sea Ice into the Greenland and Barents Seas: 1979–2007. Journal of Climate, 22(9): 2438–2457. doi: 10.1175/2008JCLI2819.1 Kwok R, Cunningham G F, Pang S S. 2004. Fram Strait sea ice outflow. Journal of Geophysical Research: Oceans, 109(C1): C01009 Kwok R, Rothrock D A. 1999. Variability of fram strait ice flux and North Atlantic Oscillation. Journal of Geophysical Research: Oceans, 104(C3): 5177–5189. doi: 10.1029/1998JC900103 Kwok R, Untersteiner N. 2011. The thinning of Arctic Ice. Physics Today, 64(4): 36–41. doi: 10.1063/1.3580491 Lei Ruibo, Heil P, Wang Jia, et al. 2016. Characterization of sea-ice kinematic in the Arctic outflow region using buoy data. Polar Research, 35(1): 22658. doi: 10.3402/polar.v35.22658 Liu Tingting, Wang Zihan, Shokr M, et al. 2022. An assessment of sea ice motion products in the robeson channel using daily sentinel-1 images. Remote Sensing, 14(2): 329. doi: 10.3390/rs14020329 Marosz M. 2010. Regime shifts in Arctic Oscillation (AO) variability 1951–2009. Bulletin of Geography. Physical Geography Series, 3: 103–119. doi: 10.2478/bgeo-2010-0006 Min Chao, Mu Longjiang, Yang Qinghua, et al. 2019. Sea ice export through the Fram Strait derived from a combined model and satellite data set. The Cryosphere, 13(12): 3209–3224. doi: 10.5194/tc-13-3209-2019 Moritz R E. 1988. The ice budget of the Greenland Sea [dissertation]. New Haven: Yale University Perovich D K, Light B, Eicken H, et al. 2007. Increasing solar heating of the Arctic Ocean and adjacent seas, 1979–2005: Attribution and role in the ice-albedo feedback. Geophysical Research Letters, 34(19): L19505. doi: 10.1029/2007GL031480 Ricker R, Girard-Ardhuin F, Krumpen T, et al. 2018. Satellite-derived sea ice export and its impact on Arctic ice mass balance. The Cryosphere, 12(9): 3017–3032. doi: 10.5194/tc-12-3017-2018 Screen J A, Deser C. 2019. Pacific Ocean variability influences the time of emergence of a seasonally ice-free Arctic Ocean. Geophysical Research Letters, 46(4): 2222–2231. doi: 10.1029/2018GL081393 Serreze M C, Barrett A P, Slater A G, et al. 2006. The large-scale freshwater cycle of the Arctic. Journal of Geophysical Research: Oceans, 111(C11): C11010. doi: 10.1029/2005JC003424 Serreze M C, Holland M M, Stroeve J. 2007. Perspectives on the Arctic’s shrinking sea-ice cover. Science, 315(5818): 1533–1536. doi: 10.1126/science.1139426 Serreze M C, Meier W N. 2019. The Arctic’s sea ice cover: trends, variability, predictability, and comparisons to the Antarctic. Annals of the New York Academy of Sciences, 1436(1): 36–53. doi: 10.1111/nyas.13856 Simmonds I, Rudeva I. 2012. The great Arctic cyclone of August 2012. Geophysical Research Letters, 39(23): 23709 Smedsrud L H, Halvorsen M H, Stroeve J C, et al. 2017. Fram Strait sea ice export variability and September Arctic sea ice extent over the last 80 years. The Cryosphere, 11(1): 65–79. doi: 10.5194/tc-11-65-2017 Smedsrud L H, Sirevaag A, Kloster K, et al. 2011. Recent wind driven high sea ice area export in the Fram Strait contributes to Arctic sea ice decline. The Cryosphere, 5(4): 821–829. doi: 10.5194/tc-5-821-2011 Spreen G, Kern S, Stammer D, et al. 2009. Fram Strait sea ice volume export estimated between 2003 and 2008 from satellite data. Geophysical Research Letters, 36(19): L19502. doi: 10.1029/2009GL039591 Tao Shengli, Fang Jingyun, Zhao Xia, et al. 2015. Rapid loss of lakes on the Mongolian Plateau. Proceedings of the National Academy of Sciences of the United States of America, 112(7): 2281–2286. doi: 10.1073/pnas.1411748112 Thomas D, Martin S, Rothrock D, et al. 1996. Assimilating satellite concentration data into an Arctic sea ice mass balance model, 1979–1985. Journal of Geophysical Research: Oceans, 101(C9): 20849–20868. doi: 10.1029/96JC01690 Tian-Kunze X, Kaleschke L, Maaß N, et al. 2014. SMOS-derived thin sea ice thickness: algorithm baseline, product specifications and initial verification. The Cryosphere, 8(3): 997–1018. doi: 10.5194/tc-8-997-2014 Vinje T, Nordlund N, Kvambekk A. 1998. Monitoring ice thickness in Fram Strait. Journal of Geophysical Research: Oceans, 103(C5): 10437–10449. doi: 10.1029/97JC03360 Wang Dakui, Wang Hui, Li Ming, et al. 2013. Role of Ekman transport versus Ekman pumping in driving summer upwelling in the South China Sea. Journal of Ocean University of China, 12(3): 355–365. doi: 10.1007/s11802-013-1904-7 Wu Fengmin, He Jinhai, Qi Li. 2014. Arctic sea ice declining and its impact on the cold Eurasian winters: a review. Advances in Earth Science (in Chinese), 29(8): 913–921 Wu Bingyi, Wang Jia, Walsh J E. 2006. Dipole anomaly in the winter Arctic atmosphere and its association with sea ice motion. Journal of Climate, 19(2): 210–225. doi: 10.1175/JCLI3619.1 Xiu Yongwu, Min Chao, Xie Jiping, et al. 2021. Evaluation of sea-ice thickness reanalysis data from the coupled ocean-sea-ice data assimilation system TOPAZ4. Journal of Glaciology, 67(262): 353–365. doi: 10.1017/jog.2020.110 Yamagami A, Matsueda, M, Tanaka H L. 2017. Extreme Arctic cyclone in August 2016. Atmospheric Science Letters, 18(7): 307–314. doi: 10.1002/asl.757 Zhang Zehua, Bi Haibo, Sun Ke, et al. 2017. Arctic sea ice volume export through the Fram Strait from combined satellite and model data: 1979–2012. Acta Oceanologica Sinica, 36(1): 44–55. doi: 10.1007/s13131-017-0992-4 Zhang Fanyi, Pang Xiaoping, Lei Ruibo, et al. 2022. Arctic sea ice motion change and response to atmospheric forcing between 1979 and 2019. International Journal of Climatology, 42(3): 1854–1876. doi: 10.1002/joc.7340 Zhang Jinlun, Rothrock D, Steele M. 2000. Recent changes in Arctic sea ice: the interplay between ice dynamics and thermodynamics. Journal of Climate, 13(17): 3099–3114. doi: 10.1175/1520-0442(2000)013<3099:RCIASI>2.0.CO;2 Zhang Guoqing, Yao Tandong, Chen Wenfeng, et al. 2019. Regional differences of lake evolution across China during 1960s–2015 and its natural and anthropogenic causes. Remote Sensing of Environment, 221: 386–404. doi: 10.1016/j.rse.2018.11.038 Zwally H J, Gloersen P. 2008. Arctic sea ice surviving the summer melt: interannual variability and decreasing trend. Journal of Glaciology, 54(185): 279–296. doi: 10.3189/002214308784886108 -


 点击查看大图
计量
- 文章访问数: 310
- HTML全文浏览量: 134
- PDF下载量: 28
- 被引次数: 0

