

-
Abstract: Using observational data from multiple satellites, we studied seasonal variations of the shape and location of the Luzon cold eddy (LCE) northwest of Luzon Island. The shape and location of the LCE have obvious seasonal variations. The LCE occurs, develops, and disappears from December to April of the next year. During this period, the shape of the LCE changed from a flat ellipse to a circular ellipse, and the change in shape can be reflected by the increase of the ellipticity of the LCE from 0.16 to 0.82. The latitude of center location of the LCE changes from 17.4°N to 19°N, and the change in latitude can reach 1.6°. Further study showed that seasonal variation of the northeast monsoon intensity leads to the change in the shape and location of the LCE. The seasonal variation of the LCE shape can significantly alter the spatial distribution of the thermal front and chlorophyll a northwest of the Luzon Island by geostrophic advection.
-
Key words:
- Luzon cold eddy /
- seasonal variation /
- shape and location /
- thermal front /
- chlorophyll a concentration
-
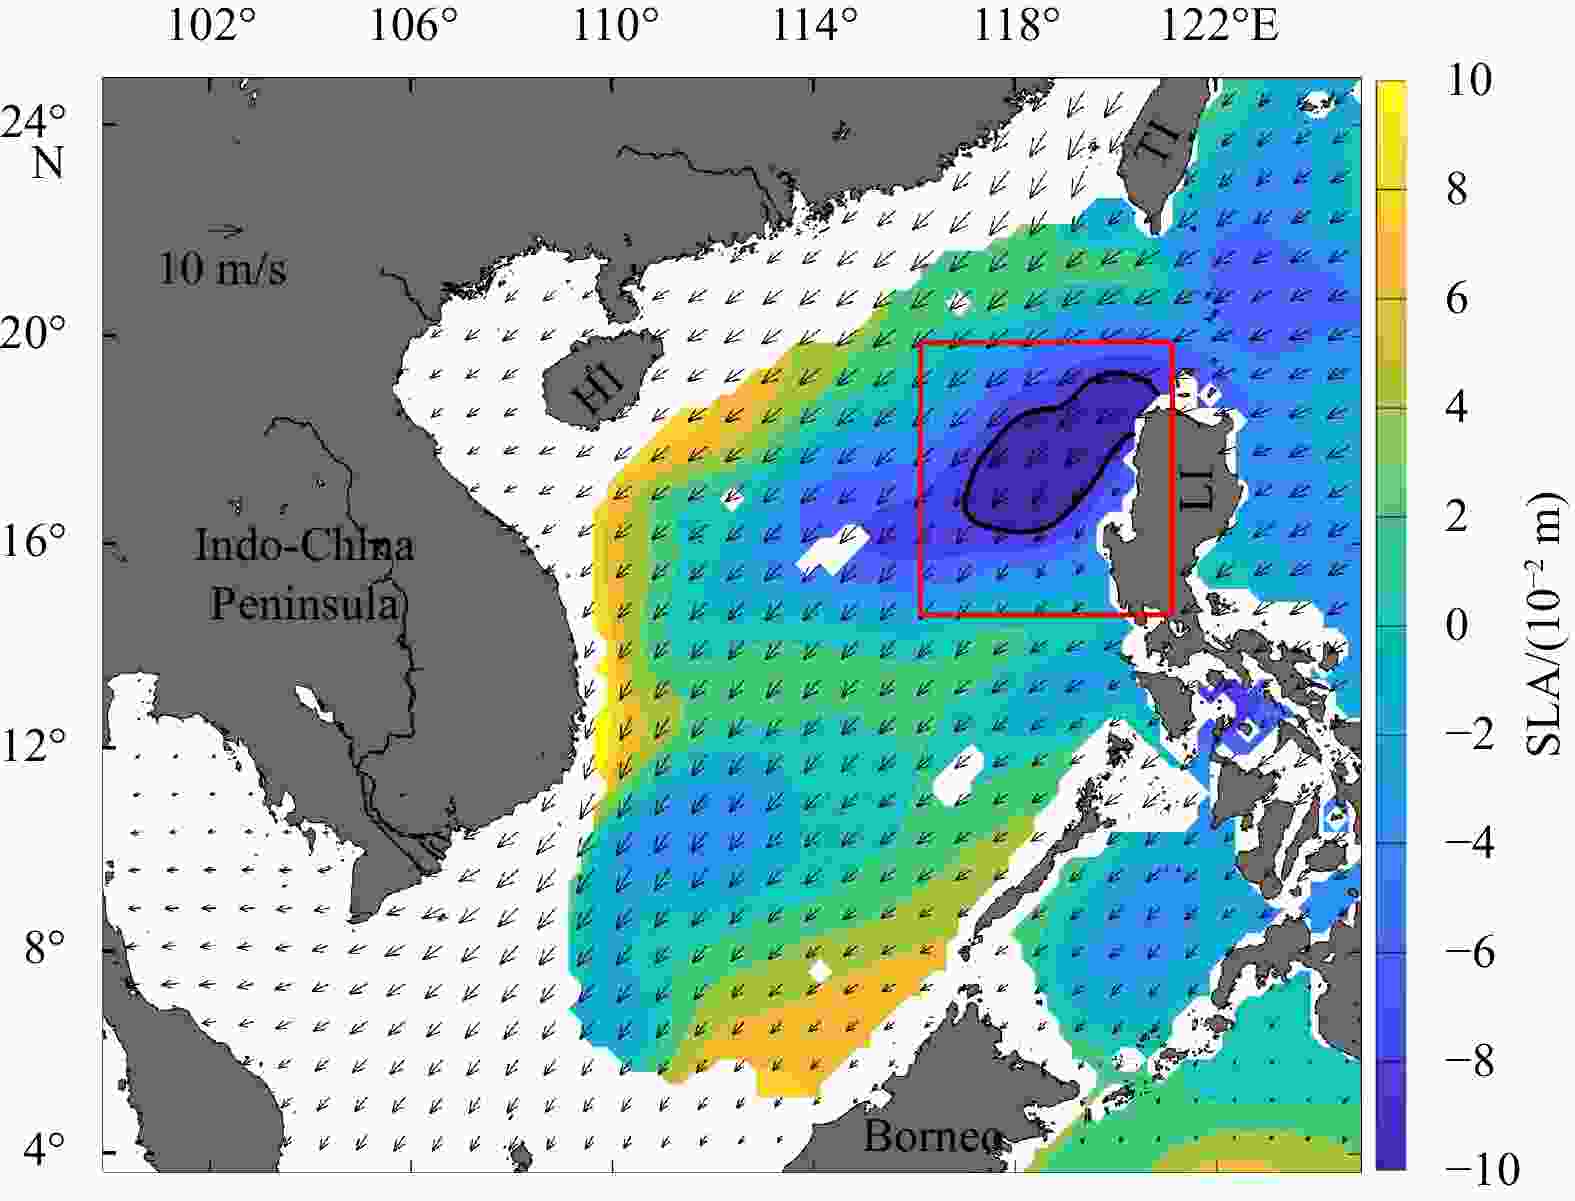
Figure 1. Topographic distribution of the South China Sea and winter climatological mean distribution of sea level anomaly (SLA) and wind vectors. The filling contour represents SLA (unit: 10−2 m). The arrows represent wind vectors (unit: m/s). The black solid line represents the −0.08 m contour of SLA. The red box encompasses 14.625°–19.875°N, 116.125°–121.125°E, which represents the region northwest of Luzon Island. HI: Hainan Island, LI: Luzon Island, TI: Taiwan Island.
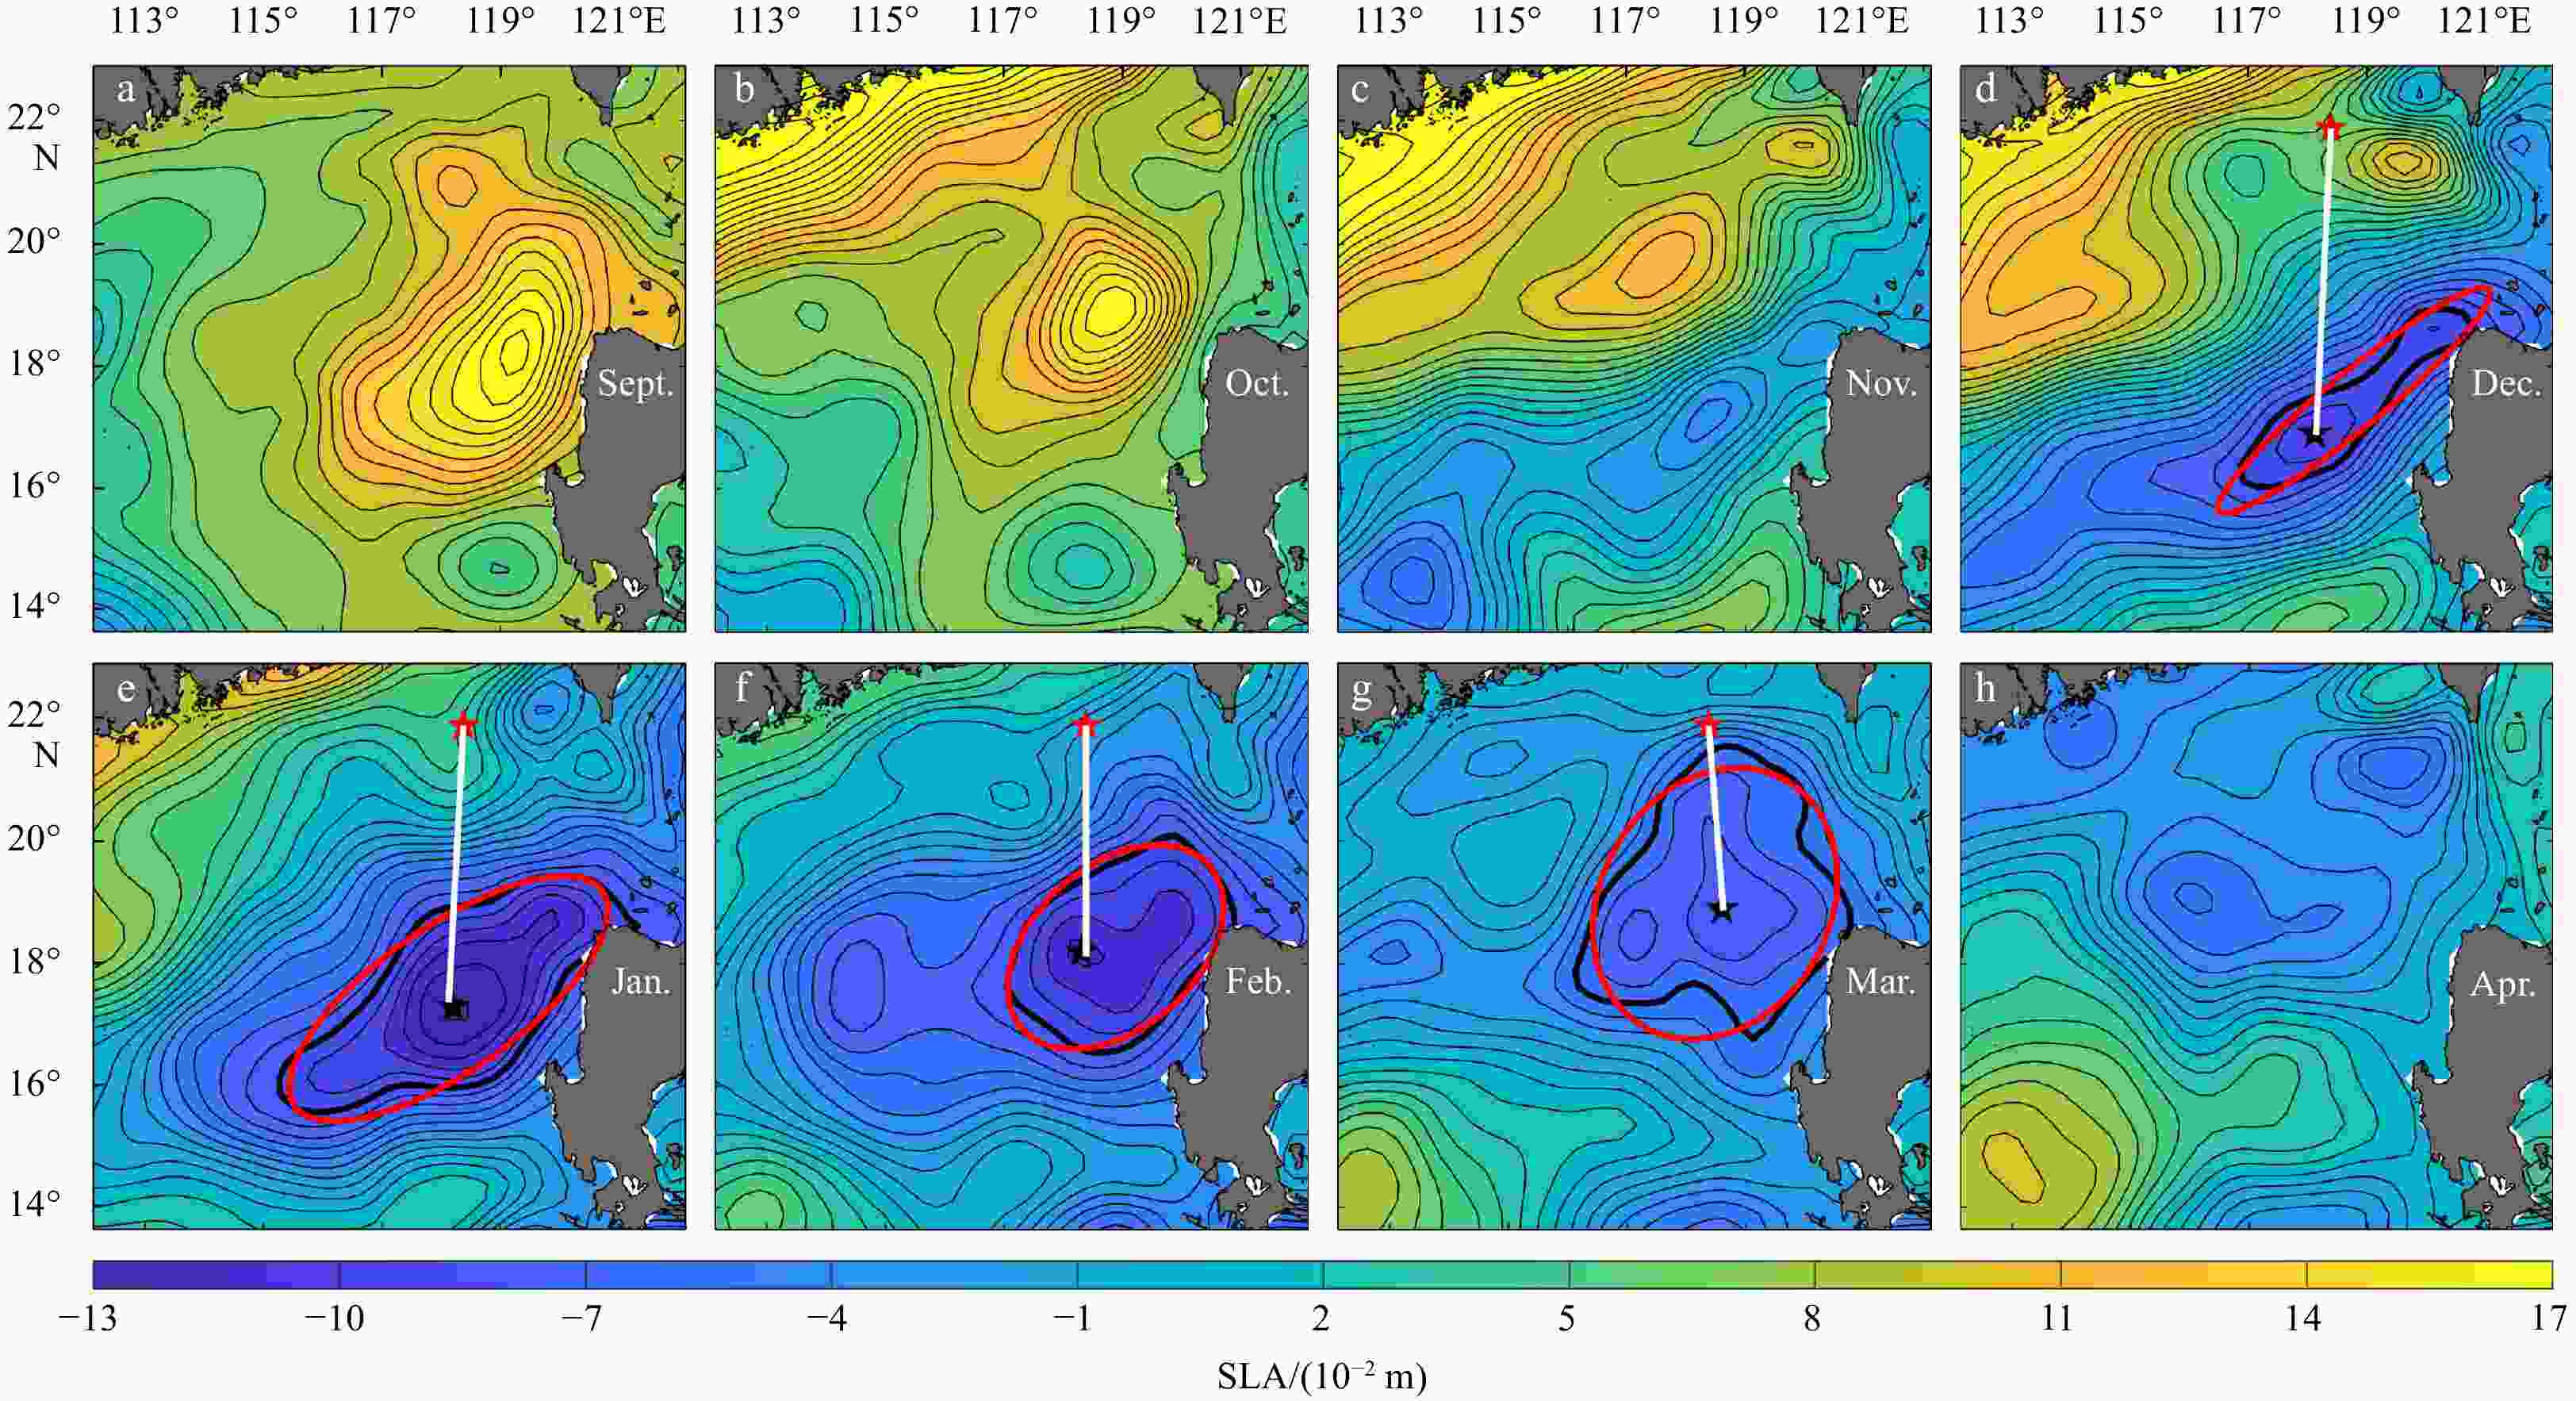
Figure 2. Seasonal variations in the shape and location of the Luzon cold eddy (LCE). The filling contour represents sea level anomaly (SLA). The thick black solid line represents the edge of the LCE. The thick red solid line represents the edge of the fitting ellipse for the LCE. The black star represents the center location of the LCE. The red star, located at 21.875°N, 118.375°E southwest of Taiwan Island, represents the location along which the SLA gradient north of the South China Sea is defined. The white solid line represents the distance between the black star and red star.
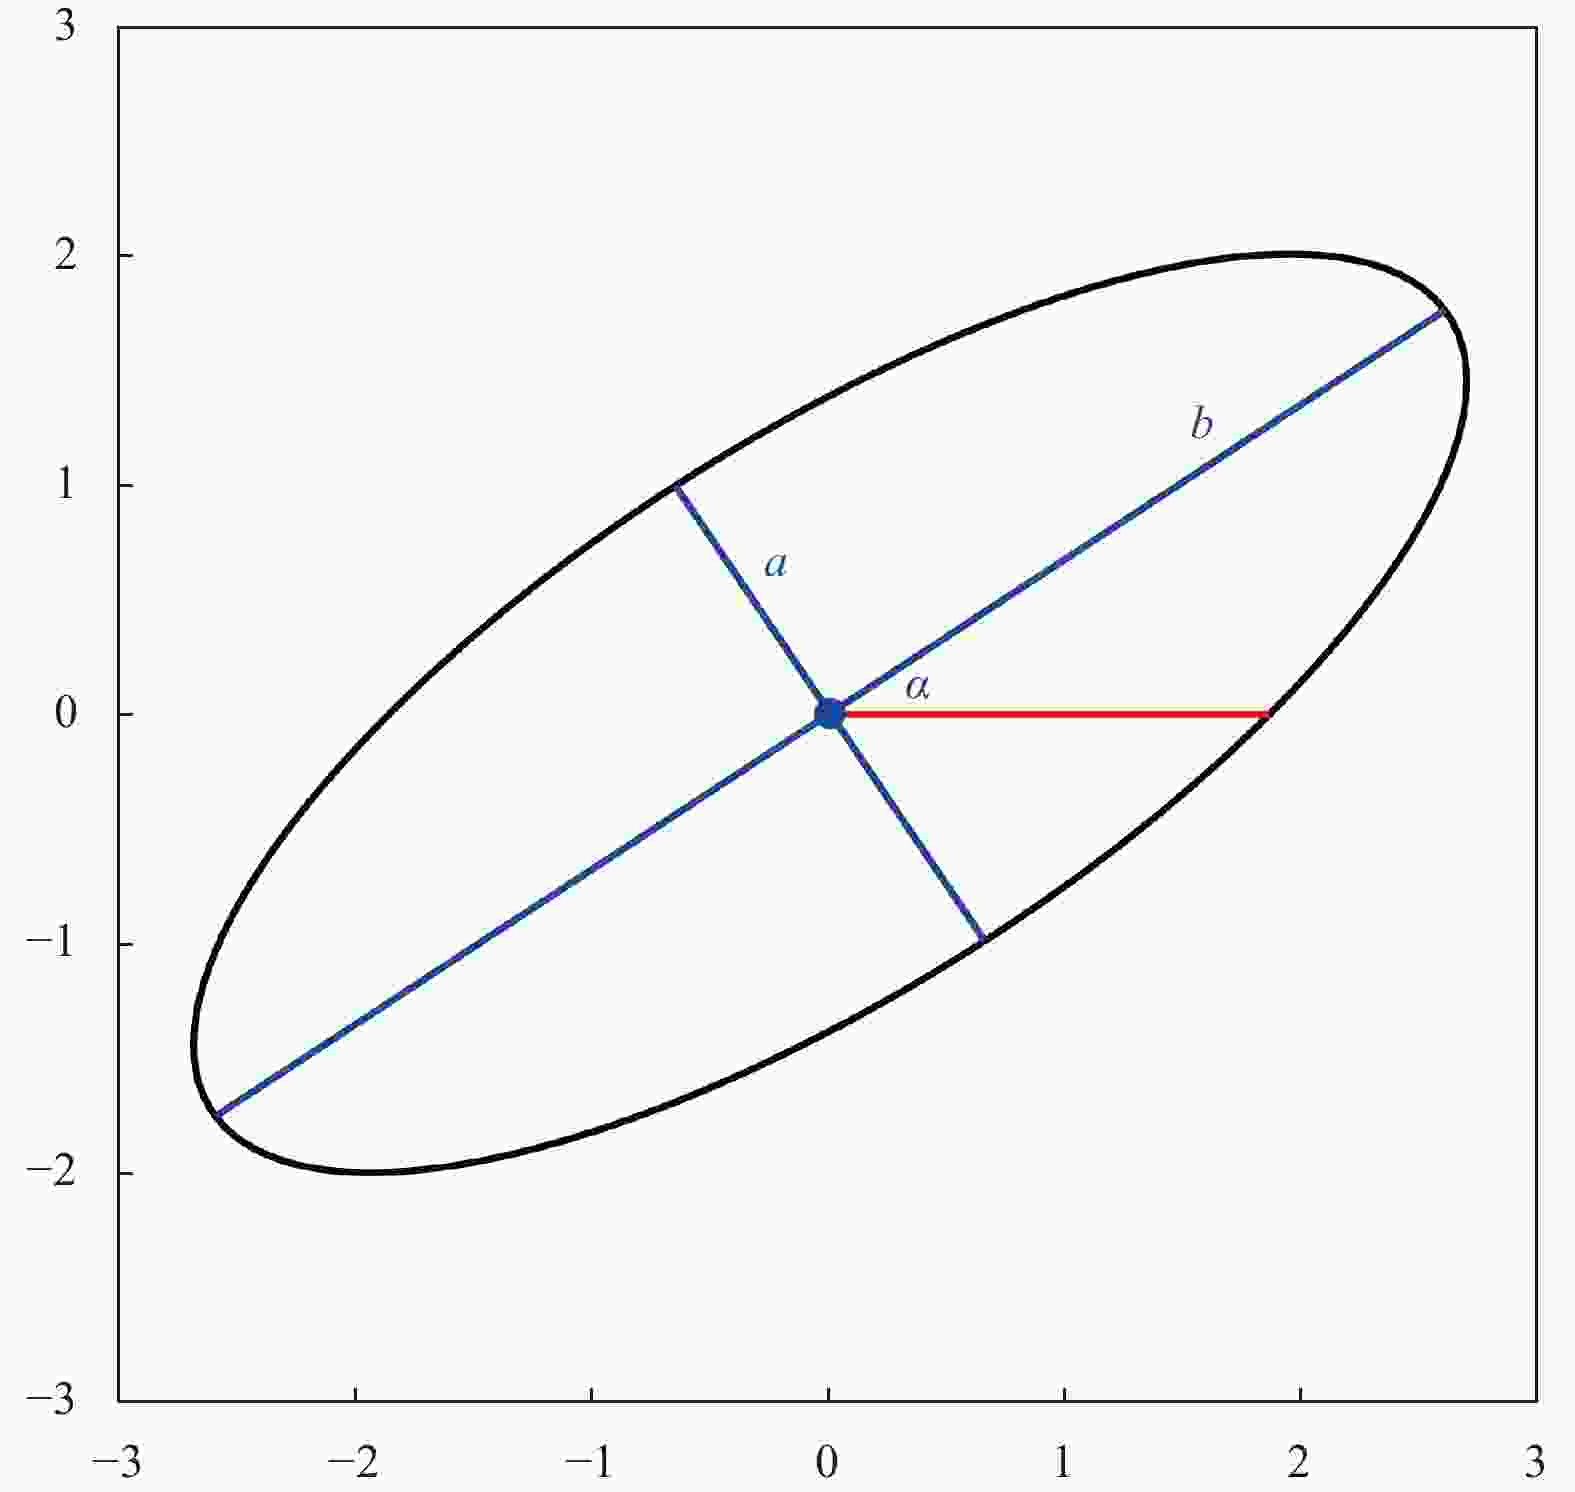
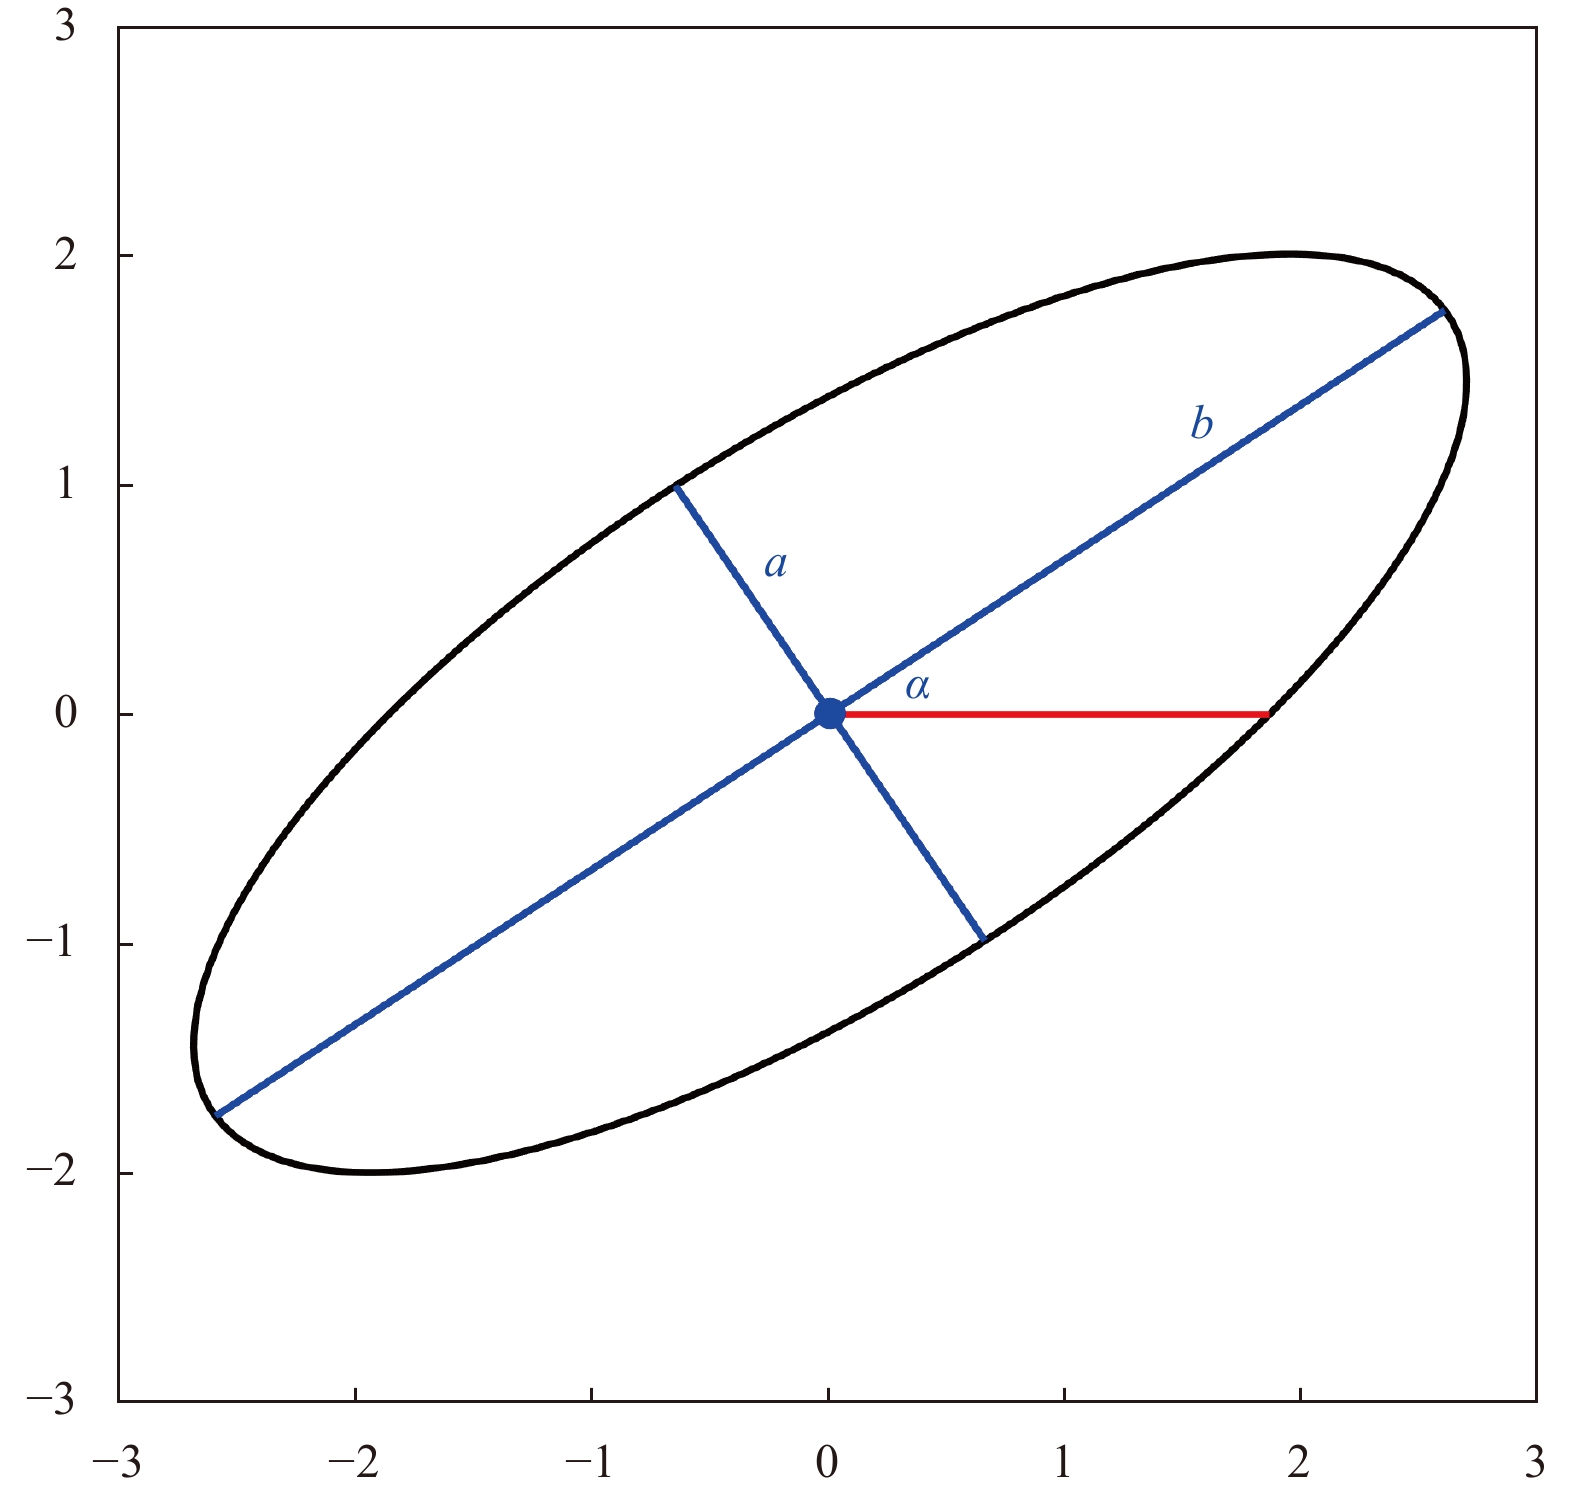
Figure 3. Schematic diagram of the fitting ellipse for the Luzon cold eddy. a and b represent the minor axis and major axis of the ellipse, respectively.
$ \alpha $ represents the included angle.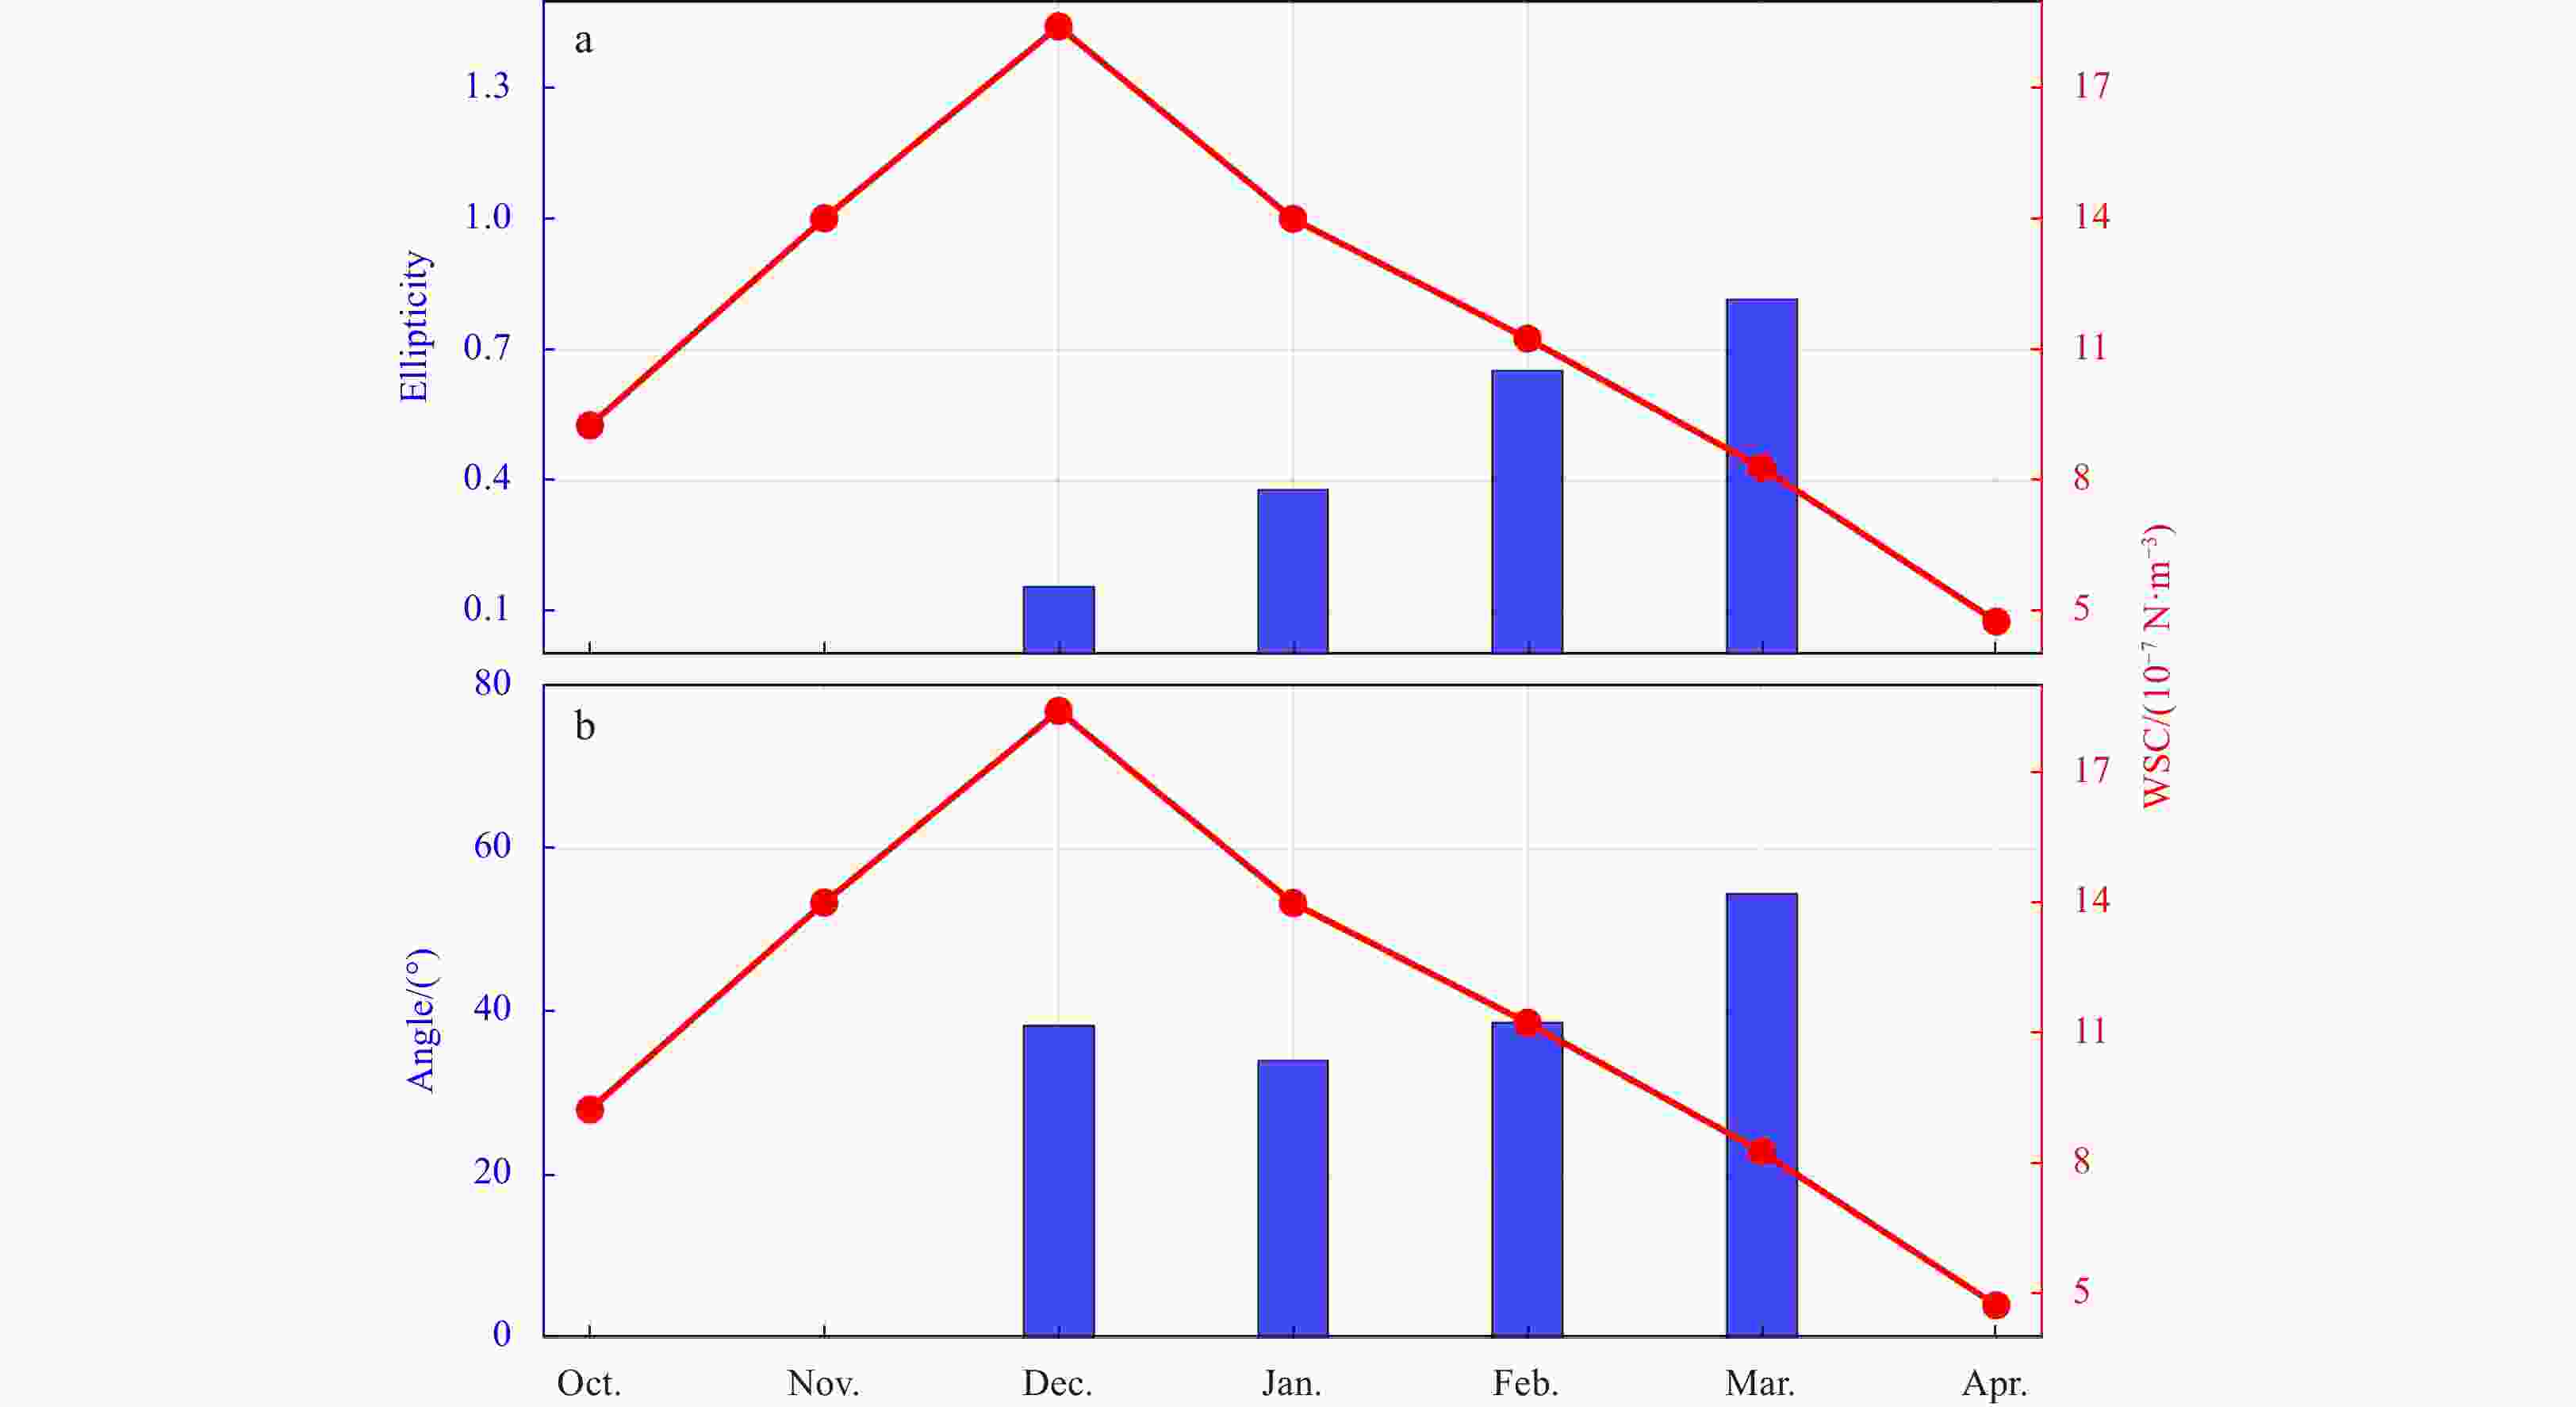
Figure 4. Correspondence between ellipticity of the fitting-ellipse of the Luzon cold eddy (LCE) and intensity of wind stress curl (WSC) northwest of Luzon Island (a); correspondence between the included angle of the fitting-ellipse of the LCE and WSC northwest of Luzon Island (b).

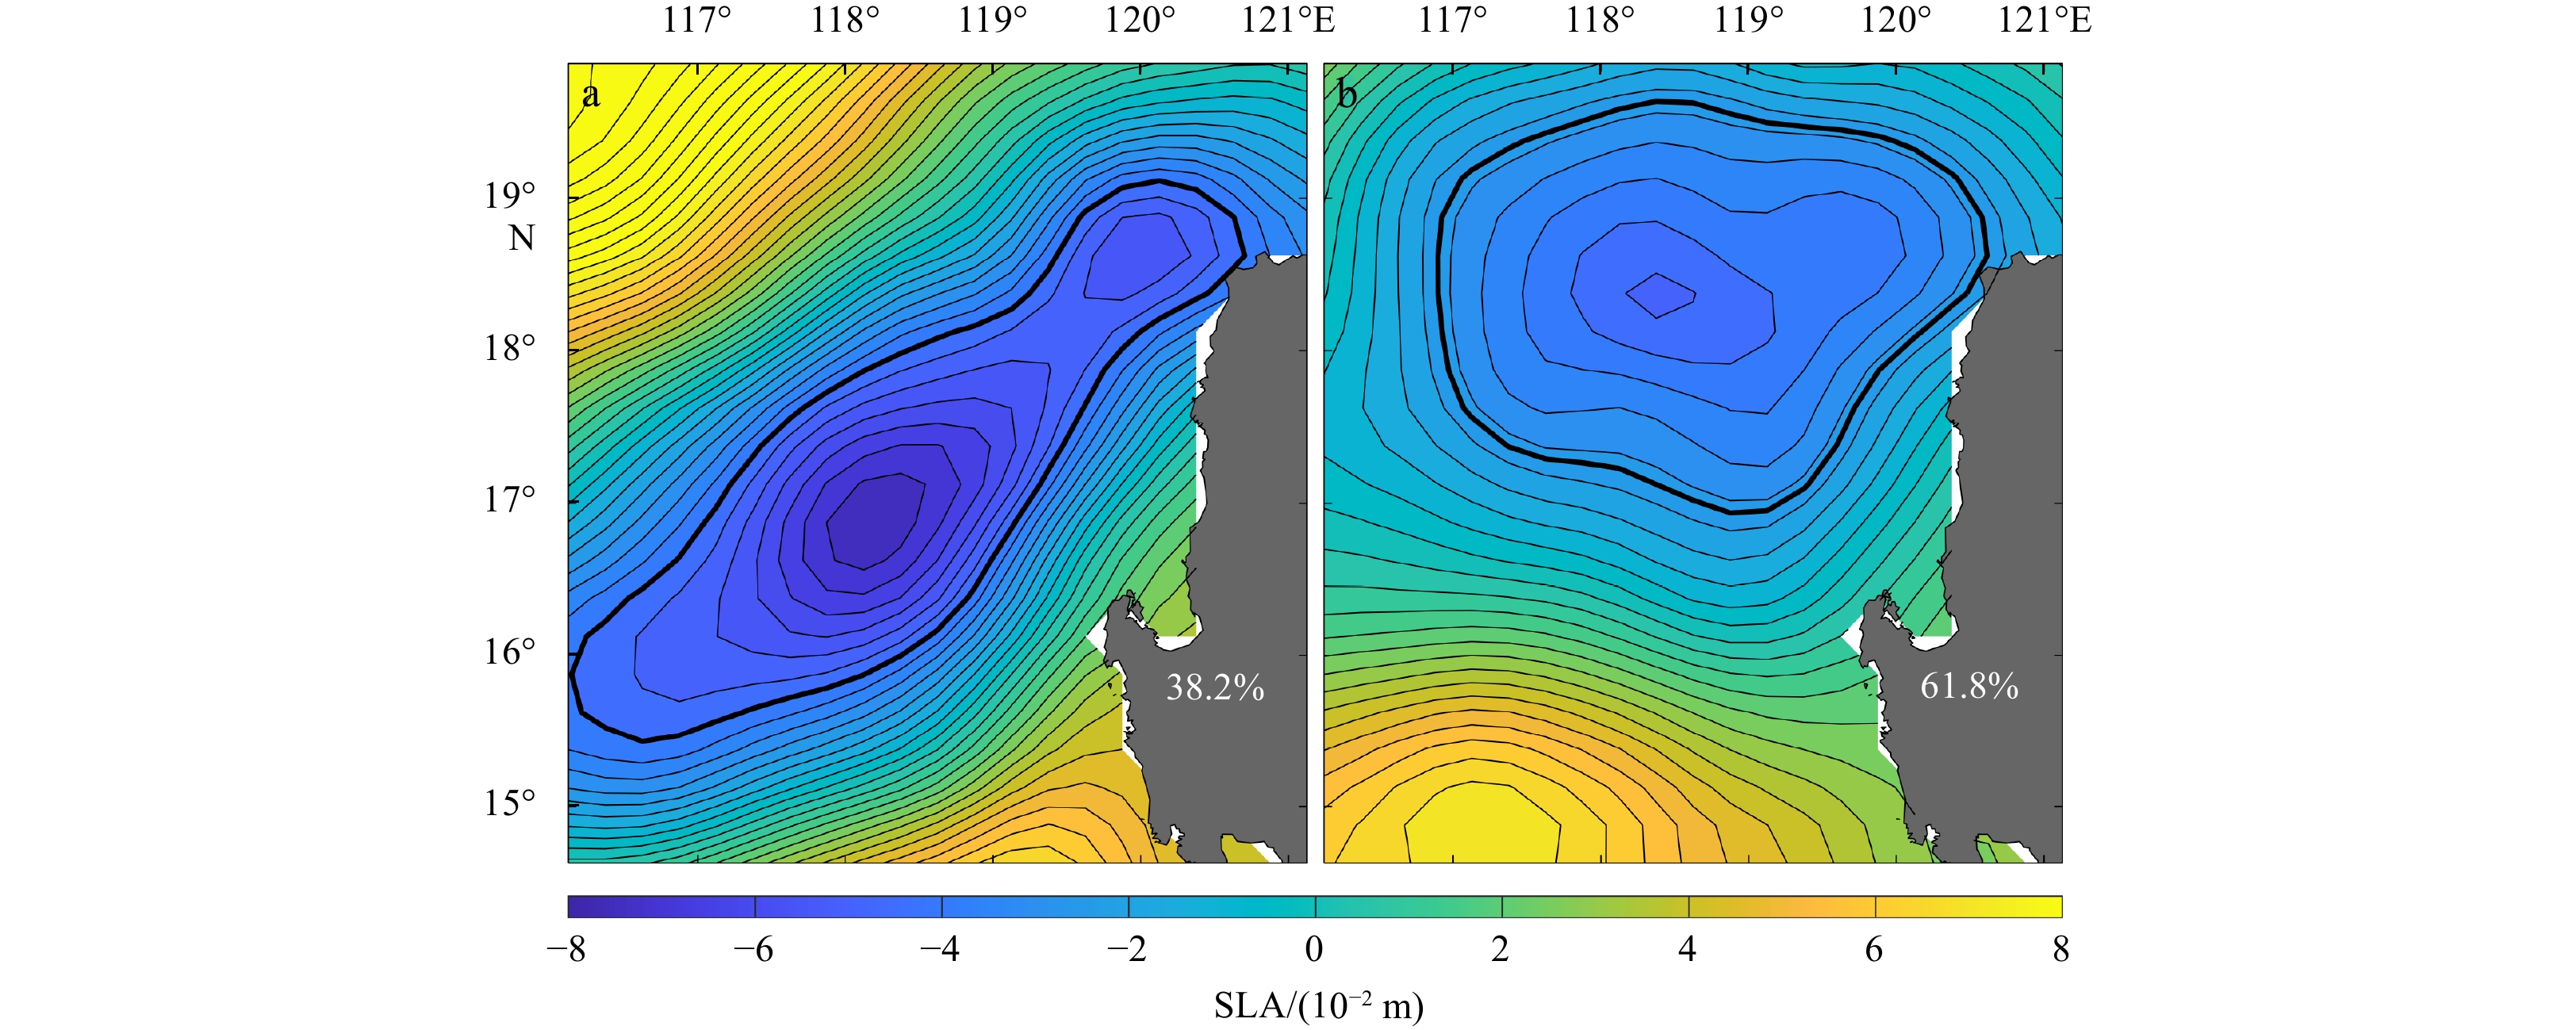
Figure 5. Two spatial patterns from self-organizing map analysis. a. Elliptical mode of the Luzon cold eddy (LCE); b. circular mode of the LCE. White numbers in each panel denote the incidence rate of the corresponding pattern. The black thick solid line represents the edge of the LCE. The interval between isolines is
$ 5 \times {10}^{-3} $ m. SLA: sea level anomaly.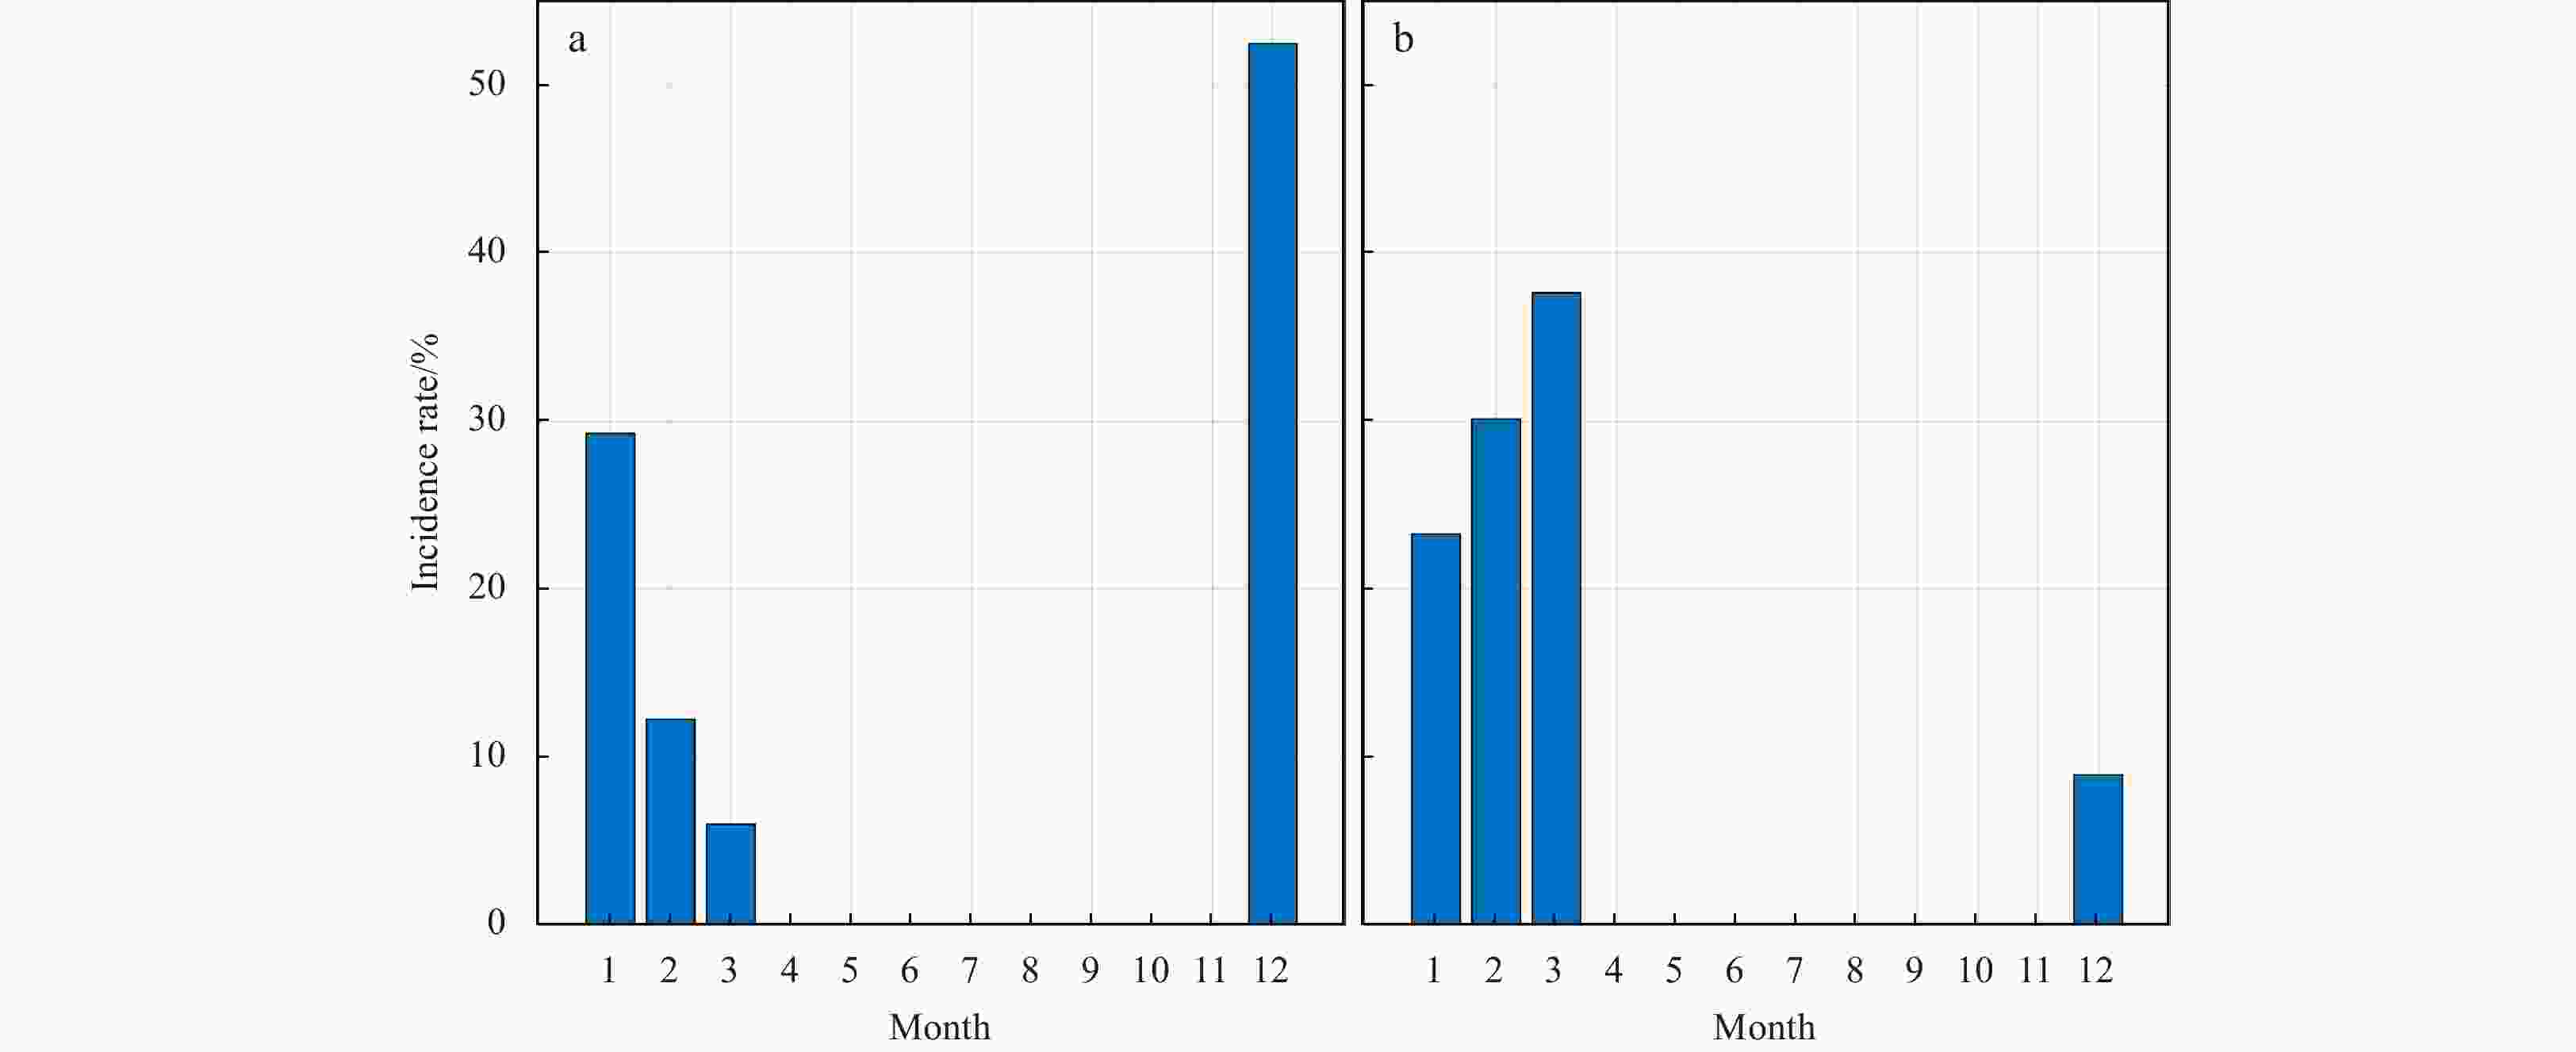
Figure 6. Distribution of incidence rate of different spatial modes of the Luzon cold eddy. a. Distribution is for elliptical mode; b. Distribution is for circular mode.
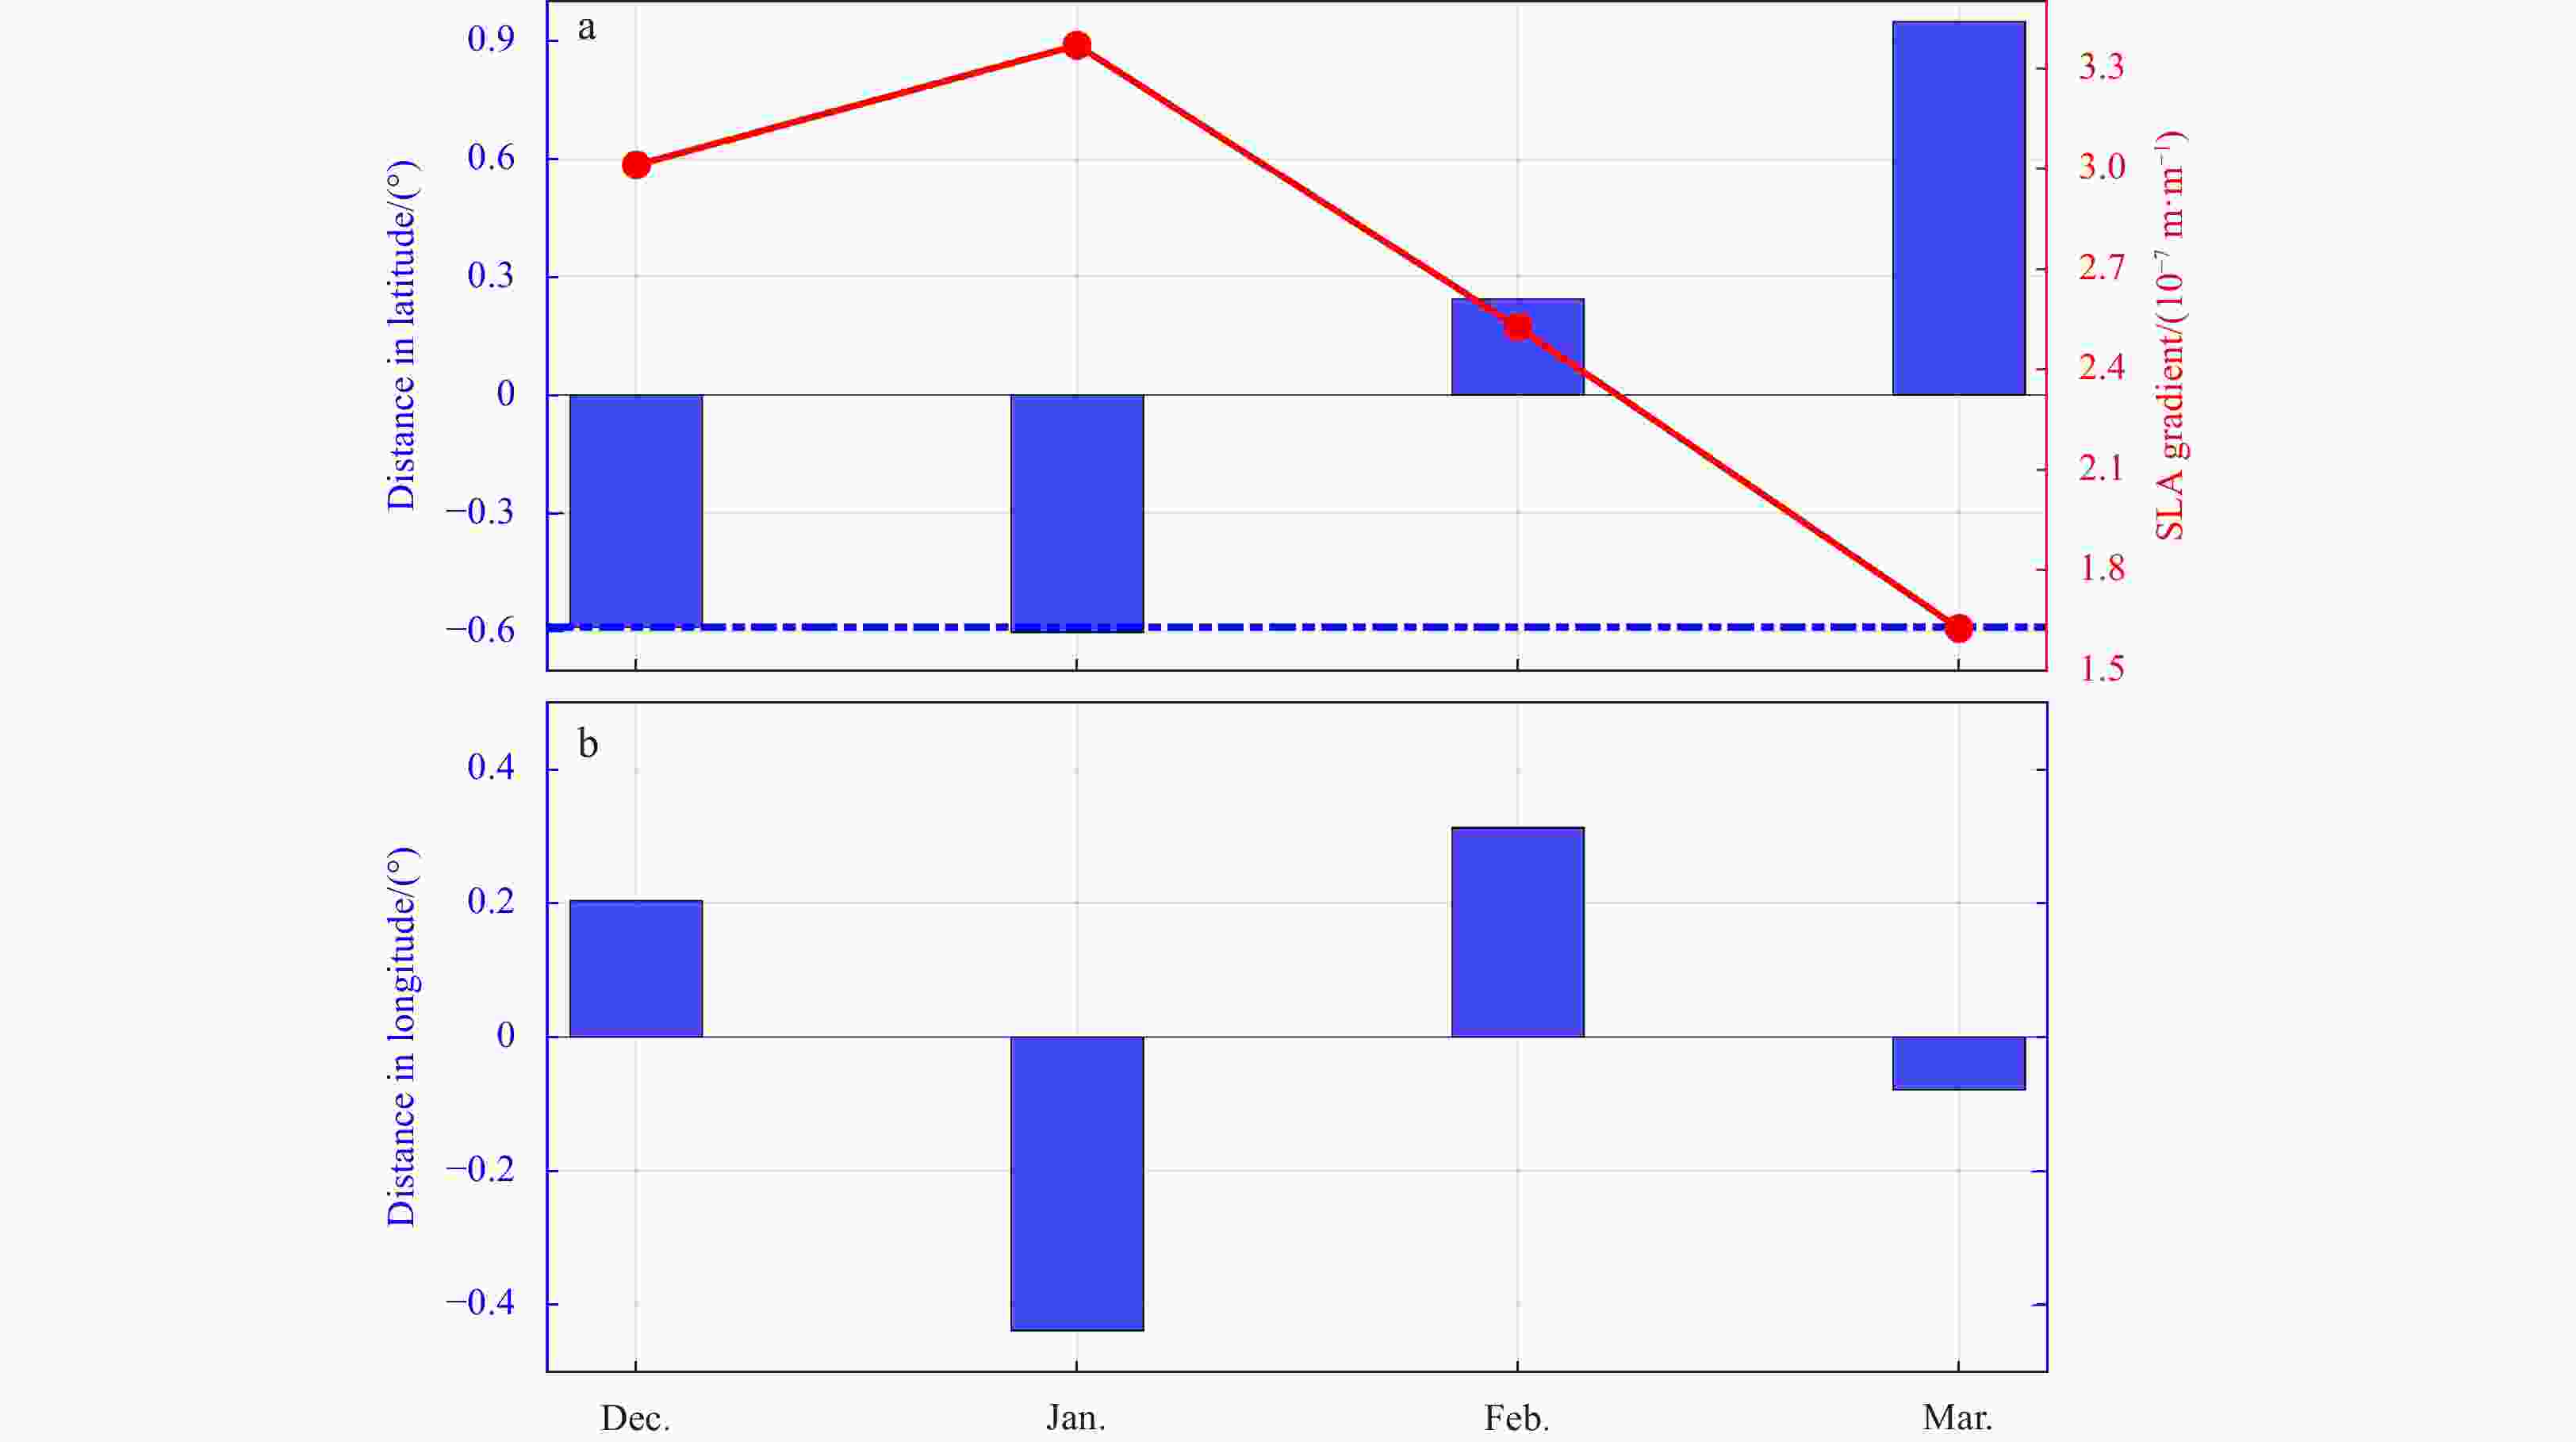
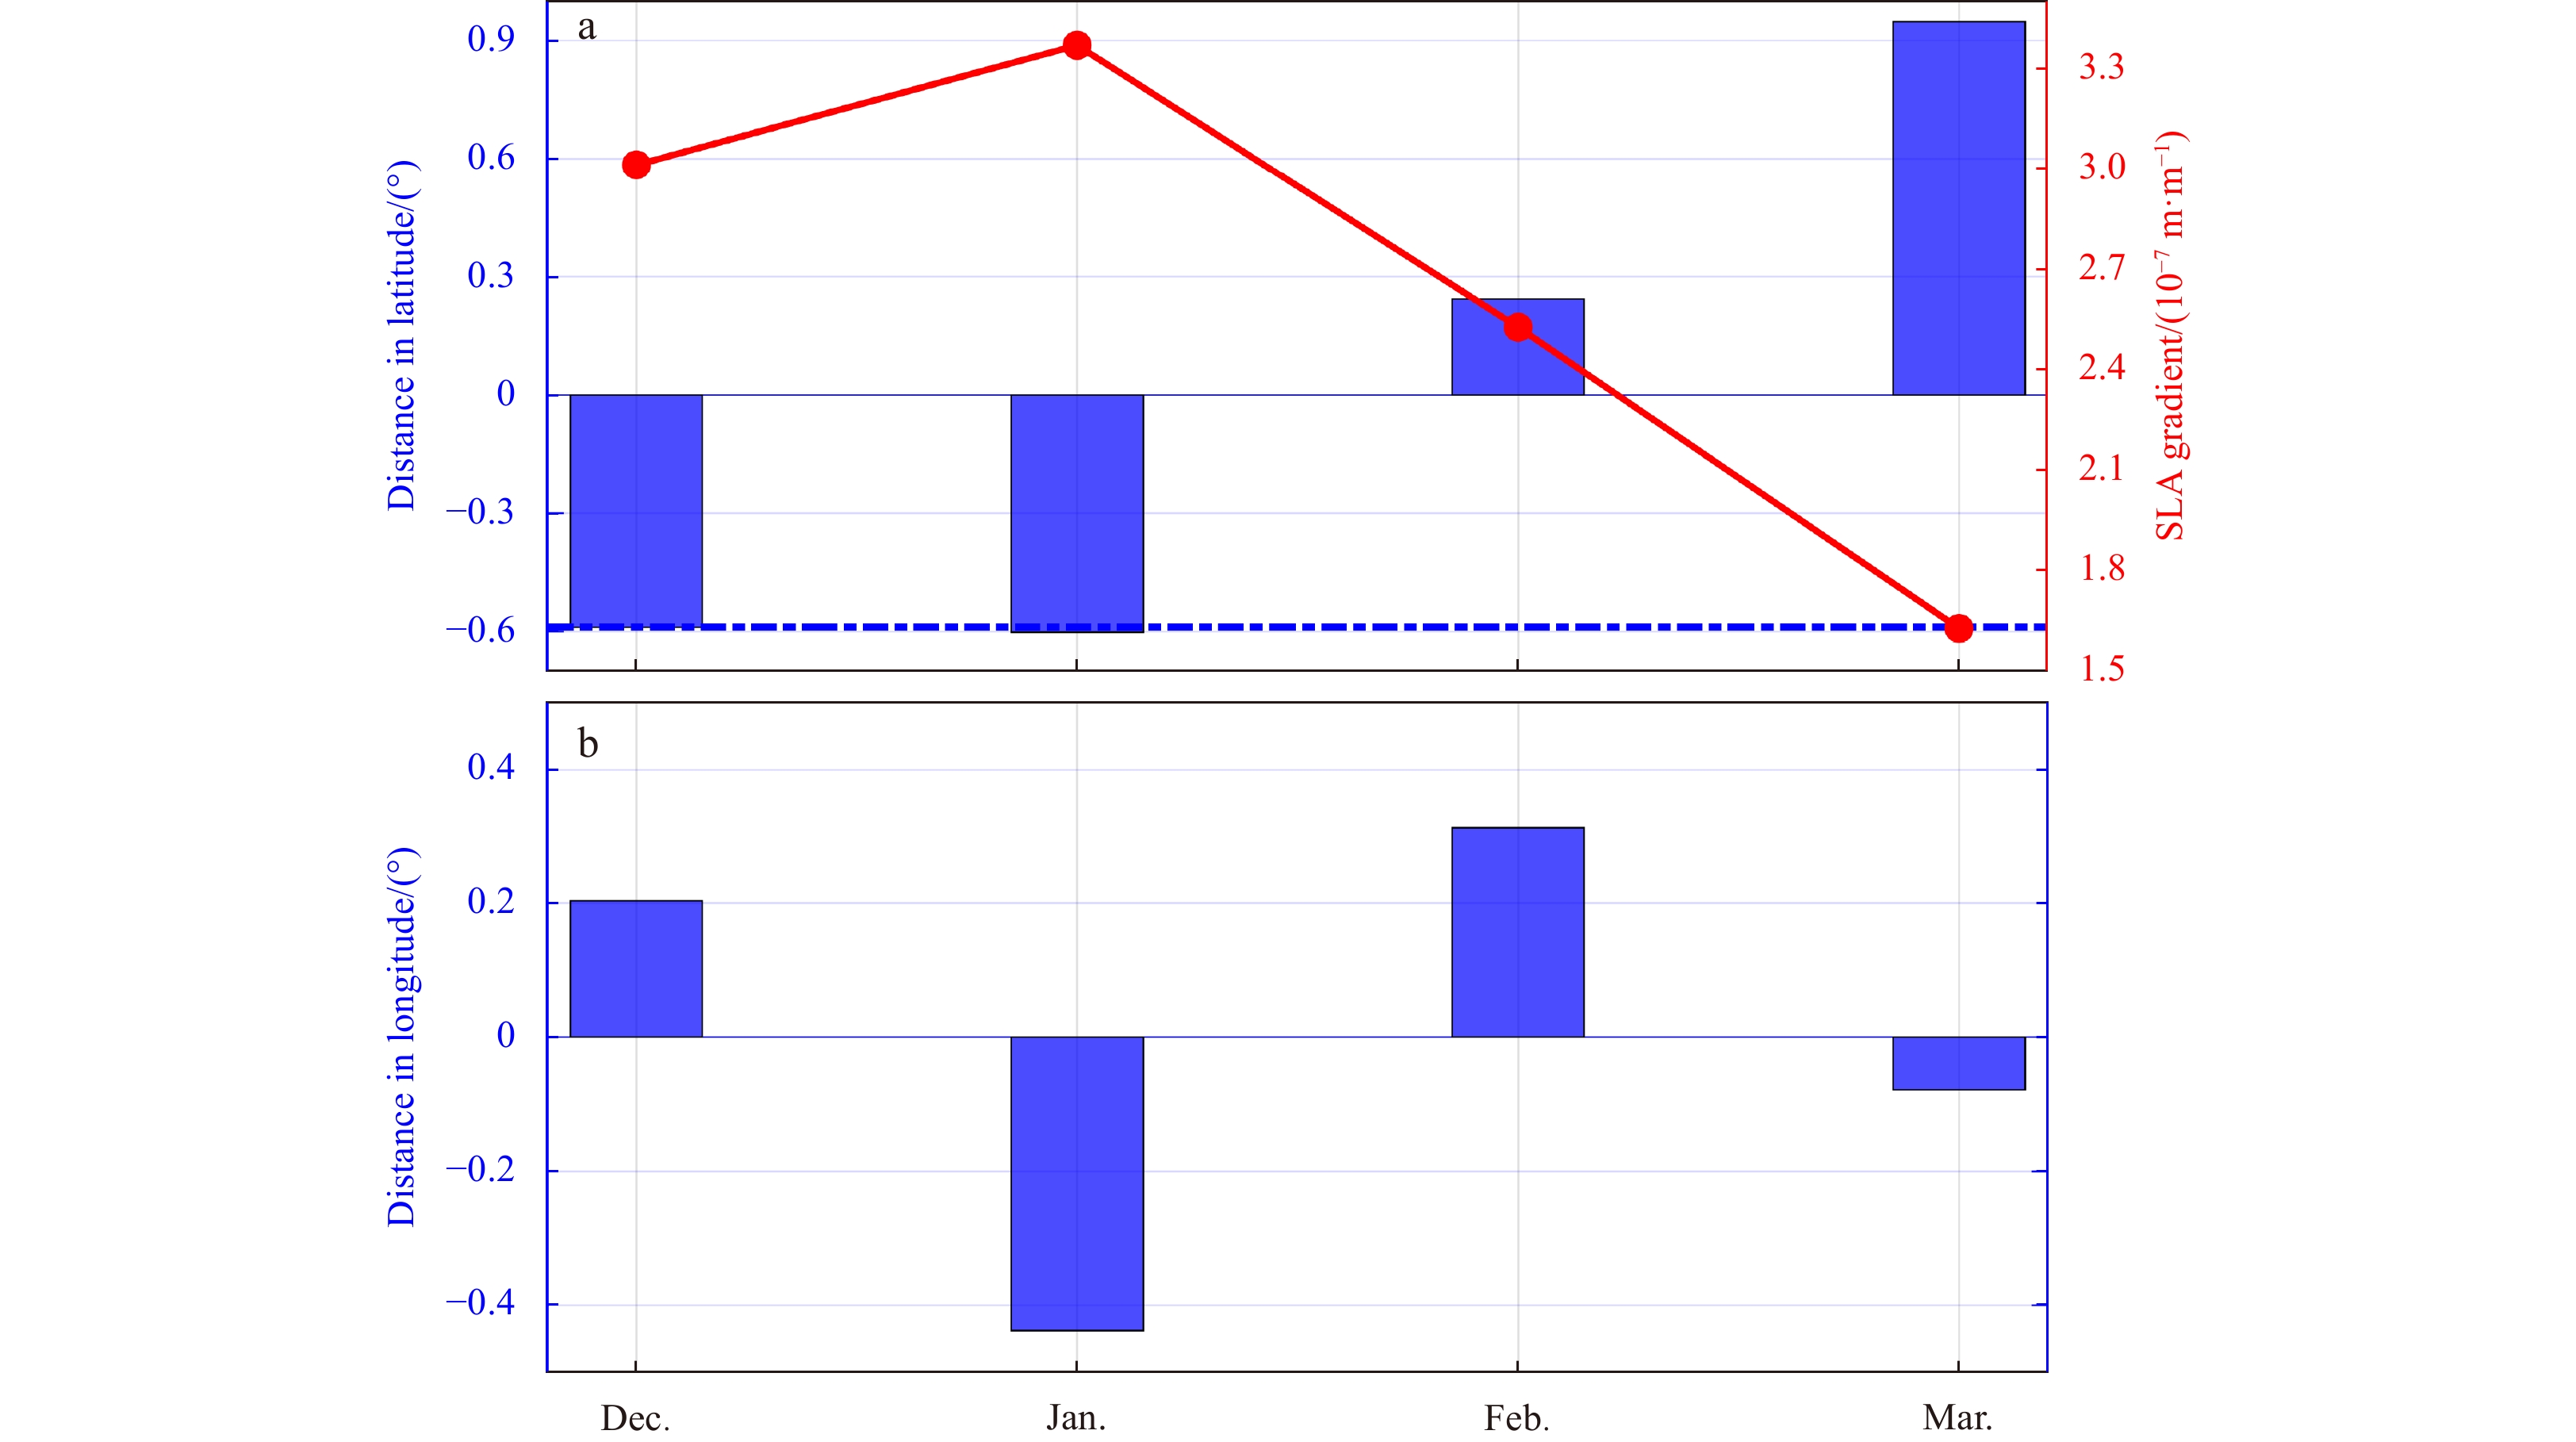
Figure 7. Correspondence between distance of the center location of the Luzon cold eddy (LCE) and sea level anomaly (SLA) gradient north of the South China Sea. The SLA gradient is obtained by dividing the difference between the SLA at the red star and the black star by the corresponding distance in Fig. 2. a. In latitude, the mean latitude of the center location of the LCE is 18°N. b. In longitude, the mean longitude of the center location is 118.6°E.
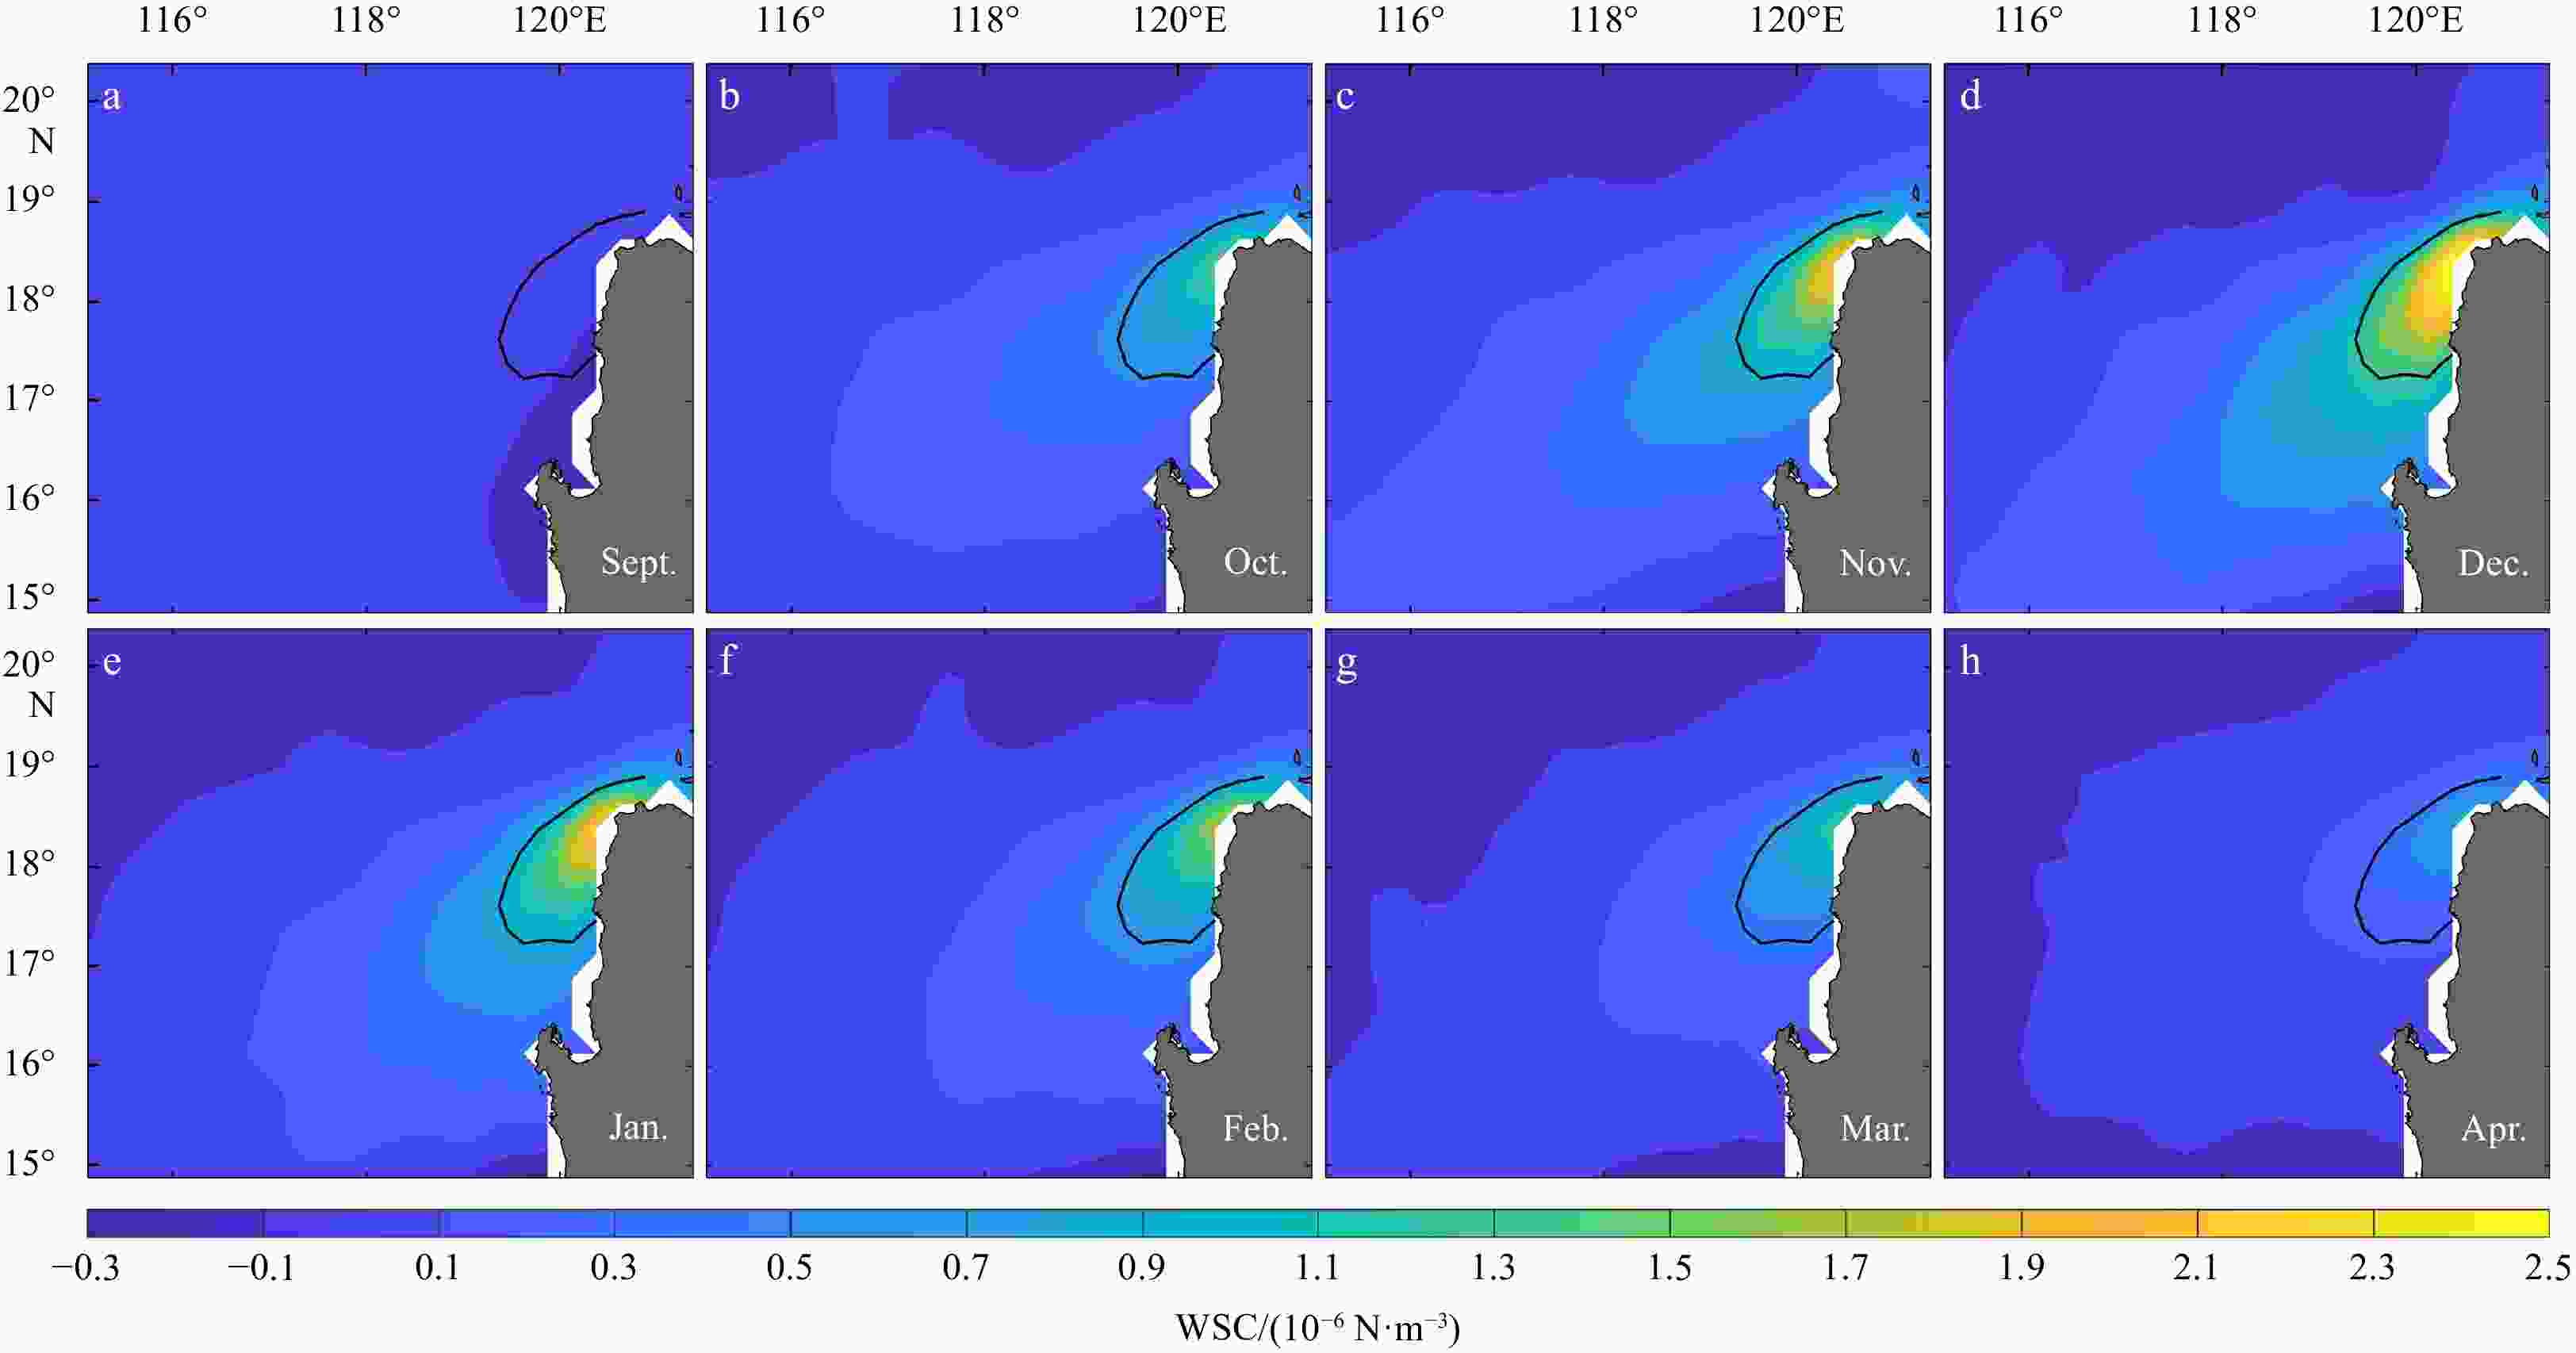
Figure 8. Seasonal variation in the wind stress curl (WSC) northwest of Luzon Island. The black solid line represents the climatological mean location of the WSC.

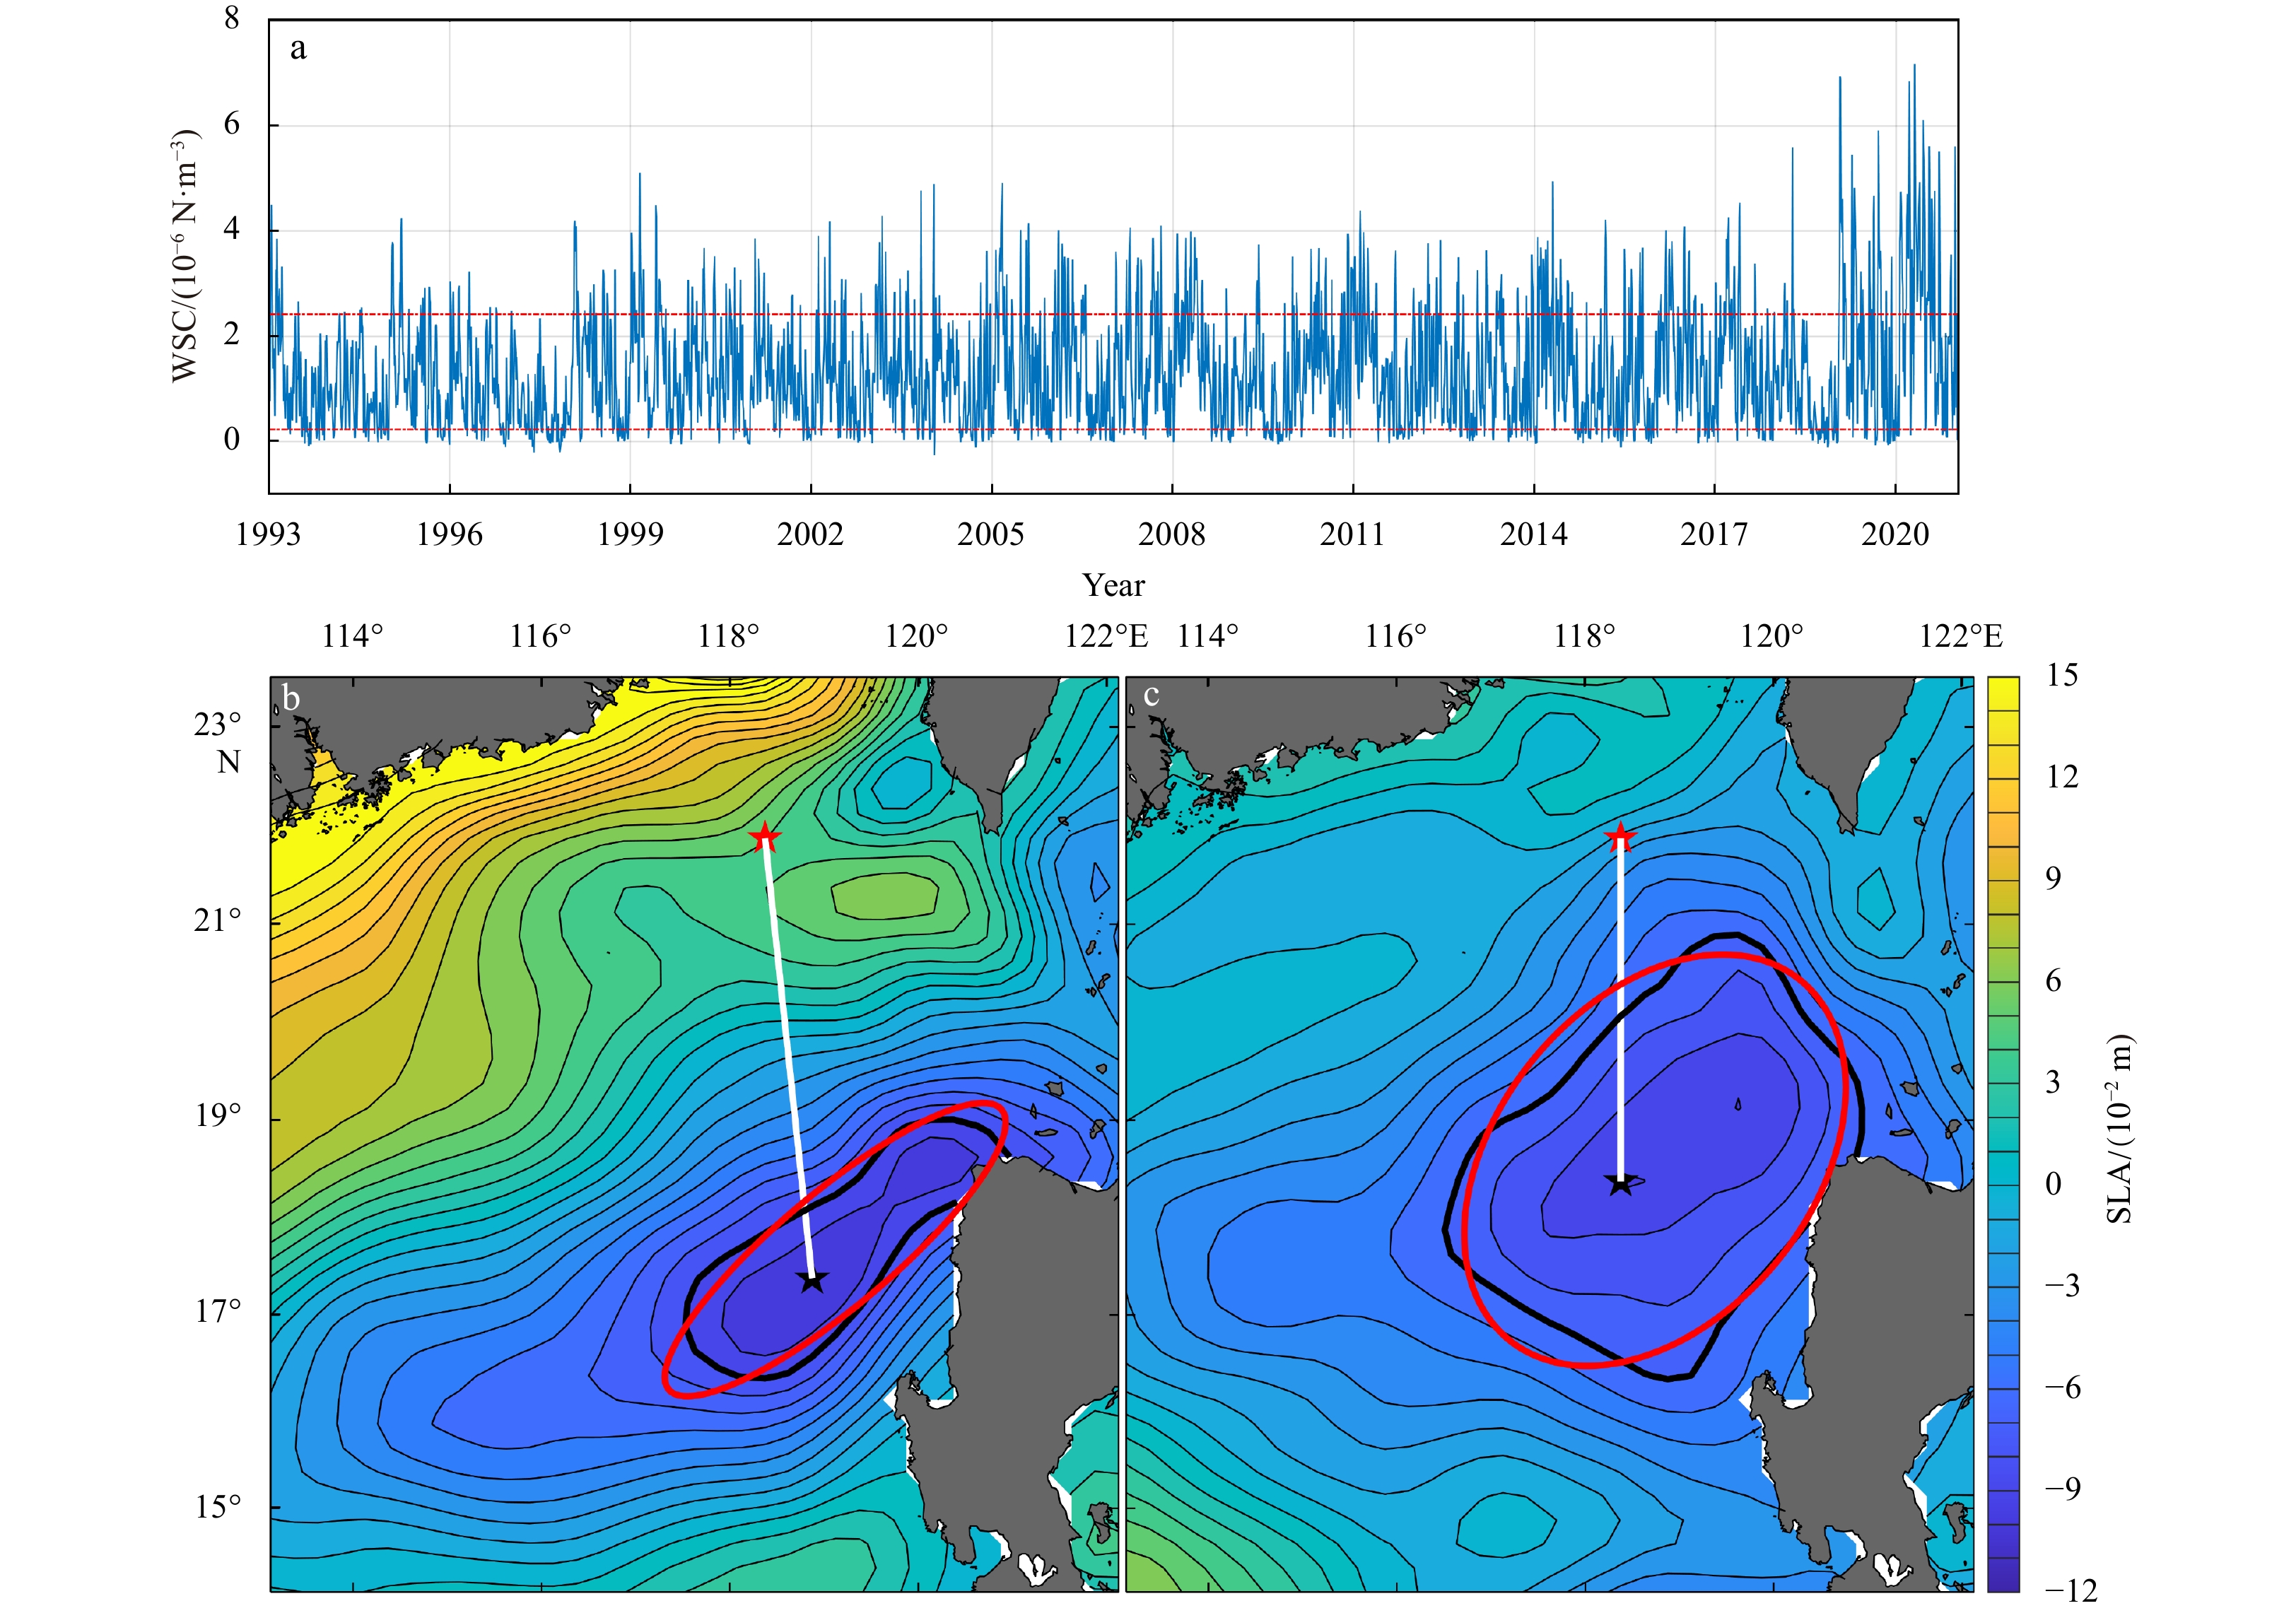
Figure 9. Correspondence between Luzon cold eddy (LCE) and wind stress curl (WSC) northwest of Luzon Island from winter 1993 to winter 2020. Winter is defined as the period from December to March. a. Daily variation in the WSC. The upper (lower) red dotted line represents the sum (difference) of the one-time standard deviation and the average value of the time series, and the days when the time series is bigger (smaller) than the upper (lower) red dotted are defined as positive (negative) index days. b. Composition of sea level anomaly (SLA) for positive index days, and the thick black solid line represents the −0.08 m contour of SLA. The thick black (red) solid line represents the edge of the LCE (the fitting ellipse for the LCE), whose ellipticity is 0.26 (0.69). The black star represents the center location of the LCE. The red star, located at 21.875°N, 118.375°E, southwest of Taiwan Island, represents the location along which the SLA gradient north of the South China Sea is defined. The white solid line represents the distance between the black star and red star. c. Same as b, except for negative index days, and the thick black solid line represents the −0.06 m contour of SLA. The thick black (red) solid line represents the edge of the LCE (the fitting ellipse for the LCE), whose ellipticity is 0.69.
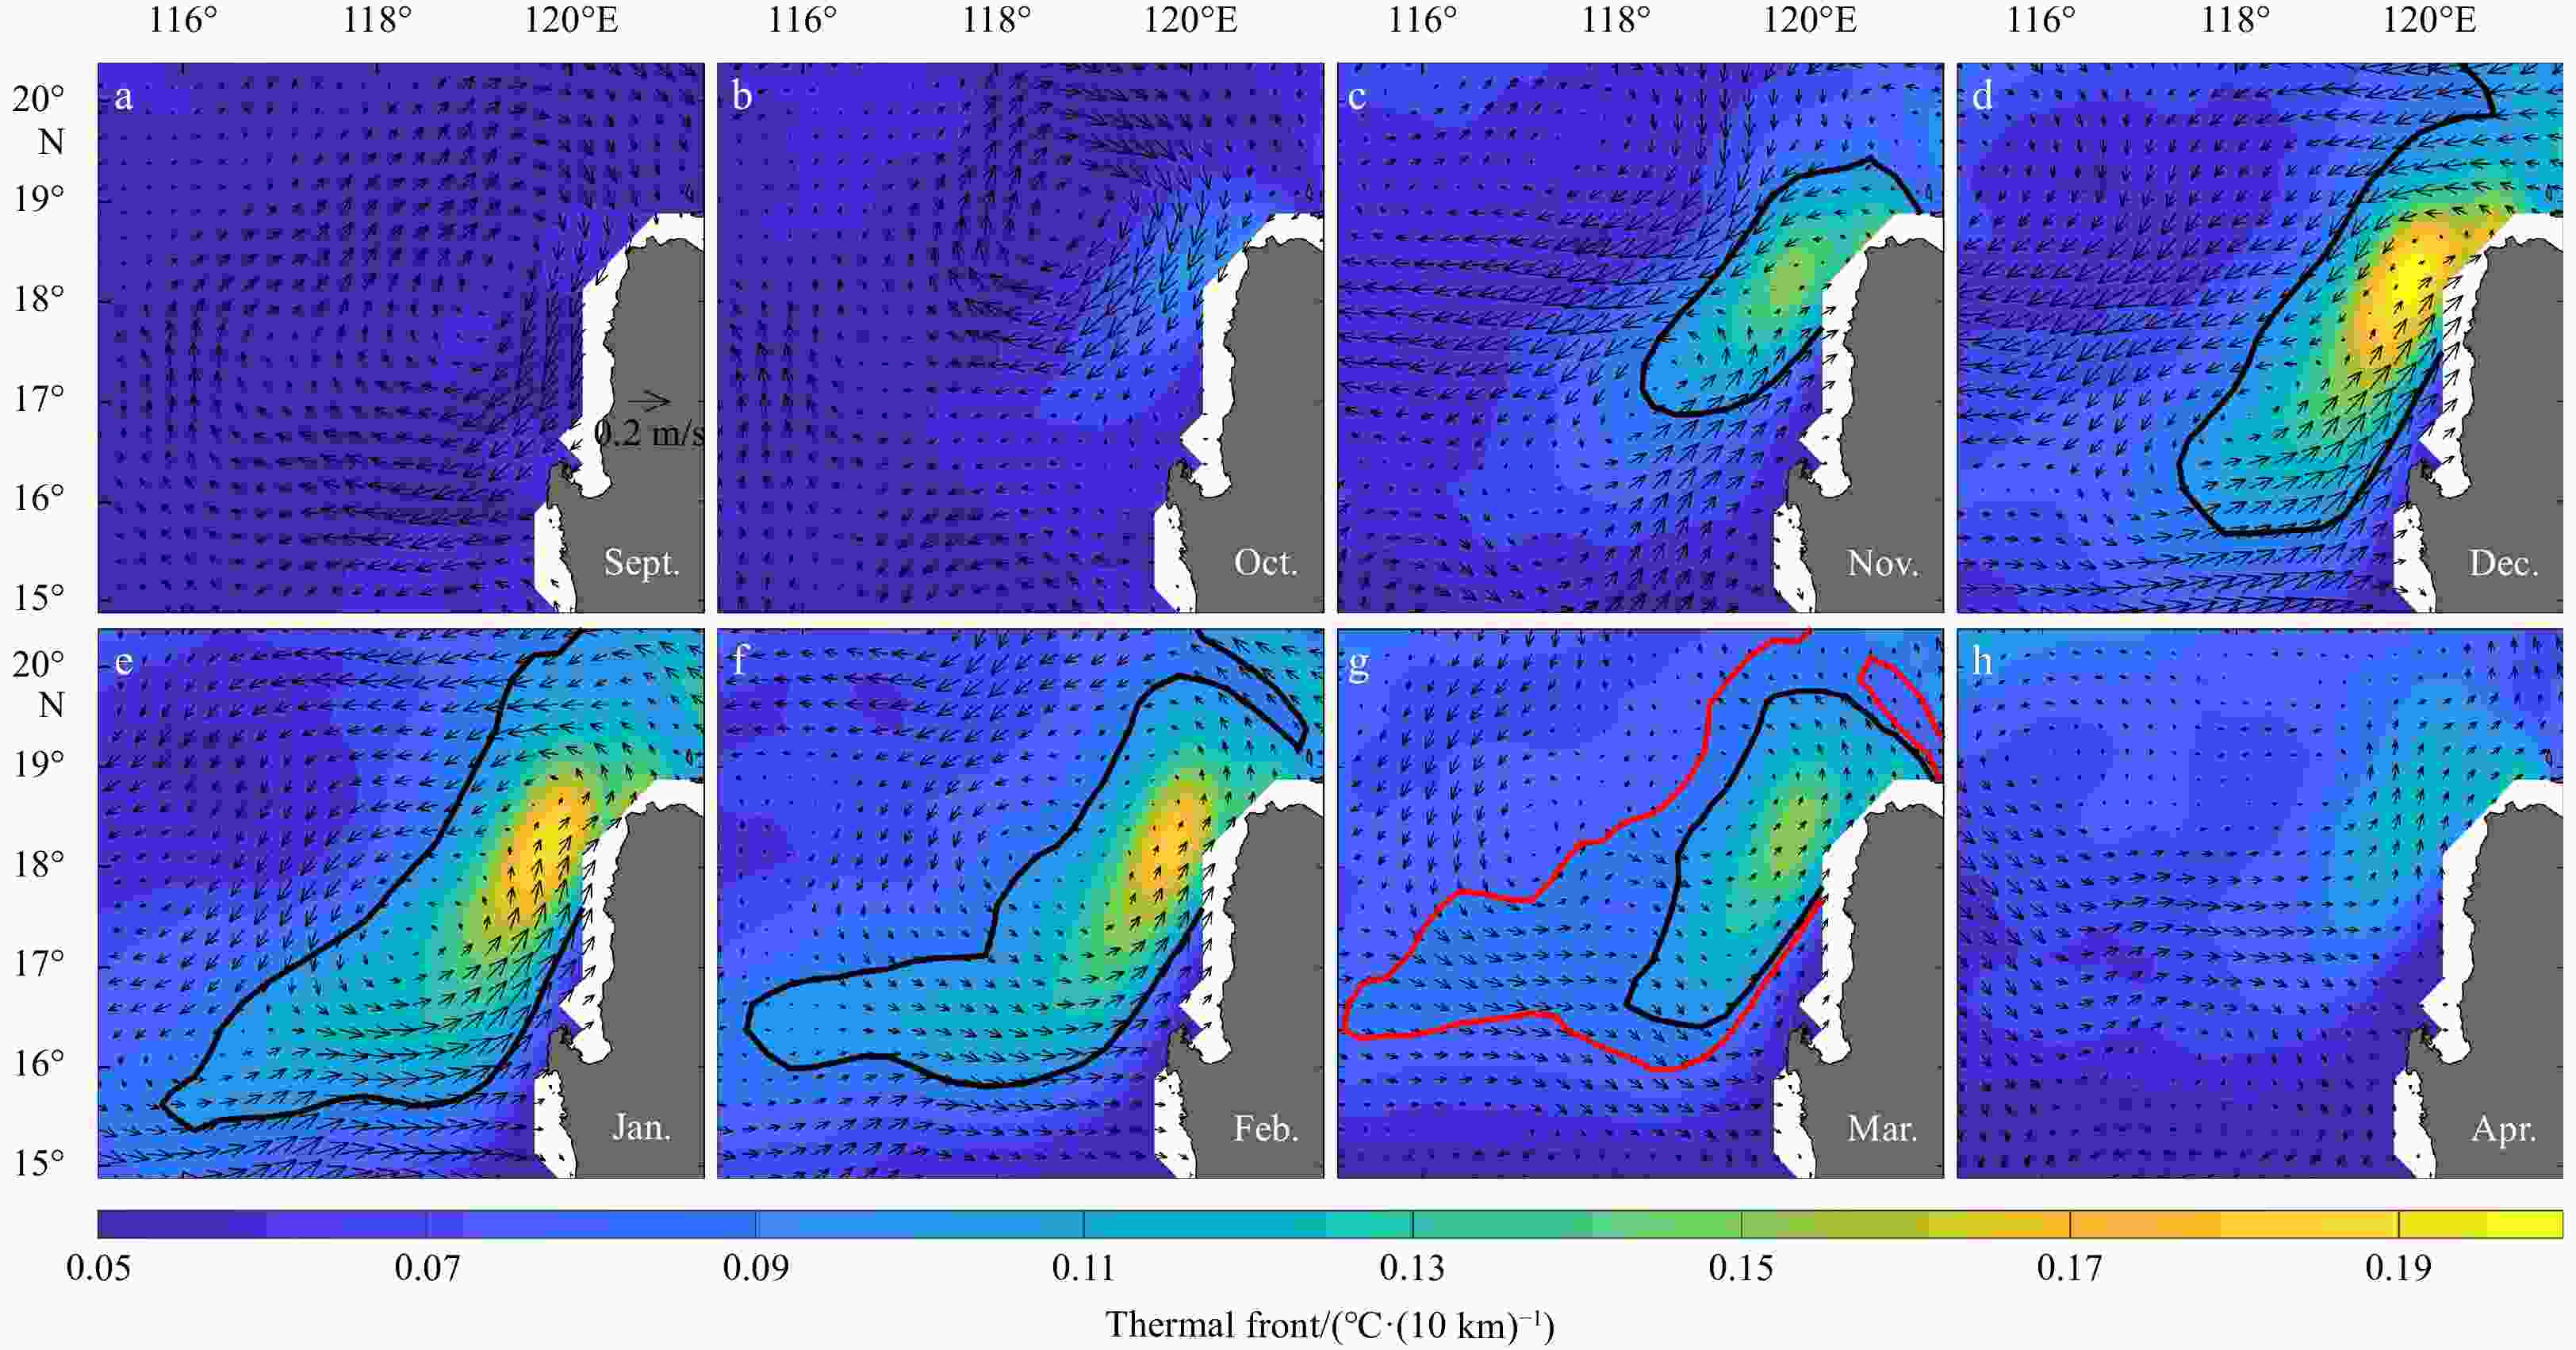
Figure 10. Seasonal variation of the thermal front and geostrophic current anomaly (unit: m/s) northwest of Luzon Island. The black solid line in each subgraph represents the 0.1℃/(10 km) contours of the thermal front. The red solid line in g represents the 0.09℃/(10 km) contour of gradient magnitude.
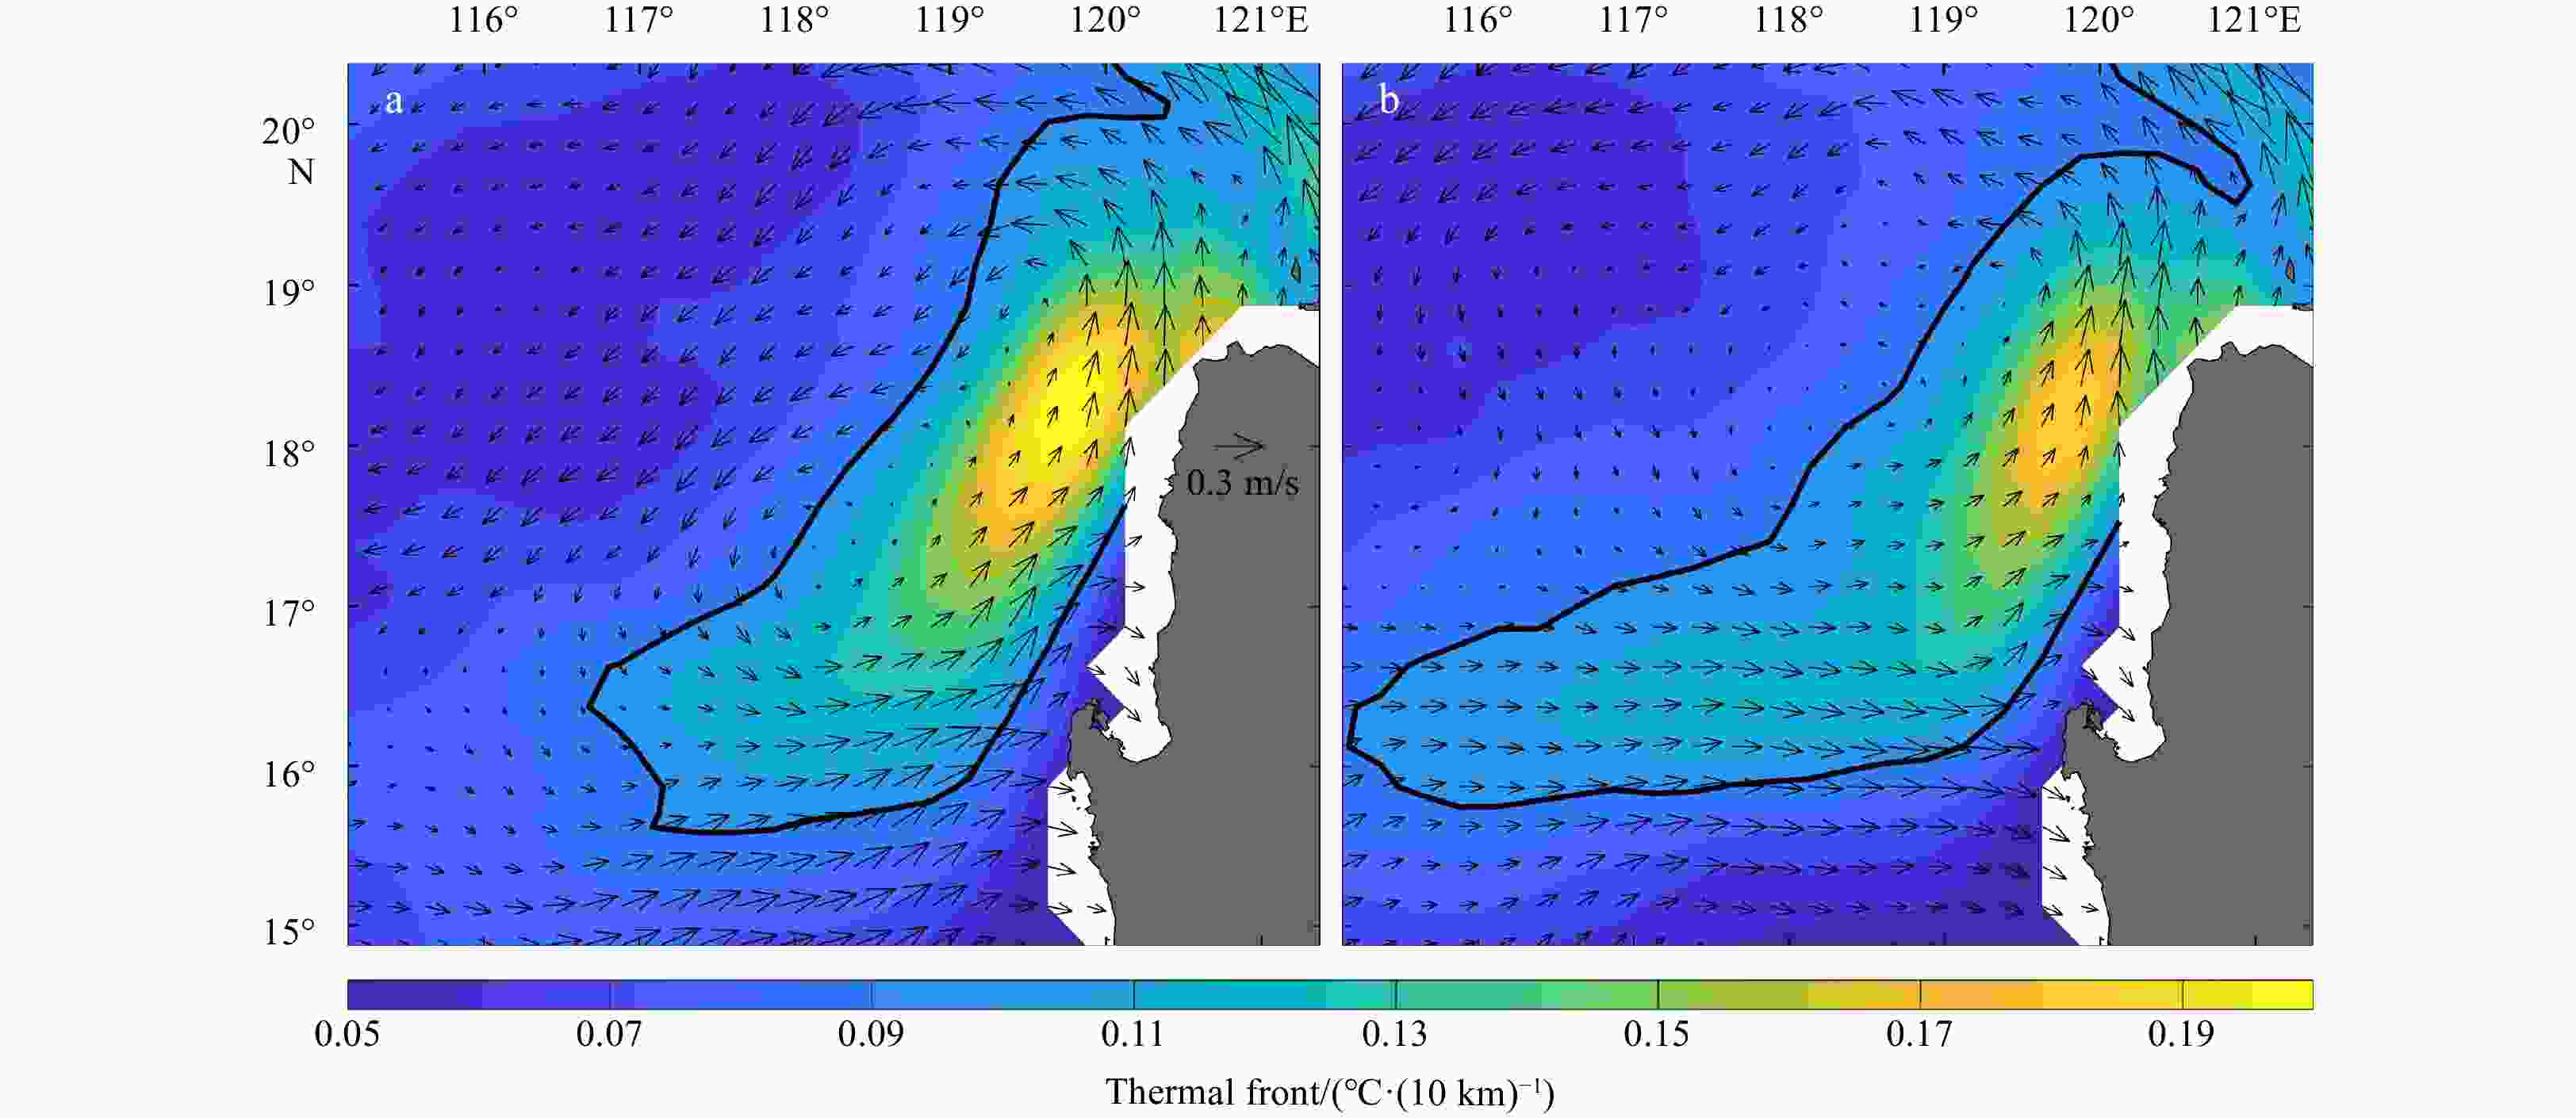
Figure 11. Spatial distribution of the thermal front and geostrophic current anomaly (unit: m/s) for elliptical mode of the Luzon cold eddy (LCE) based on self-organizing map (SOM) analysis (a); circular mode of the LCE based on SOM analysis (b). The black solid line represents the 0.1℃/(10 km) contours of the thermal front.
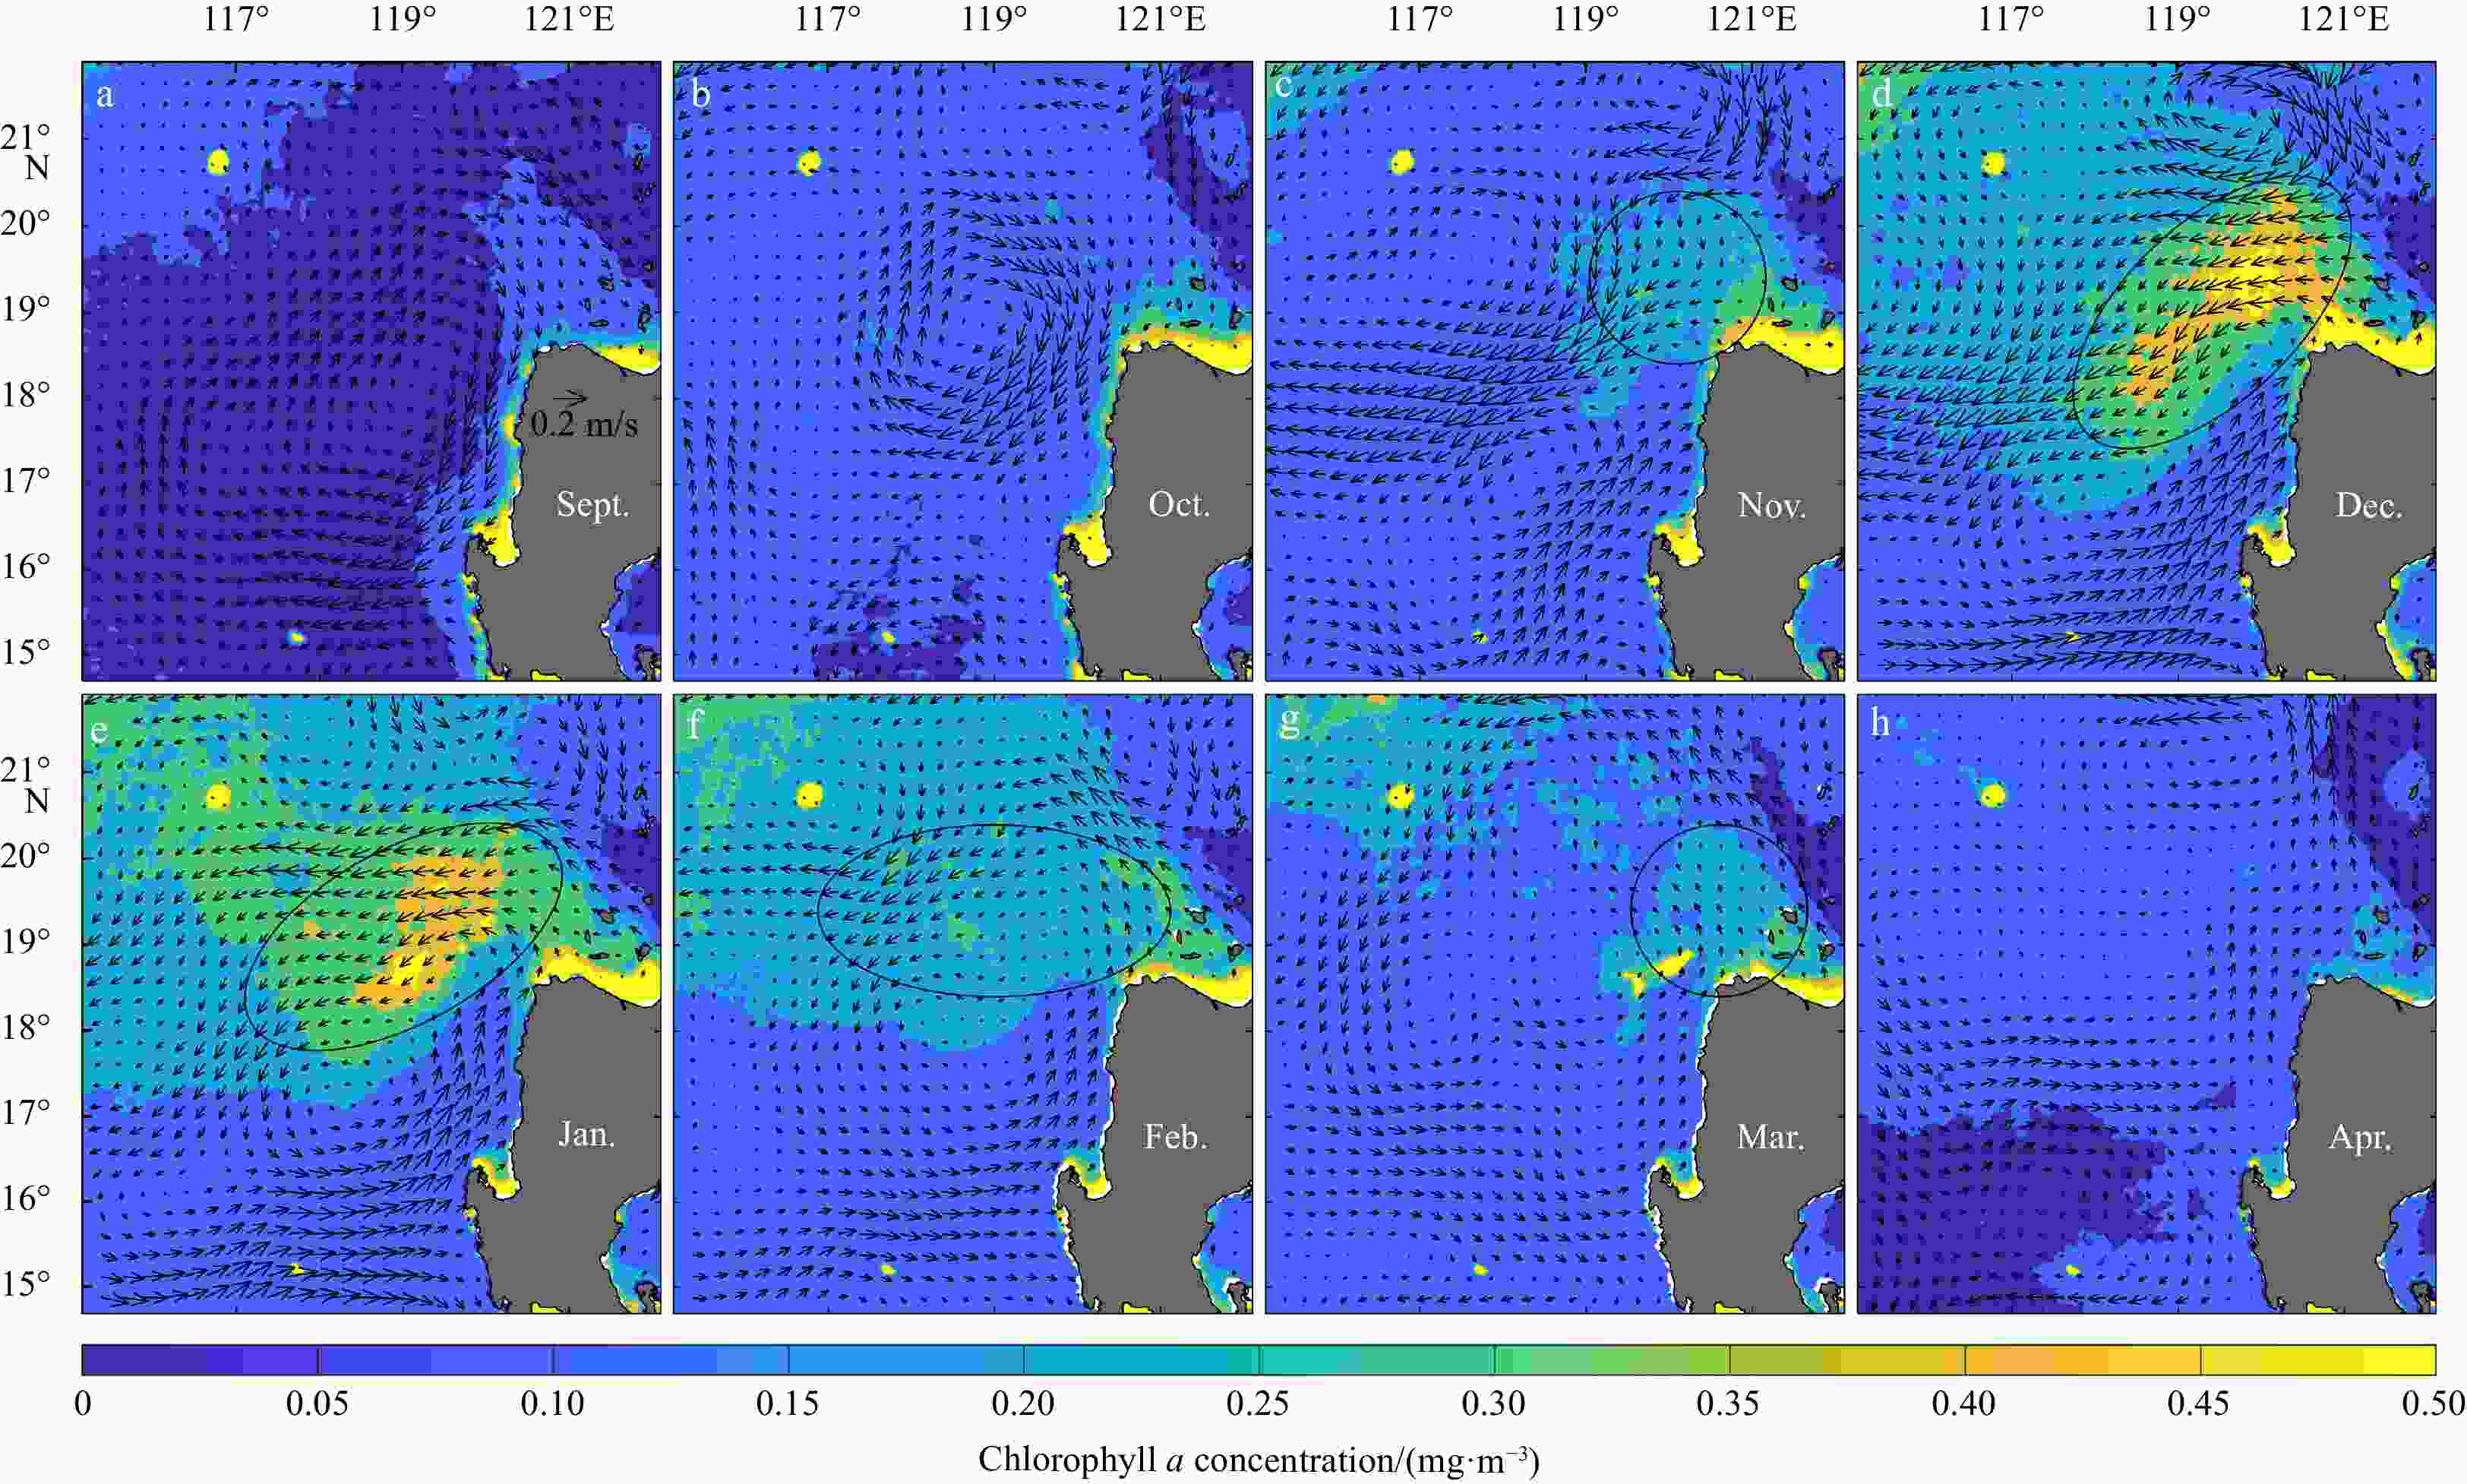
Figure 12. Seasonal variation of chlorophyll a concentration and geostrophic current anomaly (unit: m/s) northwest of Luzon Island. The black circular or elliptic lines are used to indicate the shape and location of chlorophyll a.
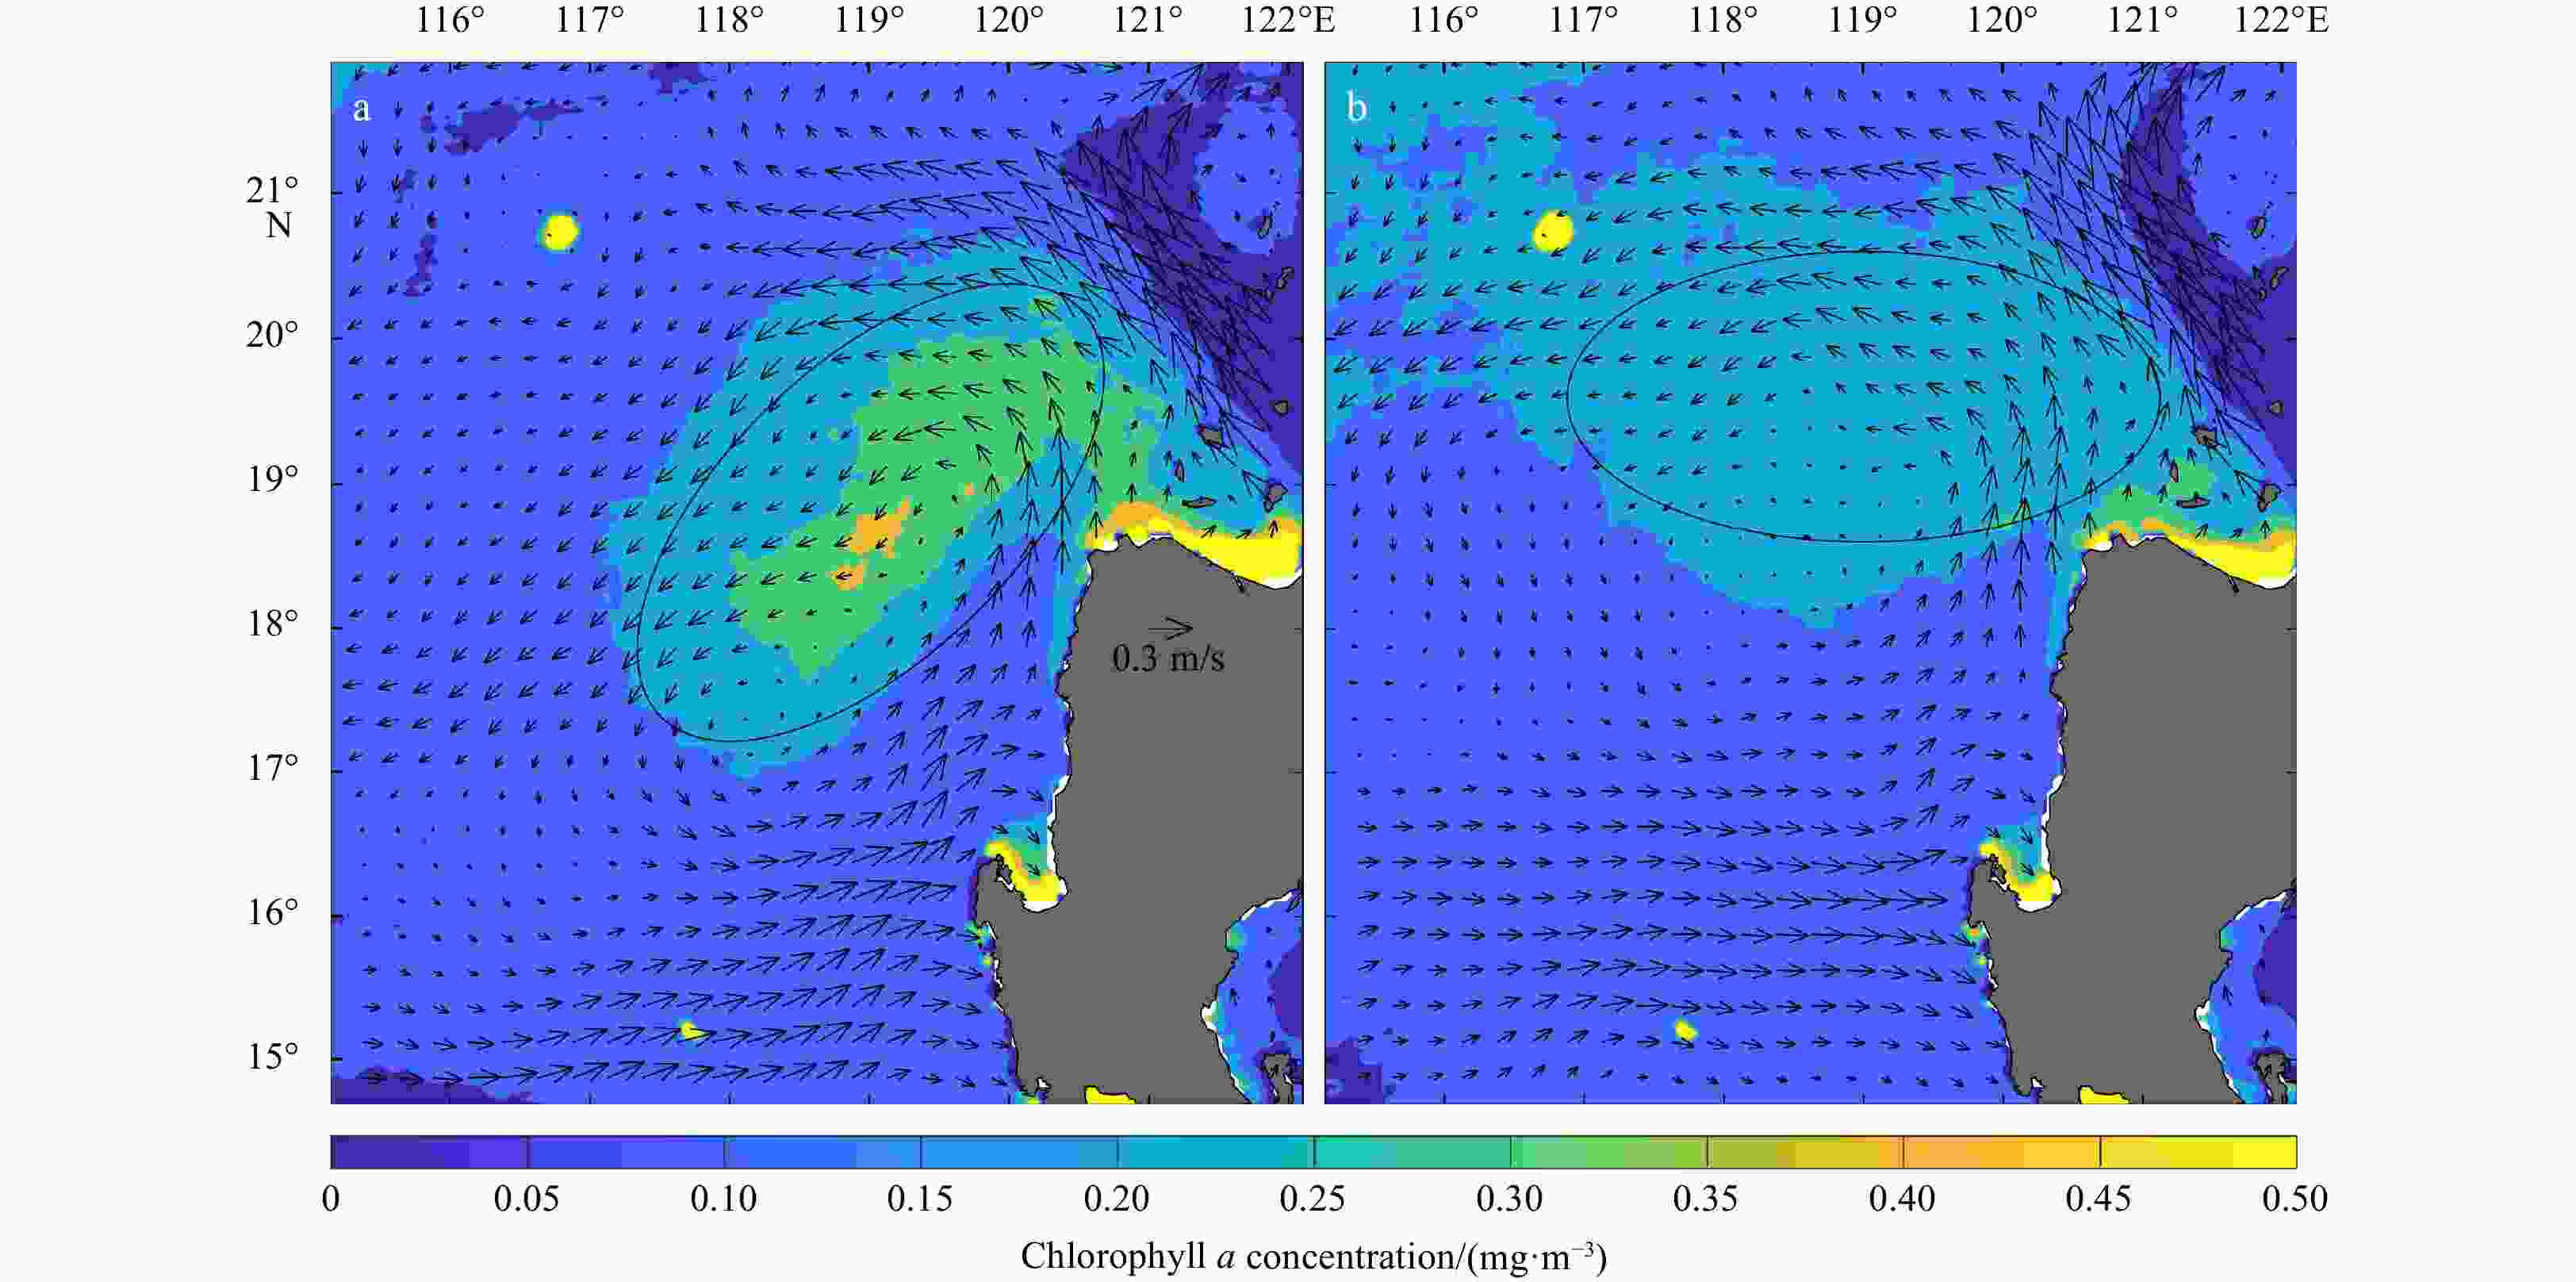
Figure 13. Spatial distribution of chlorophyll a concentration and geostrophic current anomaly (unit: m/s) for elliptical mode of the Luzon cold eddy (LCE) based on self-organizing map (SOM) analysis (a); circular mode of the LCE based on SOM analysis (b). The black elliptic lines are used to indicate the shape and location of chlorophyll a.
-
Atlas R, Hoffman R N, Ardizzone J, et al. 2011. A cross-calibrated, multiplatform ocean surface wind velocity product for meteorological and oceanographic applications. Bulletin of the American Meteorological Society, 92(2): 157–174. doi: 10.1175/2010BAMS2946.1 Belkin I, Cornillon P. 2003. SST fronts of the Pacific coastal and marginal seas. Pacific Oceanography, 1(2): 90–113 Caruso M J, Gawarkiewicz G G, Beardsley R C. 2006. Interannual variability of the Kuroshio intrusion in the South China Sea. Journal of Oceanography, 62(4): 559–575. doi: 10.1007/s10872-006-0076-0 Chang Yi, Shieh Wei-Juan, Lee Ming-An, et al. 2010. Fine-scale sea surface temperature fronts in wintertime in the northern South China Sea. International Journal of Remote Sensing, 31(17–18): 4807–4818 Chu P C, Edmons N L, Fan Chenwu. 1999. Dynamical mechanisms for the South China Sea seasonal circulation and thermohaline variabilities. Journal of Physical Oceanography, 29(11): 2971–2989. doi: 10.1175/1520-0485(1999)029<2971:DMFTSC>2.0.CO;2 Deng Sijie, Xie Lingling, Zhu Zhenkun, et al. 2022. Interannual variation of the Luzon cold eddy and its mechanism. Advances in Marine Science (in Chinese), 40(1): 13–26 Ducet N, Le Traon P Y, Reverdin G. 2000. Global high-resolution mapping of ocean circulation from TOPEX/Poseidon and ERS-1 and -2. Journal of Geophysical Research, 105(C8): 19477–19498. doi: 10.1029/2000JC900063 Gao Hui, Zhao Hui, Han Guoqi, et al. 2021. Spatio-temporal variations of winter phytoplankton blooms northwest of the Luzon Island in the South China Sea. Frontiers in Marine Science, 8: 637499. doi: 10.3389/fmars.2021.637499 Gu Chao, Li Hong, Xu Fanghua, et al. 2018. Numerical study of Jiulongjiang river plume in the wet season 2015. Regional Studies in Marine Science, 24: 82–96. doi: 10.1016/j.rsma.2018.07.004 He Yinghui, Xie Jieshuo, Cai Shuqun. 2016. Interannual variability of winter eddy patterns in the eastern South China Sea. Geophysical Research Letters, 43(10): 5185–5193. doi: 10.1002/2016GL068842 Hu Chuanmin, Lee Zhongping, Franz B. 2012. Chlorophyll a algorithms for oligotrophic oceans: a novel approach based on three-band reflectance difference. Journal of Geophysical Research, 117(C1): C01011 Huang Boyin, Liu Chunying, Banzon V, et al. 2021. Improvements of the daily Optimum Interpolation Sea Surface Temperature (DOISST) version 2.1. Journal of Climate, 34(8): 2923–2939. doi: 10.1175/JCLI-D-20-0166.1 Hwang Cheinway, Chen Sung-An. 2000. Circulations and eddies over the South China Sea derived from TOPEX/Poseidon altimetry. Journal of Geophysical Research, 105(C10): 23943–23965. doi: 10.1029/2000JC900092 Jia Yinglai, Liu Qinyu. 2004. Eddy shedding from the Kuroshio bend at Luzon Strait. Journal of Oceanography, 60(6): 1063–1069. doi: 10.1007/s10872-005-0014-6 Kohonen T. 2001. Self-Organizing Maps. 3rd ed. Berlin: Springer Press, 501 Liu K K, Chao S Y, Shaw P T, et al. 2002. Monsoon-forced chlorophyll distribution and primary production in the South China Sea: observations and a numerical study. Deep-Sea Research Part I: Oceanographic Research Papers, 49(8): 1387–1412. doi: 10.1016/S0967-0637(02)00035-3 Liu Qinyu, Jiang Xia, Xie Shangping, et al. 2004. A gap in the Indo-Pacific warm pool over the South China Sea in boreal winter: seasonal development and interannual variability. Journal of Geophysical Research, 109(7): C07012 Liu Yonggang, Weisberg R H. 2007. Ocean currents and sea surface heights estimated across the West Florida Shelf. Journal of Physical Oceanography, 37(6): 1697–1713. doi: 10.1175/JPO3083.1 Liu Yonggang, Weisberg R H, Mooers C N K. 2006. Performance evaluation of the self-organizing map for feature extraction. Journal of Geophysical Research, 111(C5): C05018 Liu Zhengyu, Yang Haijun, Liu Qinyu. 2001. Regional dynamics of seasonal variability in the South China Sea. Journal of Physical Oceanography, 31(1): 272–284. doi: 10.1175/1520-0485(2001)031<0272:RDOSVI>2.0.CO;2 Lu Wenfang, Wang Jian, Jiang Yuwu, et al. 2022. Data-driven method with numerical model: a combining framework for predicting subtropical river plumes. Journal of Geophysical Research: Oceans, 127(3): e2021JC017925 Lu Wenfang, Yan Xiaohai, Jiang Yuwu. 2015. Winter bloom and associated upwelling Northwest of the Luzon Island: a coupled physical-biological modeling approach. Journal of Geophysical Research: Oceans, 120(1): 533–546. doi: 10.1002/2014JC010218 Martin M C, Villanoy C L. 2007. Sea surface variability of upwelling area Northwest of Luzon, Philippines. In: Tregoning P, Rizos C, eds. Dynamic Planet: Monitoring and Understanding a Dynamic Planet with Geodetic and Oceanographic Tools. Berlin: Springer, 84–87 Mears C A, Scott J, Wentz F J, et al. 2019. A near-real-time version of the Cross-Calibrated Multiplatform (CCMP) ocean surface wind velocity data set. Journal of Geophysical Research: Oceans, 124(10): 6997–7010. doi: 10.1029/2019JC015367 Nan Feng, Xue Huijie, Chai Fei, et al. 2011. Identification of different types of Kuroshio intrusion into the South China Sea. Ocean Dynamics, 61(9): 1291–1304. doi: 10.1007/s10236-011-0426-3 Nan Feng, Xue Huijie, Yu Fei. 2015. Kuroshio intrusion into the South China Sea: a review. Progress in Oceanography, 137: 314–333. doi: 10.1016/j.pocean.2014.05.012 Nitani H. 1970. Oceanographic conditions in the Sea, Philippines and Luzon Strait in Summer of 1965 and 1966. In: Marr J D, ed. The Kuroshio: A Symposium on the Japan Current. Honolulu: East West Centre Press, 213–232 Pujol M. 2022. Product user manual for sea level SLA products. Copernicus Monitoring Environment Marine Service (CMEMS). https://catalogue.marine.copernicus.eu/documents/PUM/CMEMS-SL-PUM-008-032-068.pdf[2022-11-1] Qu Tangdong. 2000. Upper-layer circulation in the South China Sea. Journal of Physical Oceanography, 30(6): 1450–1460. doi: 10.1175/1520-0485(2000)030<1450:ULCITS>2.0.CO;2 Roemmich D, Gilson J. 2001. Eddy transport of heat and thermocline waters in the North Pacific: a key to interannual/decadal climate variability?. Journal of Physical Oceanography, 31(3): 675–687 Shaw Ping-Tung, Chao Shenn-Yu, Liu Kon-Kee, et al. 1996. Winter upwelling off Luzon in the northeastern South China Sea. Journal of Geophysical Research: Oceans, 101(C7): 16435–16448. doi: 10.1029/96JC01064 Sun Ruili, Gu Yanzhen, Li Peiliang, et al. 2016a. Statistical characteristics and formation mechanism of the Lanyu cold eddy. Journal of Oceanography, 72(4): 641–649. doi: 10.1007/s10872-016-0361-5 Sun Ruili, Li Peiliang, Gu Yanzhen, et al. 2022. Counter-rotating eddy pair in the Luzon Strait. Ocean Science, 18(3): 717–728. doi: 10.5194/os-18-717-2022 Sun Ruili, Ling Zheng, Chen Changlin, et al. 2015. Interannual variability of thermal front west of Luzon Island in boreal winter. Acta Oceanologica Sinica, 34(11): 102–108. doi: 10.1007/s13131-015-0753-1 Sun Chengxue, Liu Qinyu. 2011. Double eddy structure of the winter Luzon Cold Eddy based on satellite altimeter data. Journal of Tropical Oceanography (in Chinese), 30(3): 9–15 Sun Ruili, Wang Guihua, Chen Changlin. 2016b. The Kuroshio bifurcation associated with islands at the Luzon Strait. Geophysical Research Letters, 43(11): 5768–5774. doi: 10.1002/2016GL069652 Sun Ruili, Zhai Fangguo, Gu Yanzhen. 2018. The Four patterns of the East Branch of the Kuroshio bifurcation in the Luzon Strait. Water, 10(12): 1822. doi: 10.3390/w10121822 Tang Danling, Ni I H, Kester D R, et al. 1999. Remote sensing observations of winter phytoplankton blooms Southwest of the Luzon Strait in the South China Sea. Marine Ecology Progress Series, 191: 43–51. doi: 10.3354/meps191043 Tsui I-Fong, Wu Chau-Ron. 2012. Variability analysis of Kuroshio intrusion through Luzon Strait using growing hierarchical self-organizing map. Ocean Dynamics, 62(8): 1187–1194. doi: 10.1007/s10236-012-0558-0 Udarbe-Walker M J B, Villanoy C L. 2001. Structure of potential upwelling areas in the Philippines. Deep-Sea Research Part I: Oceanographic Research Papers, 48(6): 1499–1518. doi: 10.1016/S0967-0637(00)00100-X Wang Guihua, Chen Dake, Su Jilan. 2008. Winter eddy genesis in the eastern South China Sea due to orographic wind jets. Journal of Physical Oceanography, 38(3): 726–732. doi: 10.1175/2007JPO3868.1 Wang Guihua, Li Jiaxun, Wang Chunzai, et al. 2012. Interactions among the winter monsoon, ocean eddy and ocean thermal front in the South China Sea. Journal of Geophysical Research: Oceans, 117(C8): C08002 Wang Guihua, Su Jilan, Chu P C. 2003. Mesoscale eddies in the South China Sea observed with altimeter data. Geophysical Research Letters, 30(21): 2121. doi: 10.1029/2003GL018532 Wang Jiujuan, Tang Danling, Sui Yi. 2010. Winter phytoplankton bloom induced by subsurface upwelling and mixed layer entrainment southwest of Luzon Strait. Journal of Marine Systems, 83(3–4): 141–149 Zhang Zhiwei, Zhao Wei, Qiu Bo, et al. 2017. Anticyclonic eddy sheddings from Kuroshio Loop and the accompanying cyclonic eddy in the northeastern South China Sea. Journal of Physical Oceanography, 47(6): 1243–1259. doi: 10.1175/JPO-D-16-0185.1 Zheng Zhewen, Ho C R, Kuo N J. 2007. Mechanism of weakening of west Luzon eddy during La Niña years. Geophysical Research Letters, 34(11): L11604. doi: 10.1029/2007GL030058 -

 下载:
下载:


 点击查看大图

计量
- 文章访问数: 268
- HTML全文浏览量: 95
- PDF下载量: 28
- 被引次数: 0

