

Origin of hydrocarbon fluids and discussion of abnormal carbon isotopic compositions in the Lishui-Jiaojiang Sag, East China Sea Shelf Basin
-
Abstract: The hydrocarbon gases in the L1 gas field of the Lishui-Jiaojiang Sag have been commonly interpreted to be an accumulation of pure sapropelic-type thermogenic gas. In this study, chemical components, stable isotopic compositions, and light hydrocarbons were utilized to shed light on the origins of the hydrocarbon fluids in the L1 gas pool. The hydrocarbon fluids in the L1 gas pool are proposed to be a mixture of three unique components: mid-maturity oil from the middle Paleocene coastal marine Lingfeng source rock, oil-associated (late oil window) gas generated from the lower Paleocene lacustrine Yueguifeng source rock, and primary microbial gas from the paralic deposits of the upper Paleocene Mingyuefeng source rock. Here, for the first time, the hydrocarbon gases in the L1 gas pool are diagnosed as mixed oil-associated sapropelic-type gas and microbial gas via four pieces of principal evidence: (1) The abnormal carbon isotopic distributions of all methane homologues from C1 (CH4 or methane) to C5 (C5H12 or pentane) shown in the Chung plot; (2) the diagnostic 13C-depleted C1 compared with the thermogenic sapropelic-type gas model, while δ13C2 (C2H6 or ethane) and δ13C3 (C3H8 or propane) both fit perfectly; (3) the excellent agreement of the calculated carbon isotopic compositions of the pure thermogenic gas with the results of the thermal simulated gas from the type-II1 kerogen-rich Yueguifeng source rock; and (4) the oil-associated gas inferred from various binary genetic diagrams with an abnormally elevated gas oil ratio. Overall, the natural gases of the L1 gas pool were quantified in this study to comprise approximately 13% microbial gas, nearly 48% oil-associated sapropelic-type gas, and 39% of nonhydrocarbon gas. The microbial gas is interpreted to have been codeposited and entrained in the humic-kerogen-rich Mingyuefeng Formation under favorable low-temperature conditions during the late Paleocene-middle Eocene. The microbial gas subsequently leaked into the structurally and stratigraphically complex L1 trap with oil-associated sapropelic-type gas from the Yueguifeng source rock during the late Eocene−Oligocene uplifting event. A small amount of humic-kerogen-generated oil in the L1 gas pool is most likely to be derived from the underlying Lingfeng source rock. The detailed geological and geochemical considerations of source rocks are discussed to explain the accumulation history of hydrocarbon fluids in the L1 gas pool. This paper, therefore, represents an effort to increase the awareness of the pitfalls of various genetic diagrams, and an integrated geochemical and geological approach is required for hydrocarbon-source correlation.
-
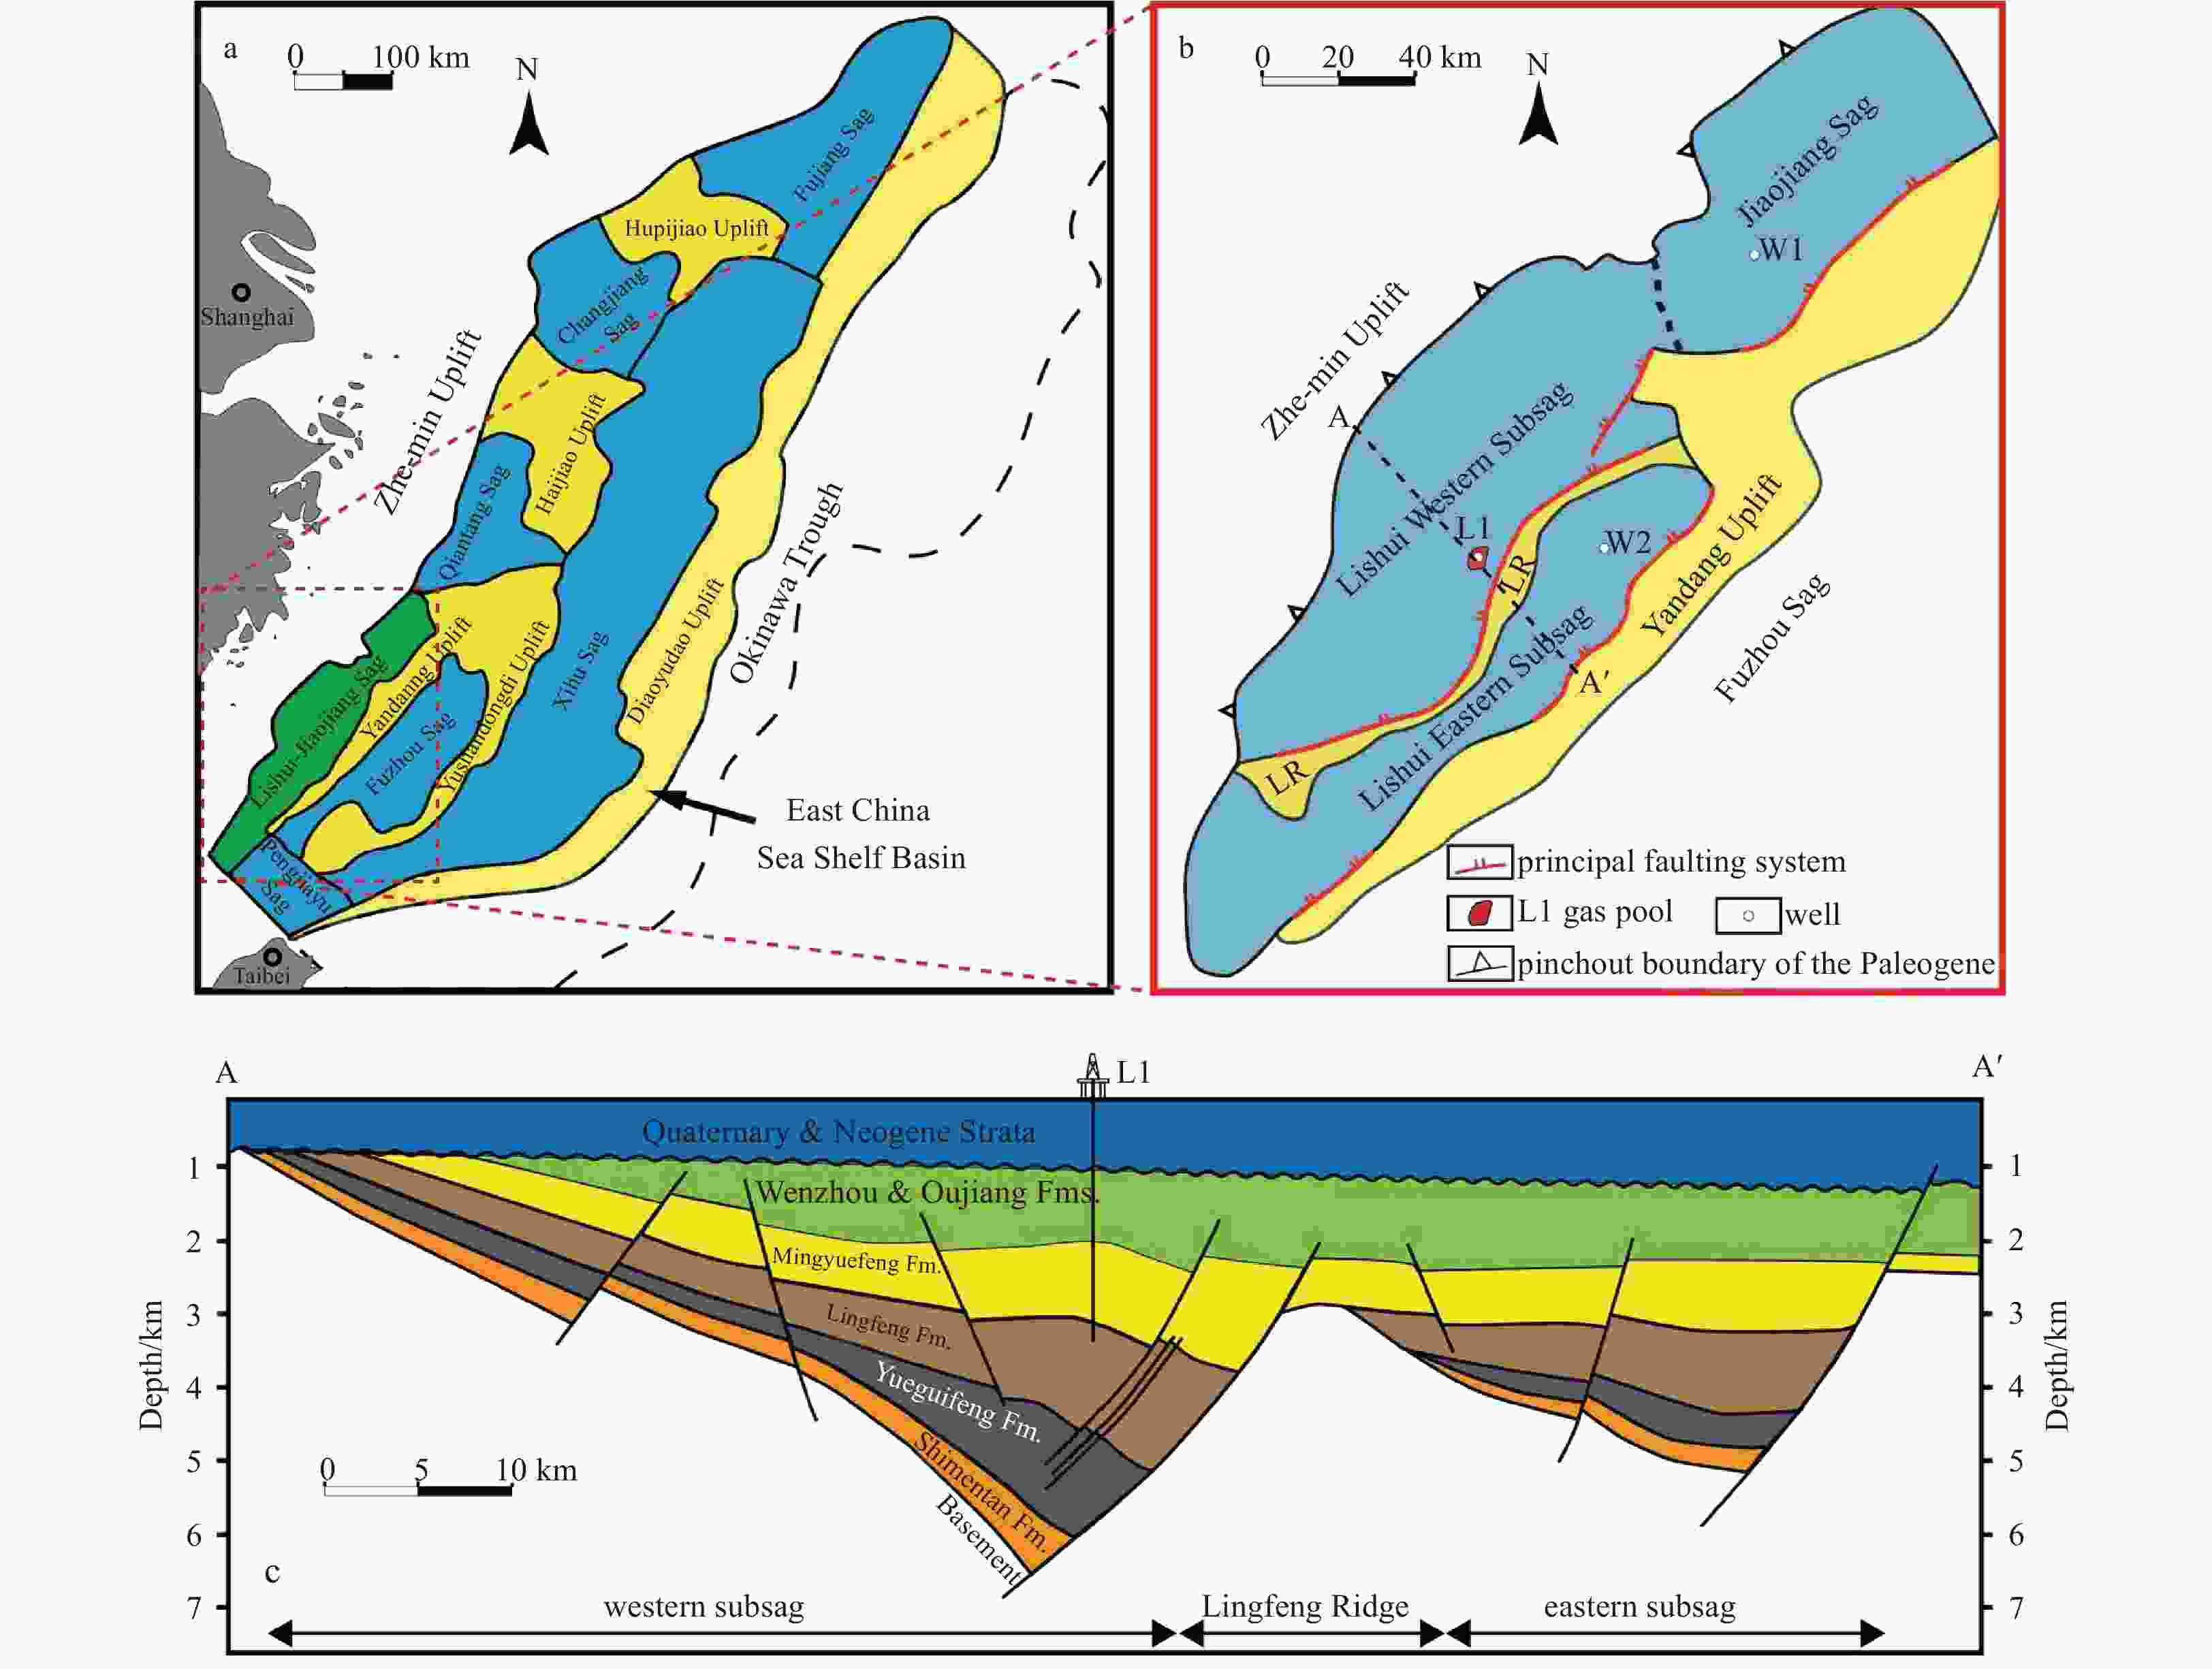
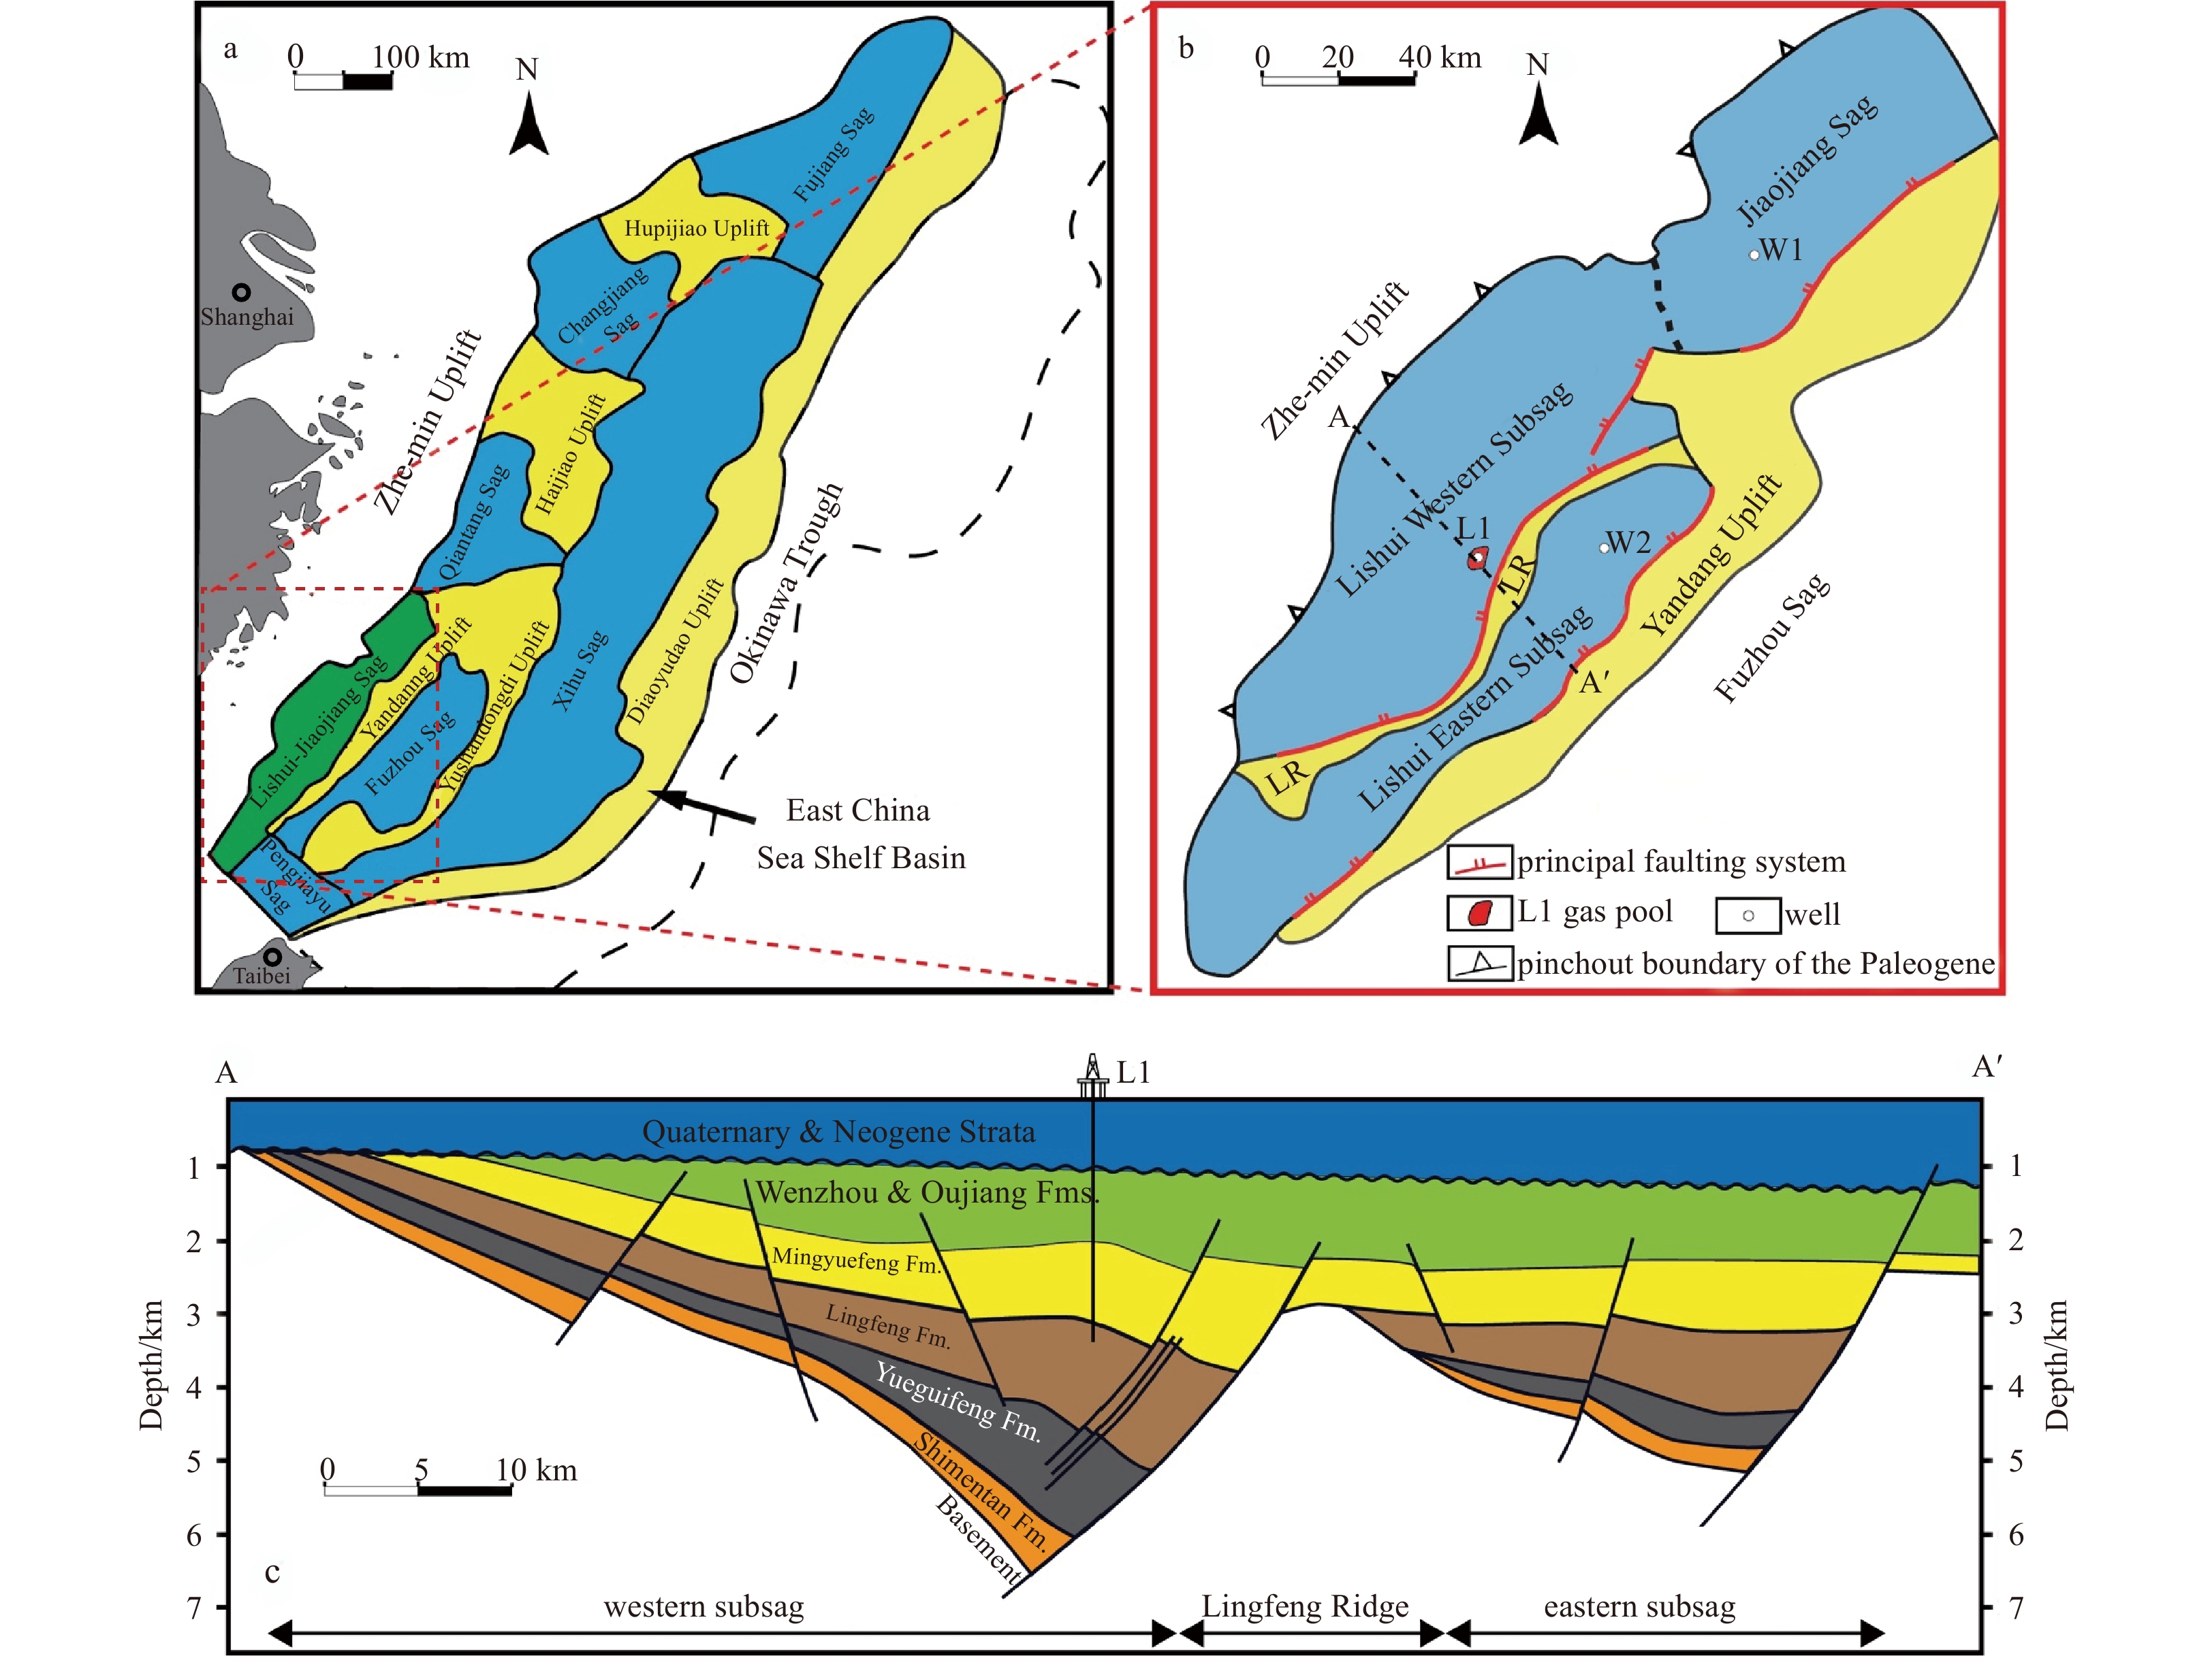
Figure 1. Schematic map showing the location of the Lishui-Jiaojiang Sag (a), major geological structures, L1 gas field, and selected wells in the Lishui-Jiaojiang Sag (b), and geological units and faulting systems in a schematic cross-section (c). Location of c is shown as A–A' in b. Fm., Formation; LR, Lingfeng Ridge.
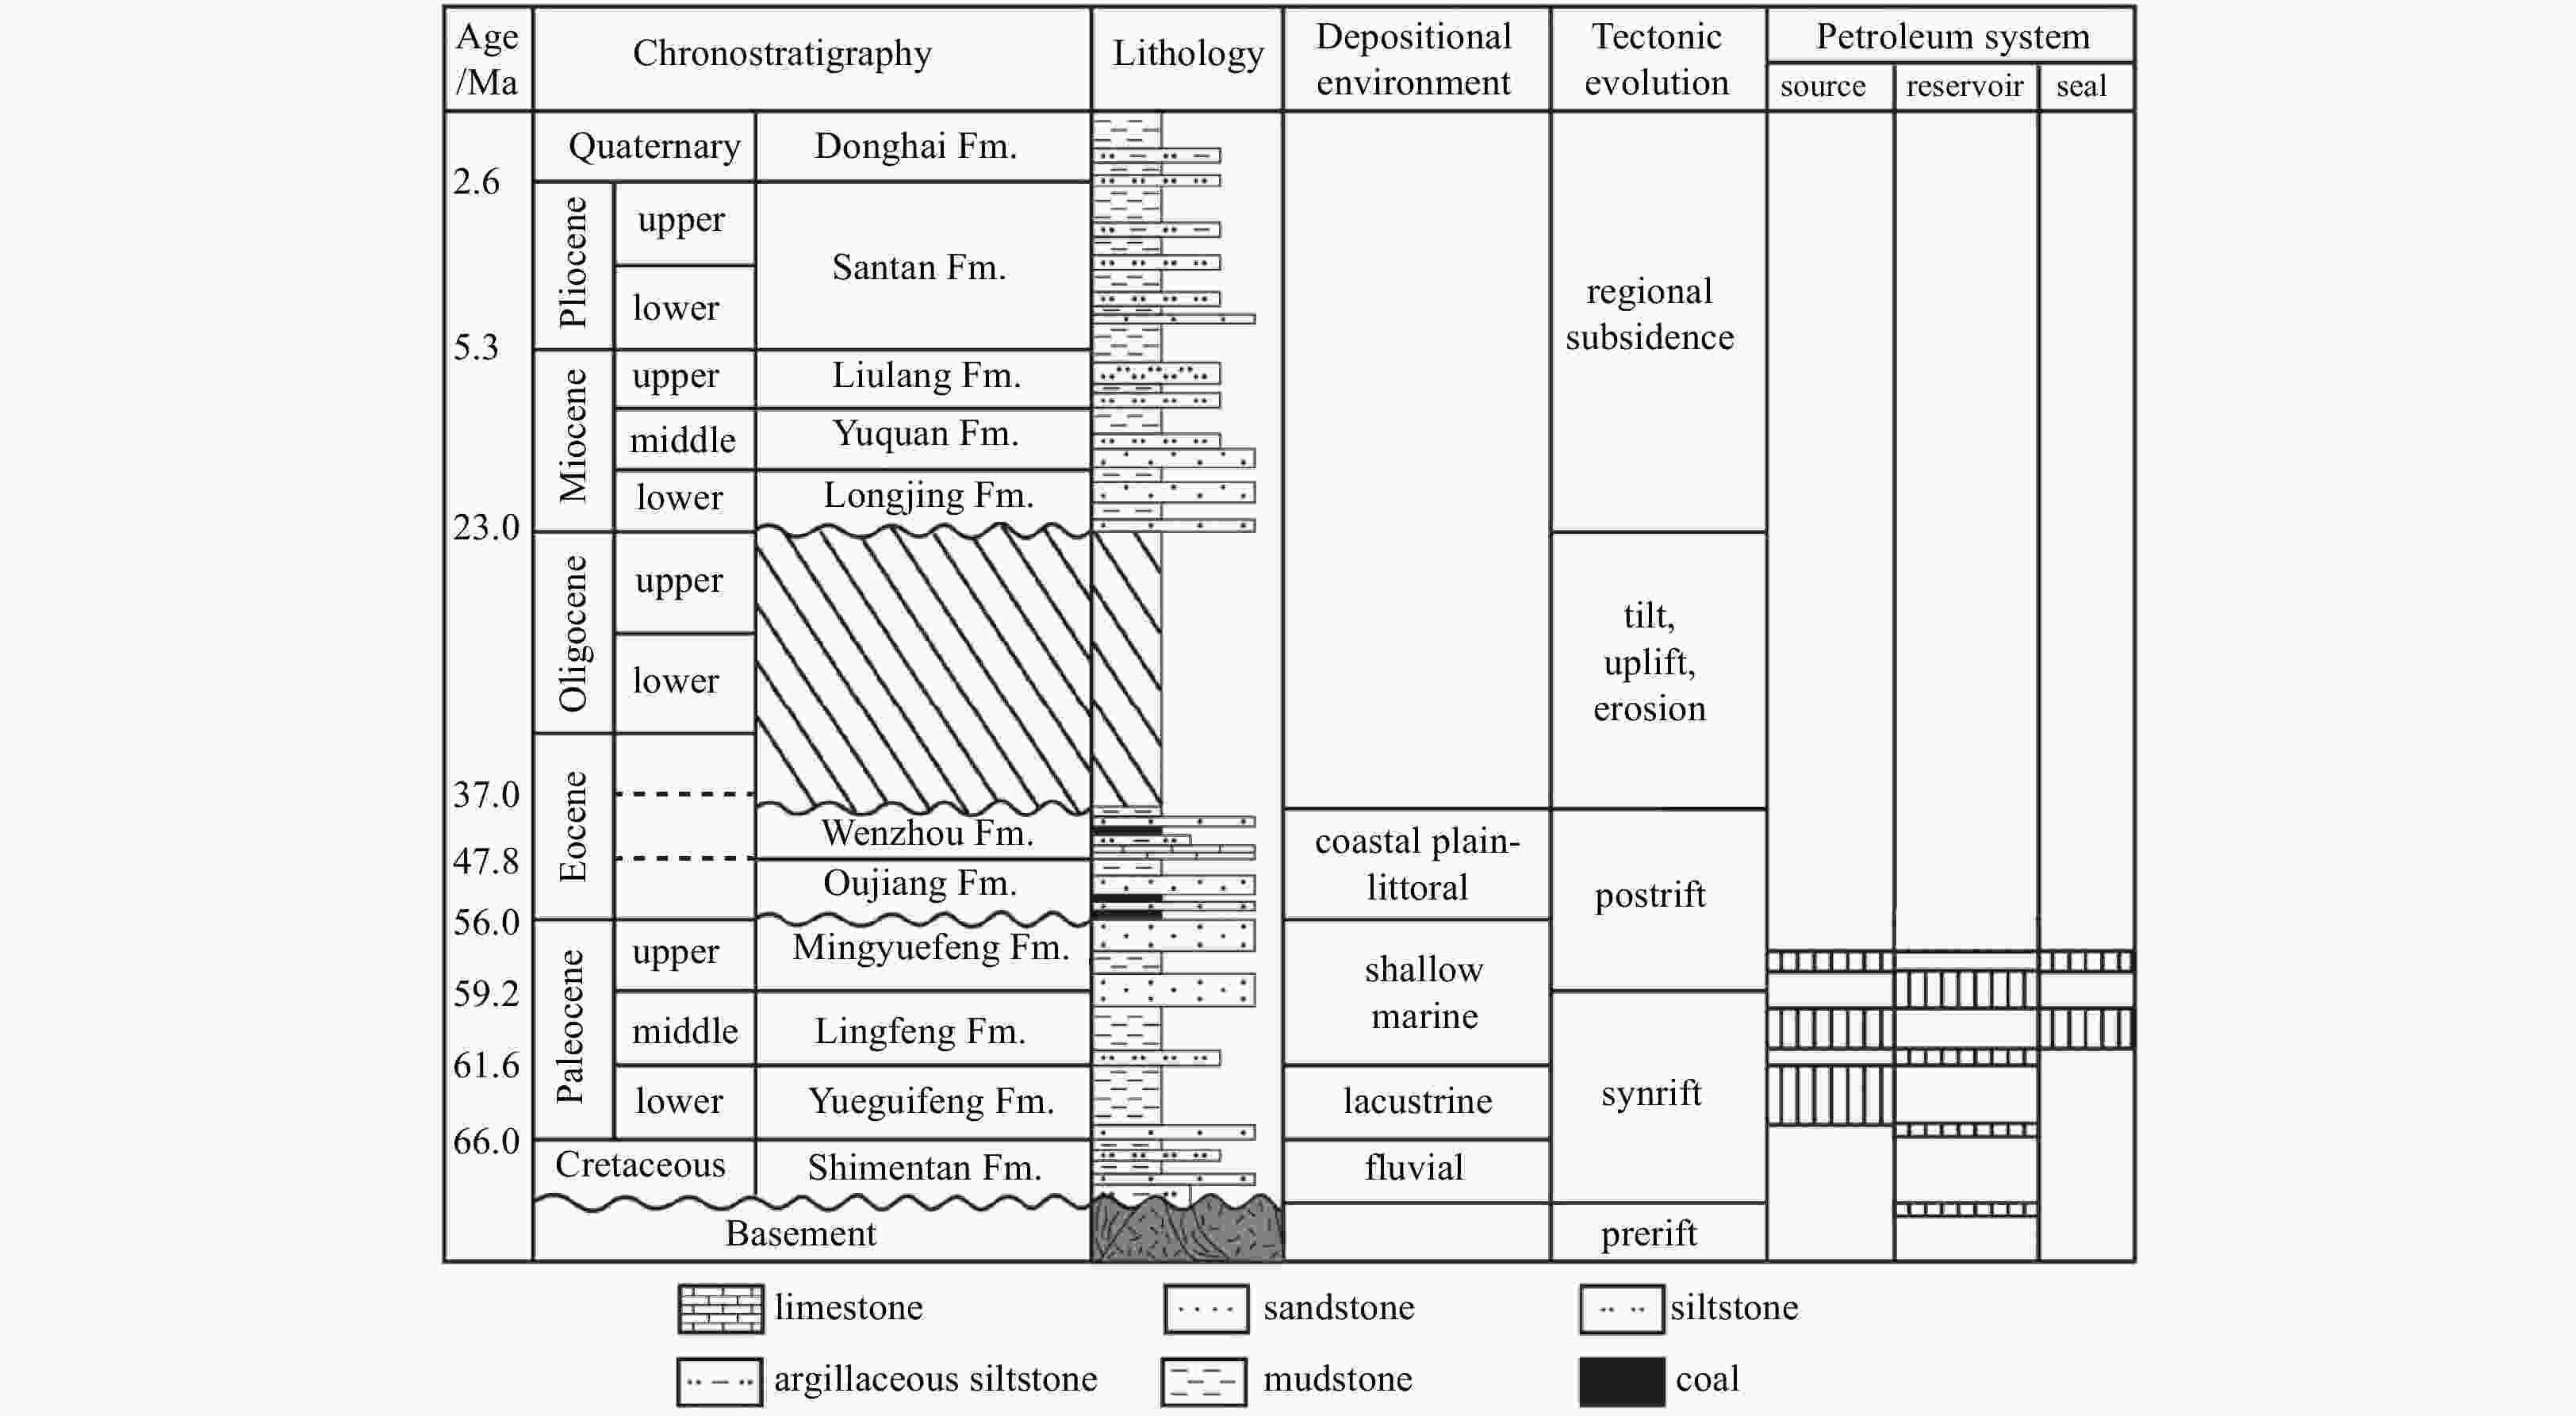
Figure 2. Generalized stratigraphic column, tectonic evolution, and petroleum system of the Lishui-Jiaojiang Sag. Note the thickness of each unit is not to scale. Fm., Formation.

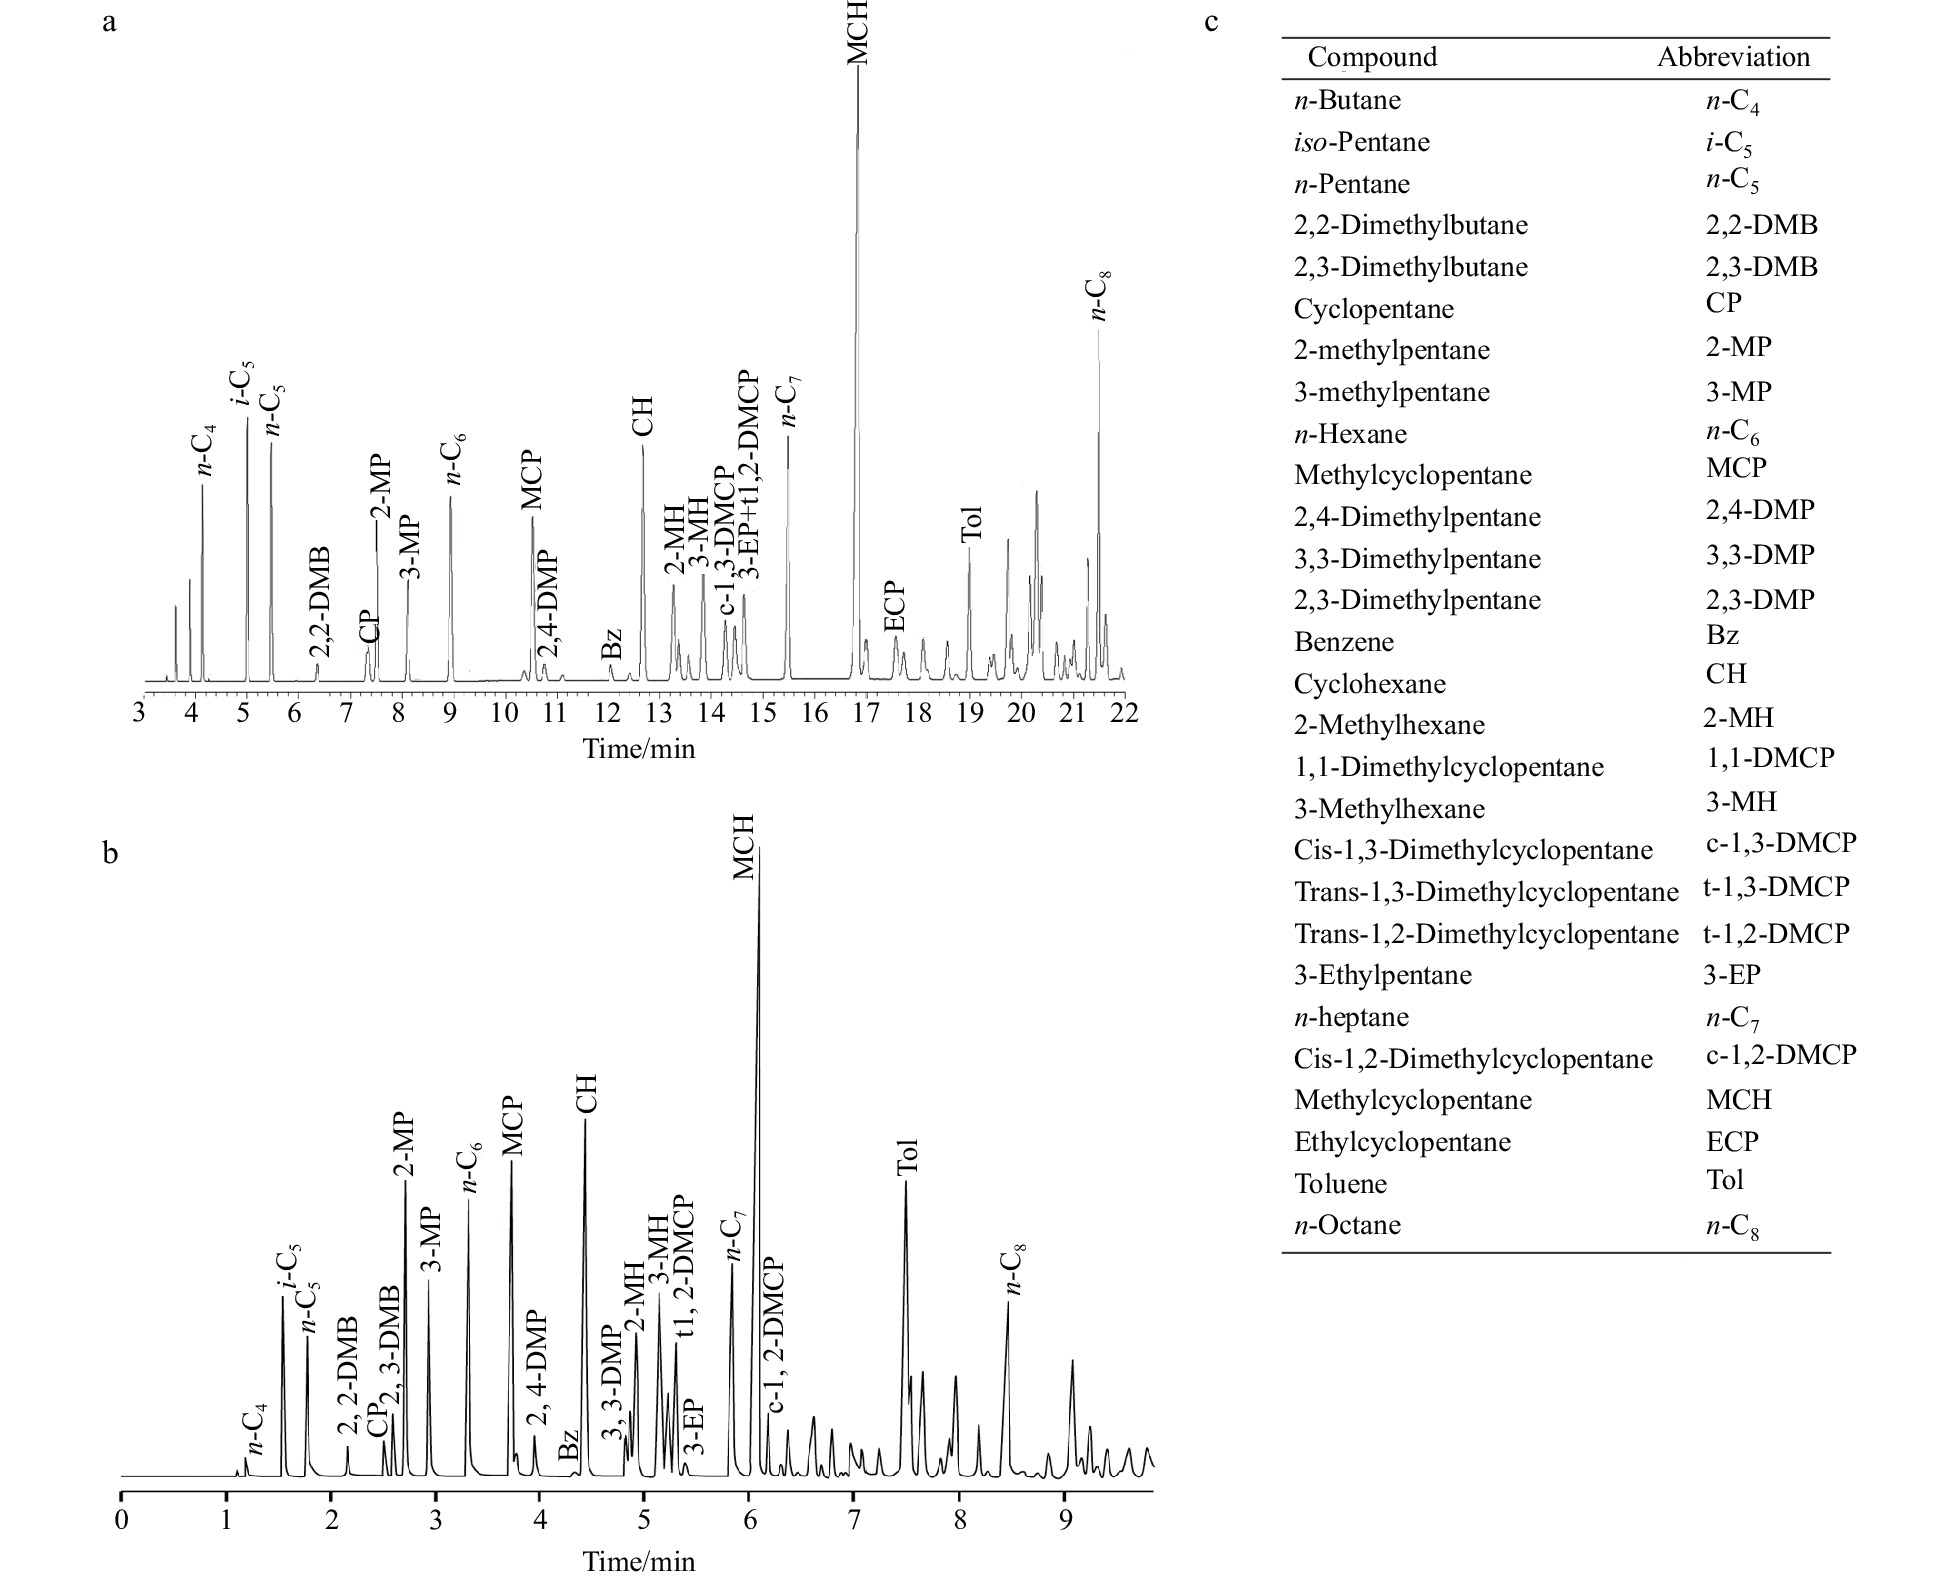
Figure 3. Representative partial whole oil chromatograms of the oil samples from the L1 gas pool. a. Production well; b. DST sample from the discovery well; and c. typical compounds identified.

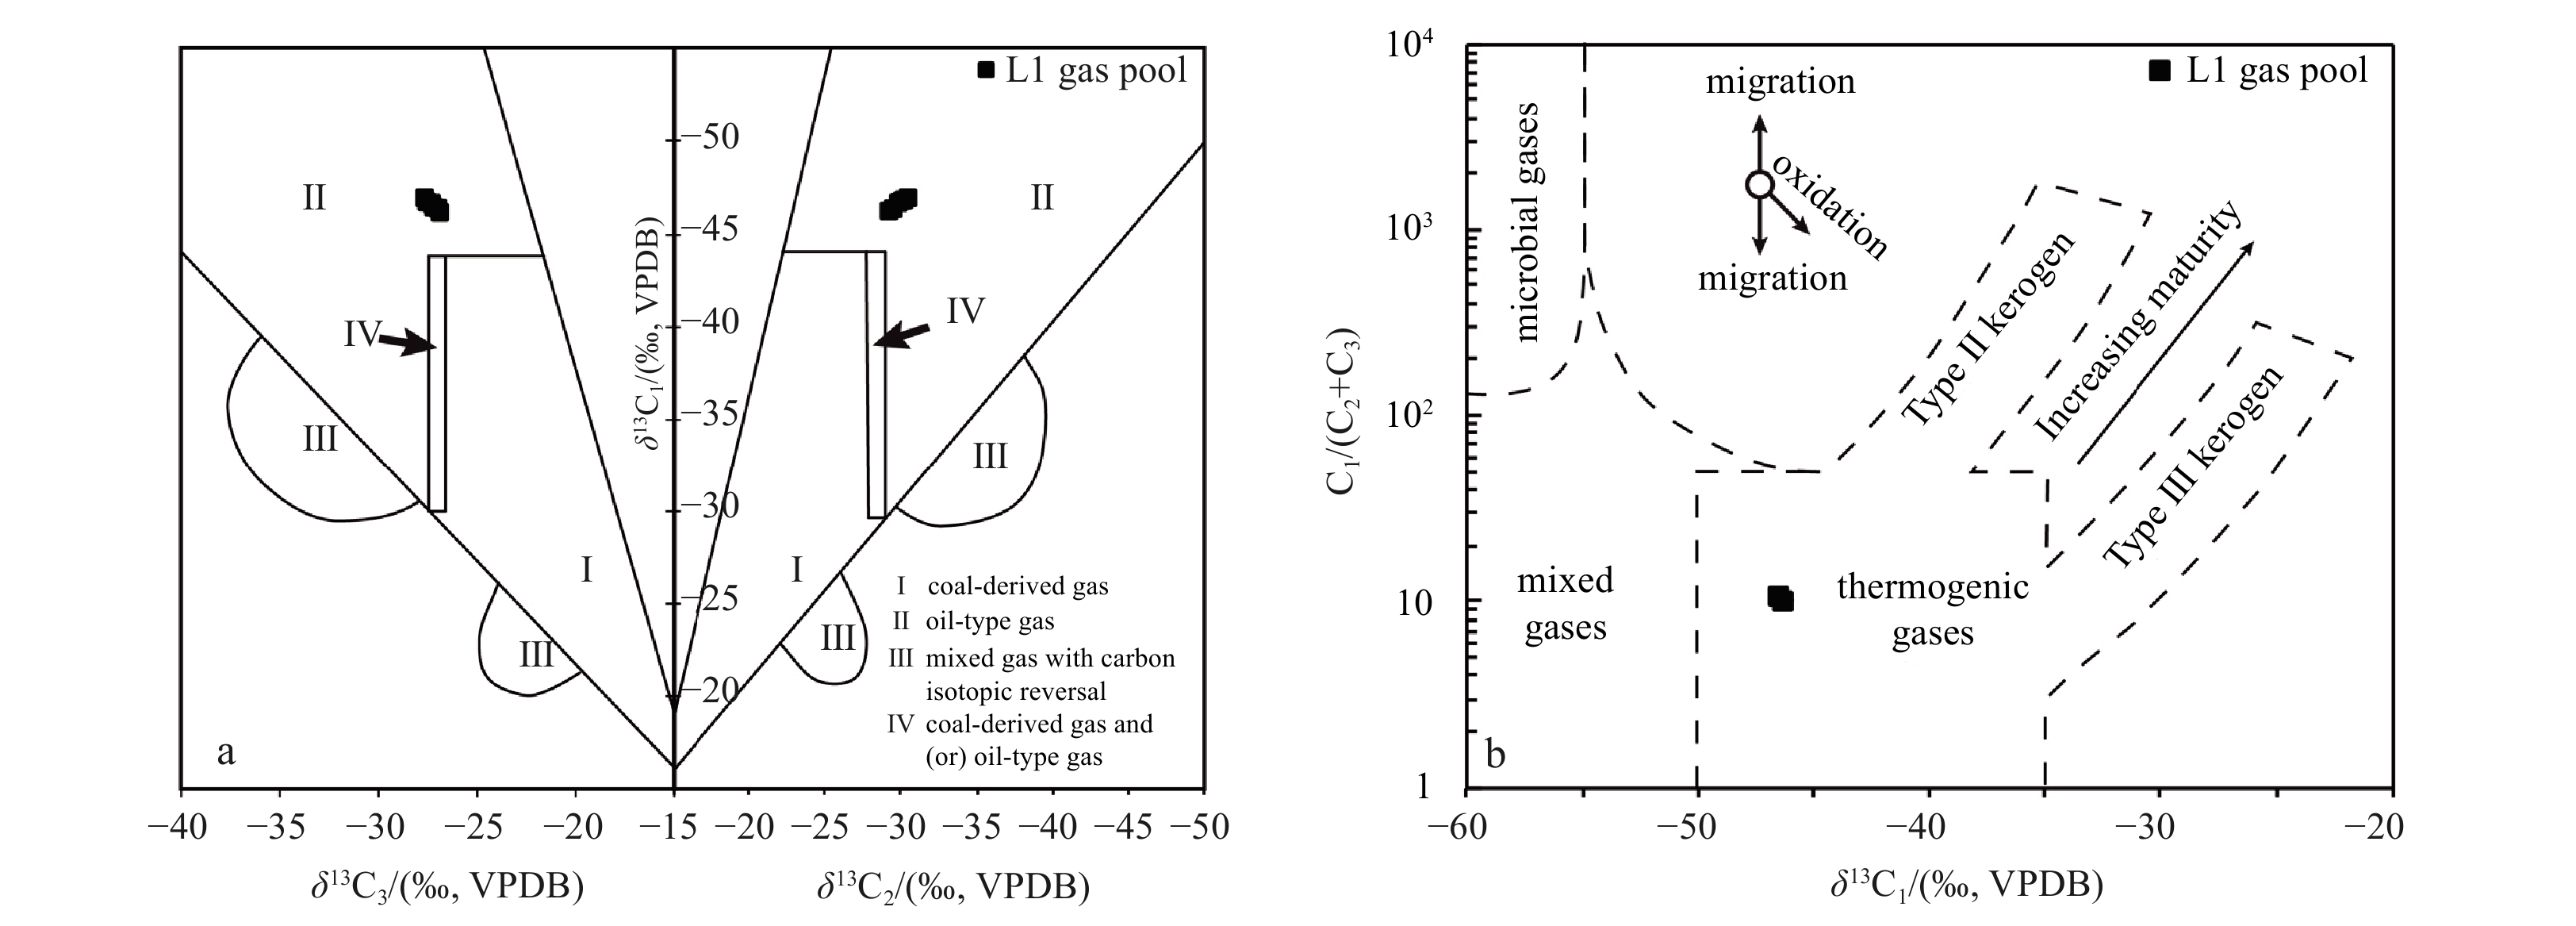
Figure 4. Natural gases from the L1 gas pool plotted on the two most commonly used diagrams in all previous studies for gas interpretations. a. Plot of the δ13C1 vs. δ13C2 and δ13C3 diagram (modified after Dai et al., 2014); b. plot of the C1/(C2+C3) vs. δ13C1 diagram (modified after Bernard et al., 1976; Whiticar, 1999).
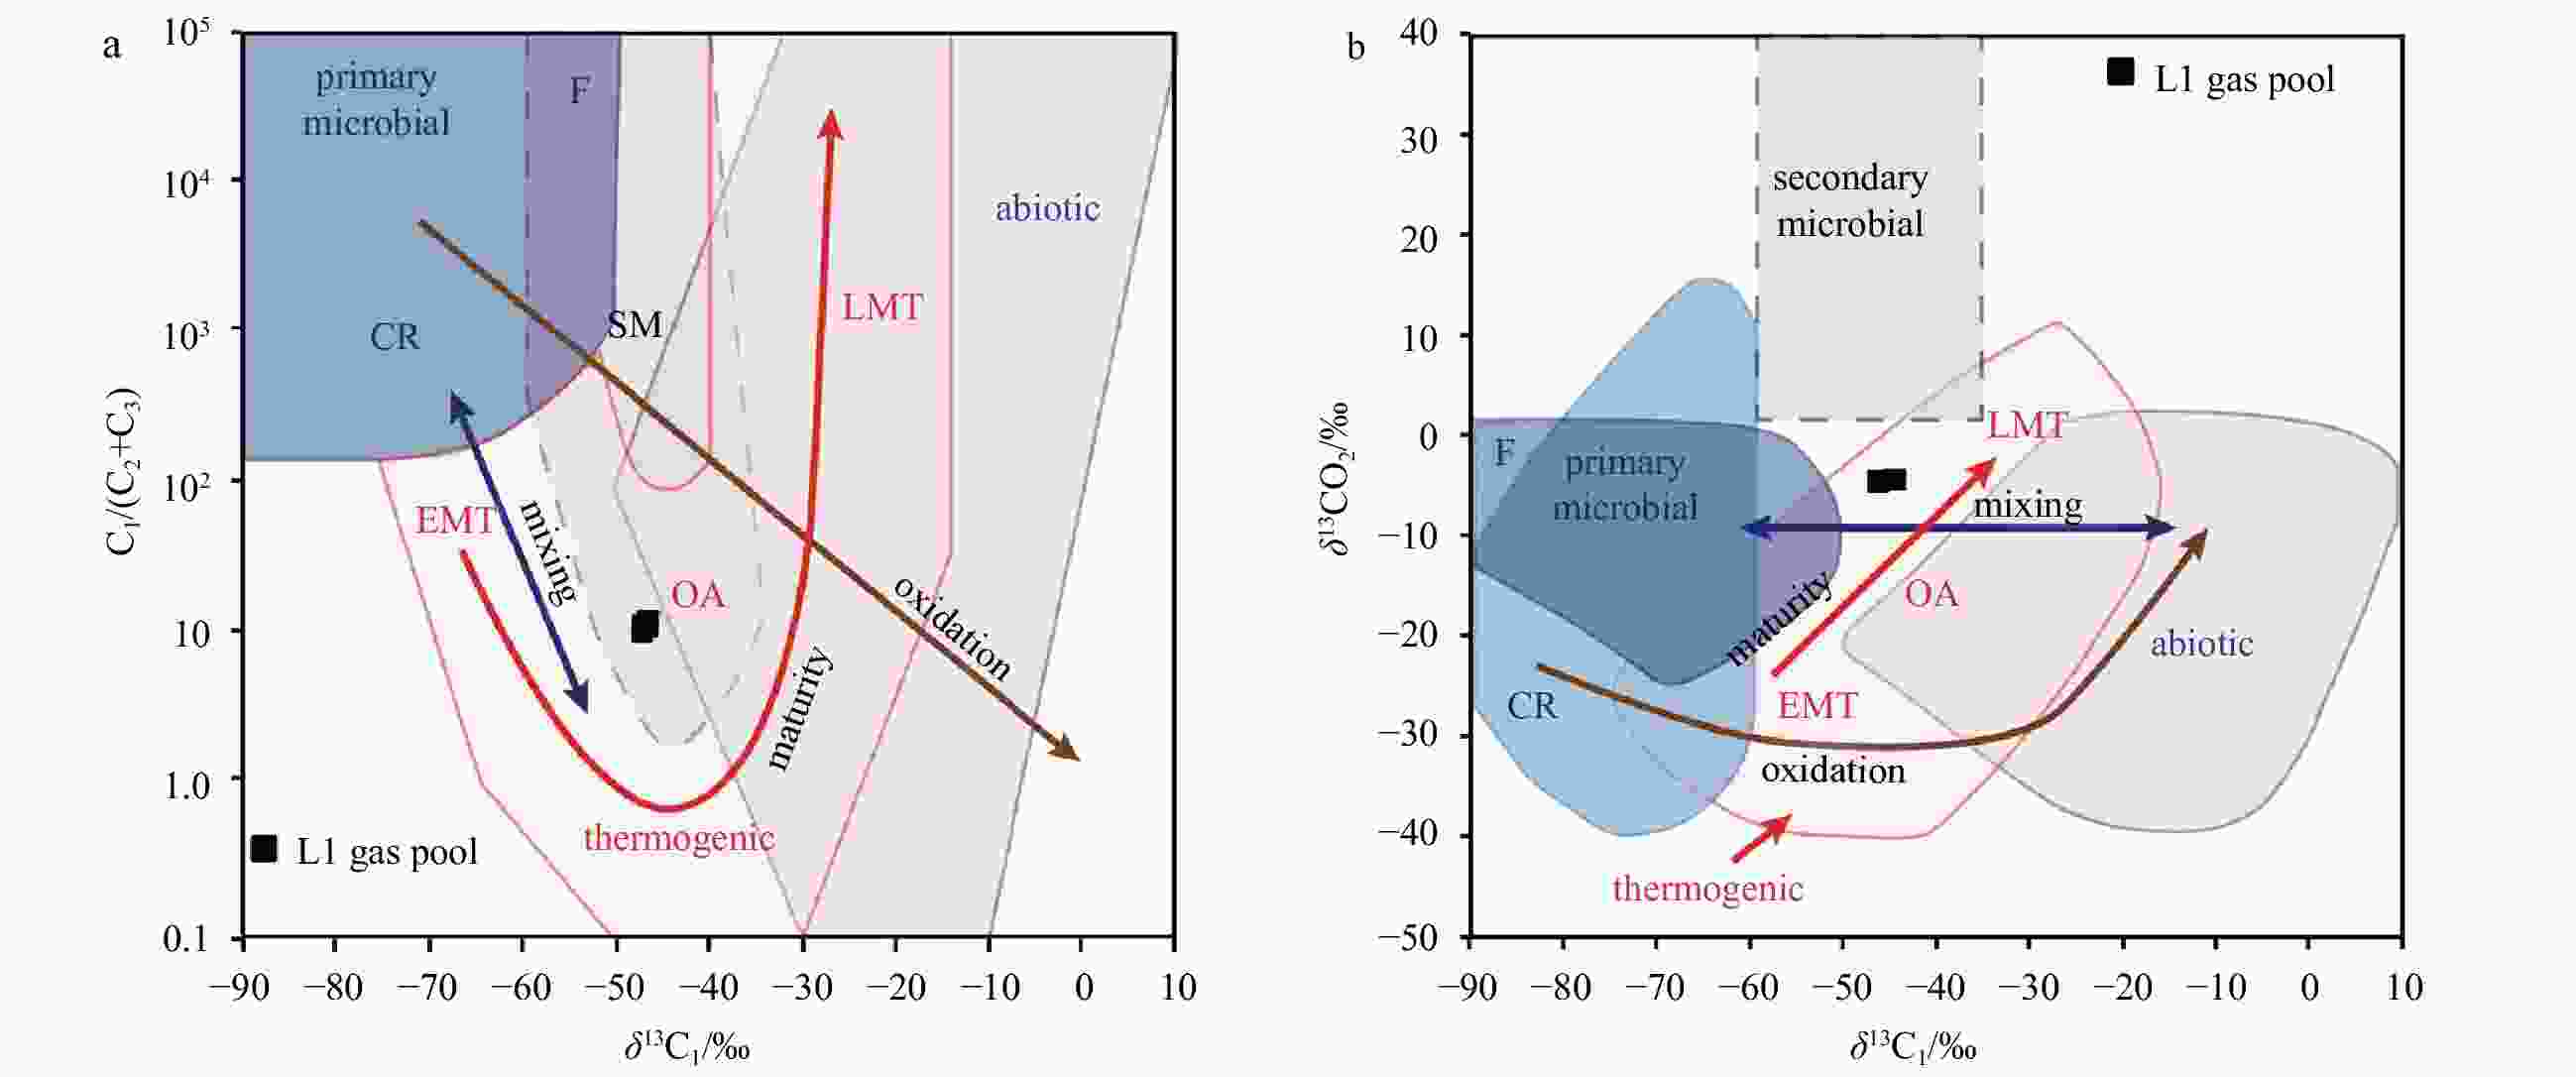
Figure 5. Natural gases from the L1 gas pool plotted on genetic diagrams (modified after Milkov and Etiope (2018)). a. C1/(C2+C3) vs. δ13C1 diagram; b. δ13C1 vs. δ13CO2 diagram. CR, CO2 reduction; EMT, early mature thermogenic gas; F, methyl-type fermentation; LMT, late mature thermogenic gas; OA, oil-associated thermogenic gas; SM, secondary microbial.
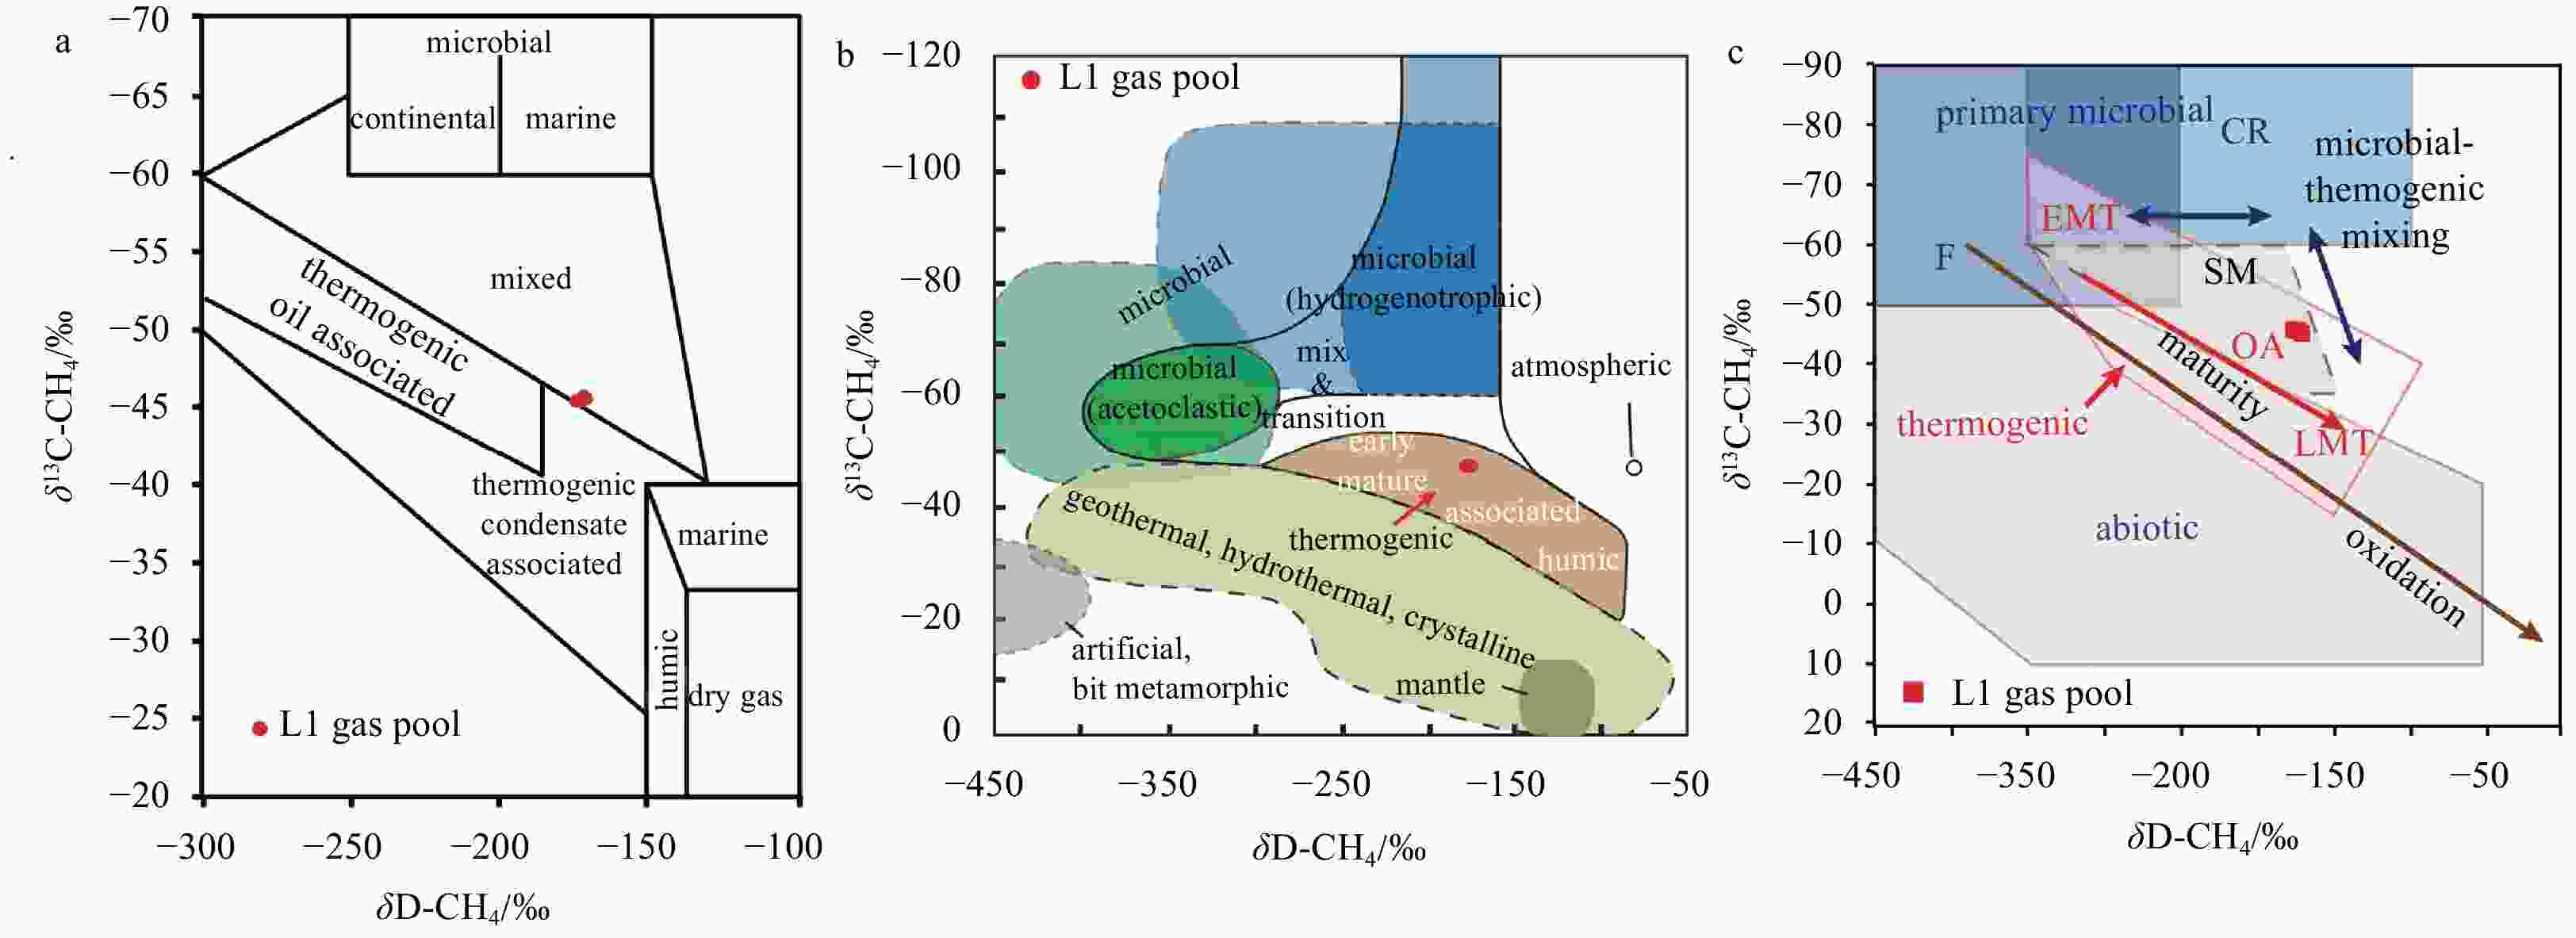
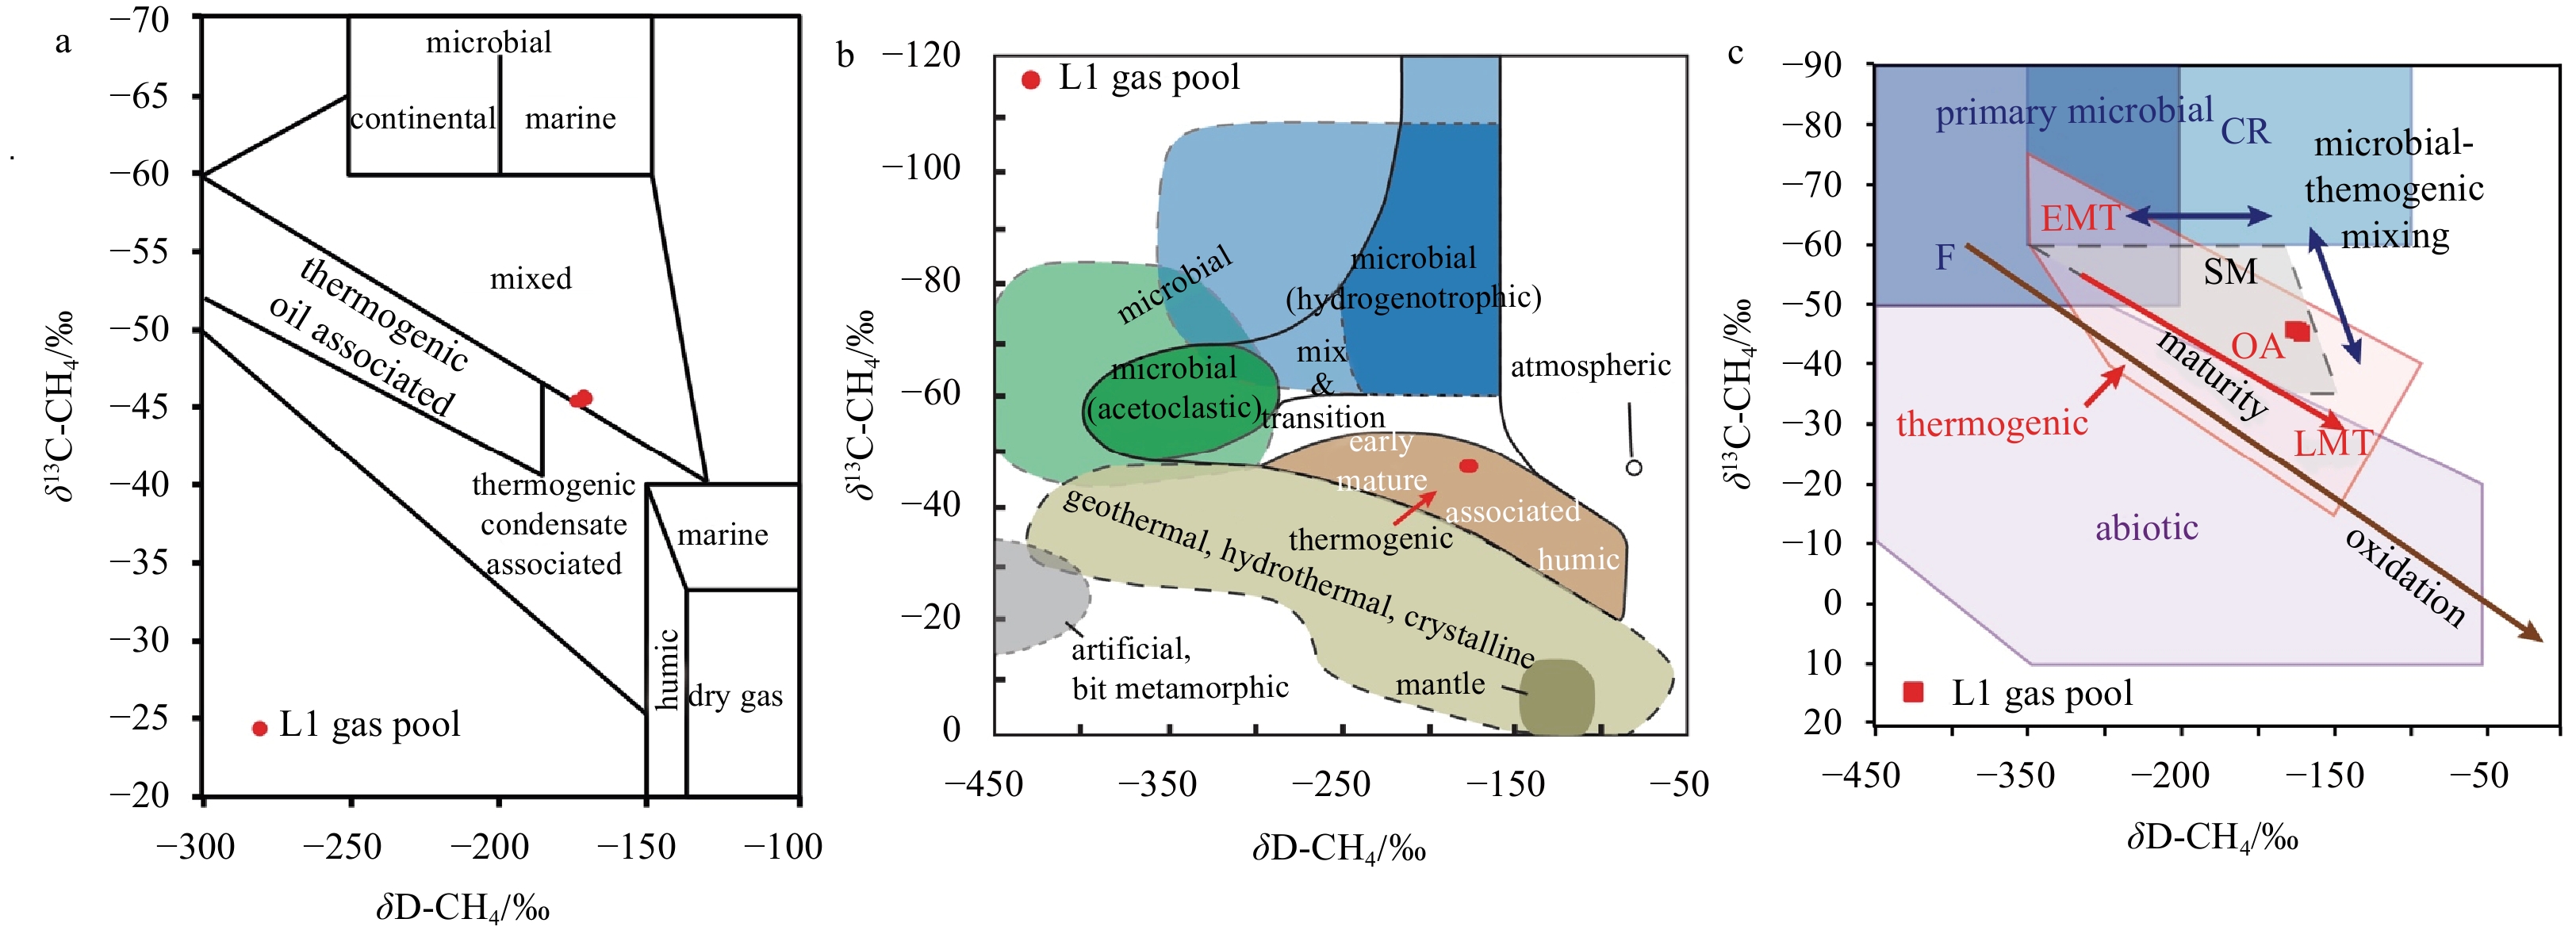
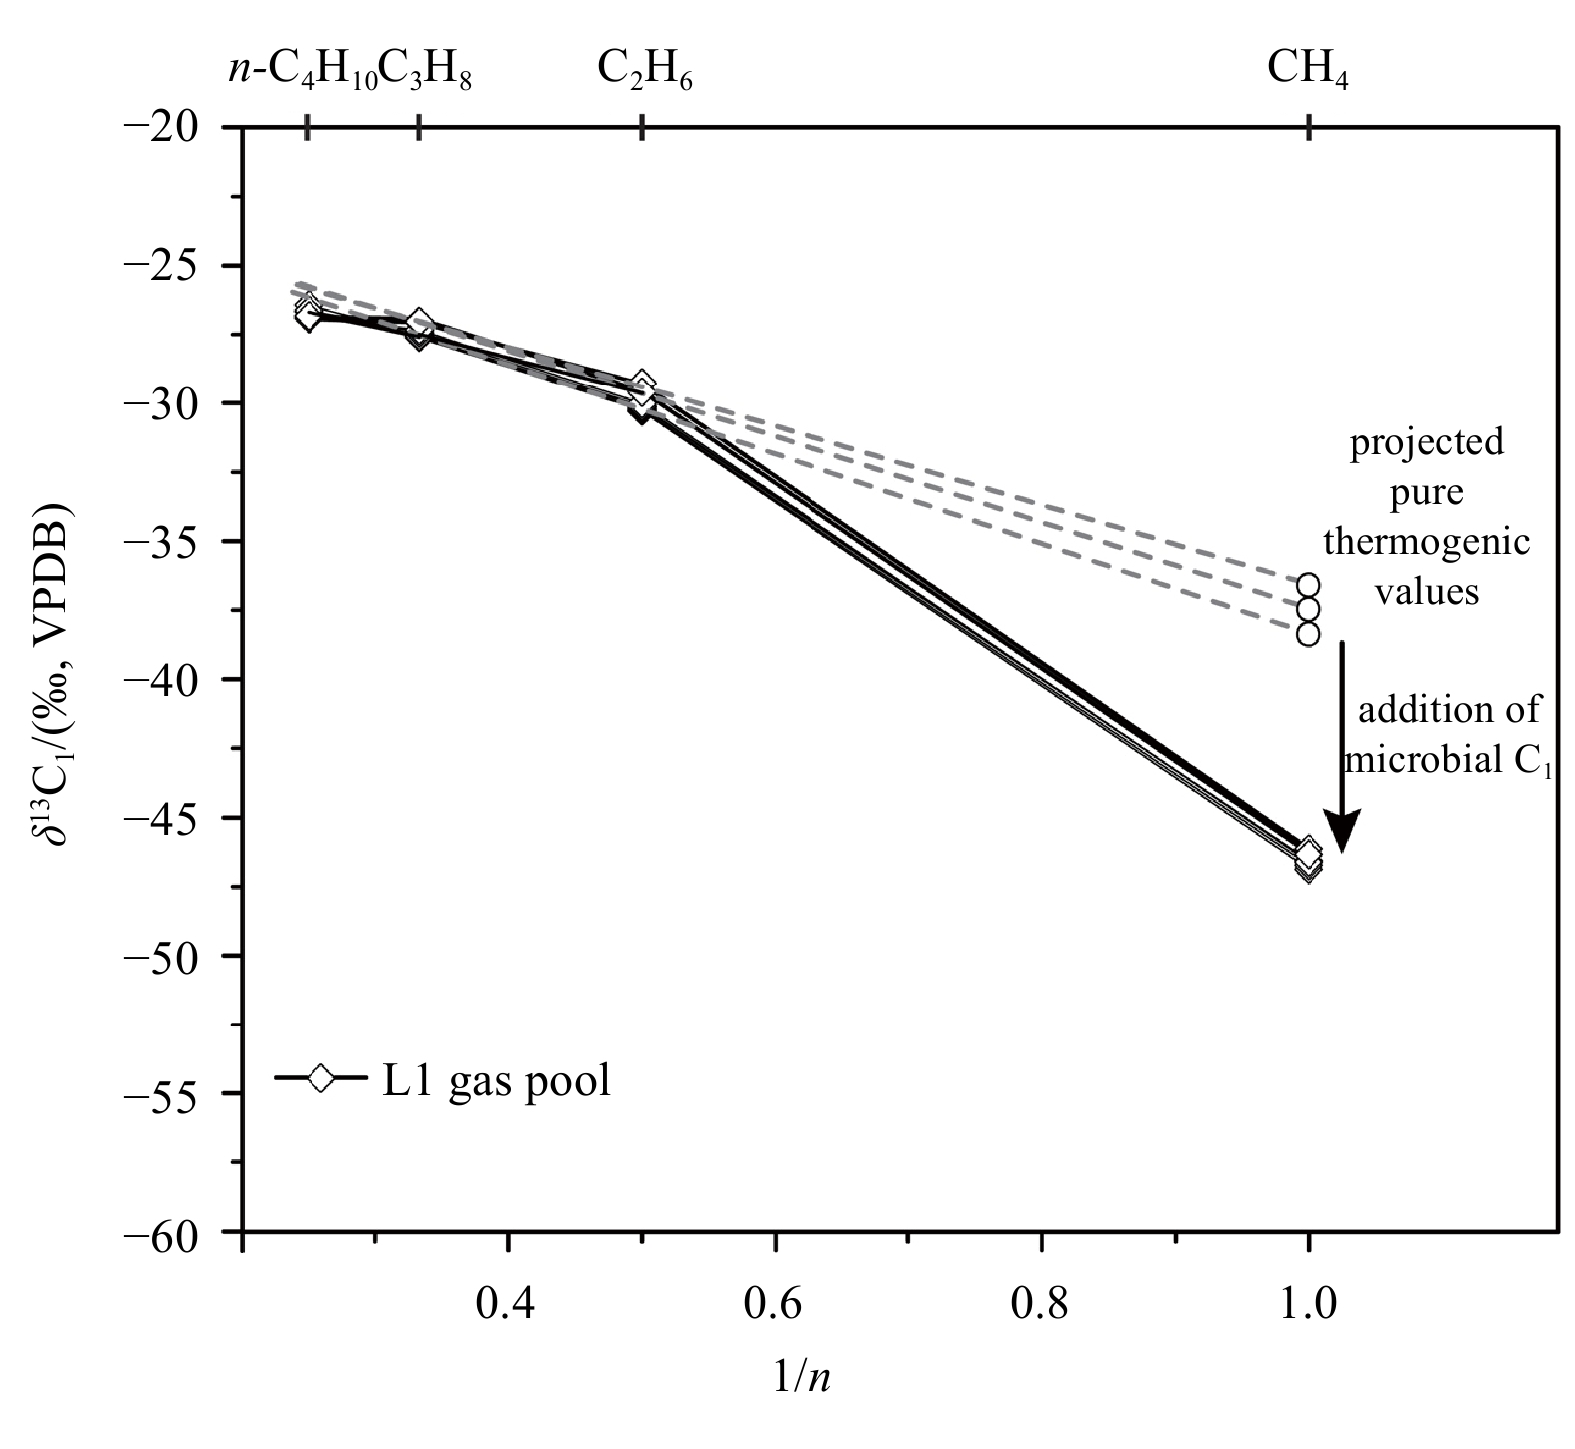
Figure 6. Natural gases of the L1 gas pool plotted on methane genetic diagrams of δ13
C-CH4 vs. δD-CH4. a. modified after Schoell (1983); b. modified after Whiticar (1999, 2020); c. modified after Milkov and Etiope (2018). CR, CO2 reduction; EMT, early mature thermogenic gas; F, methyl-type fermentation; LMT, late mature thermogenic gas; OA, oil-associated thermogenic gas; SM, secondary microbial. 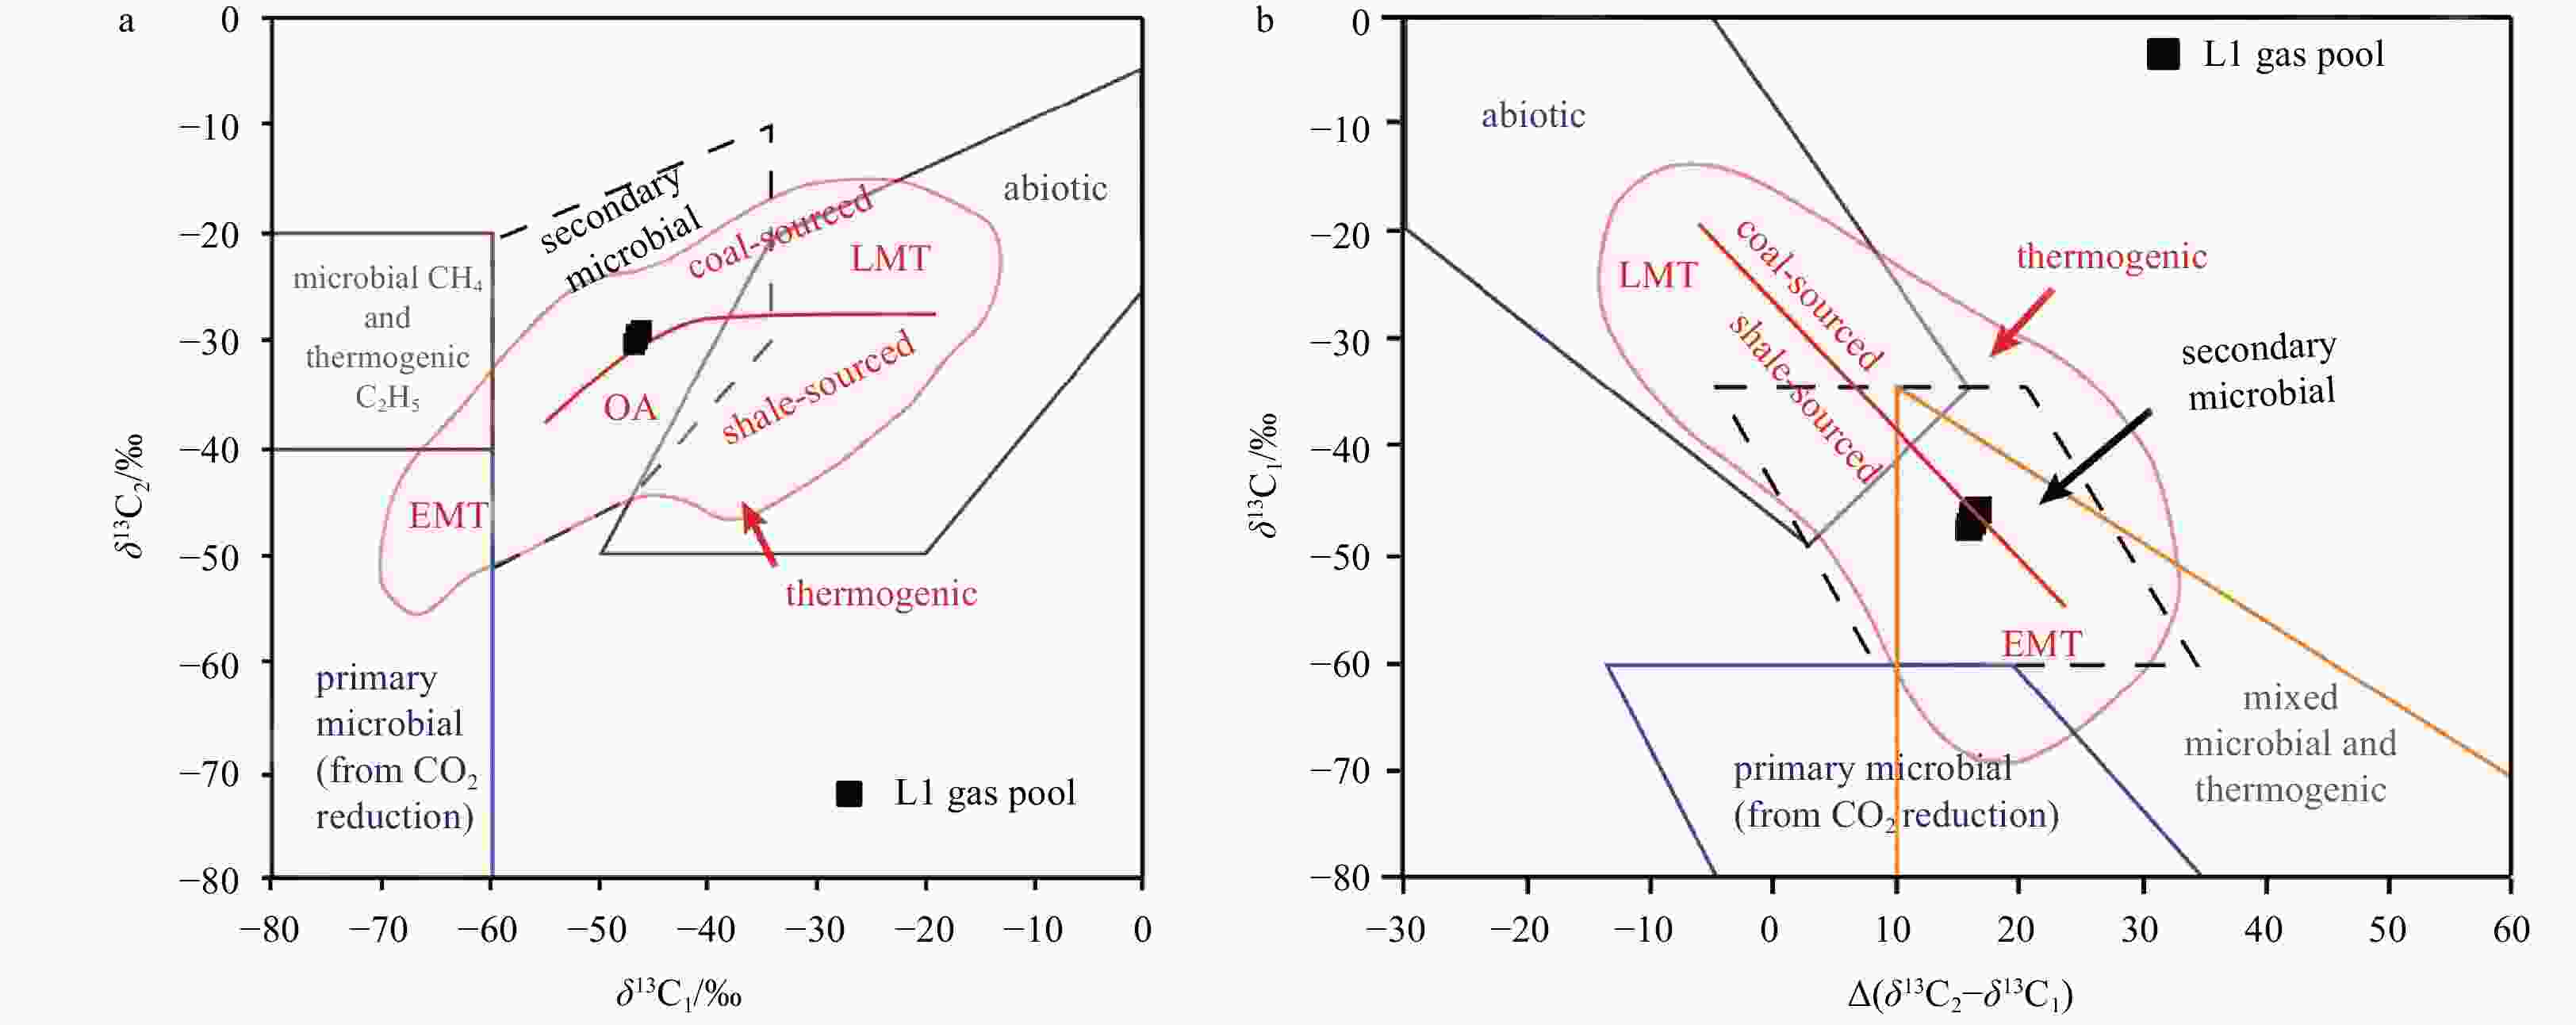
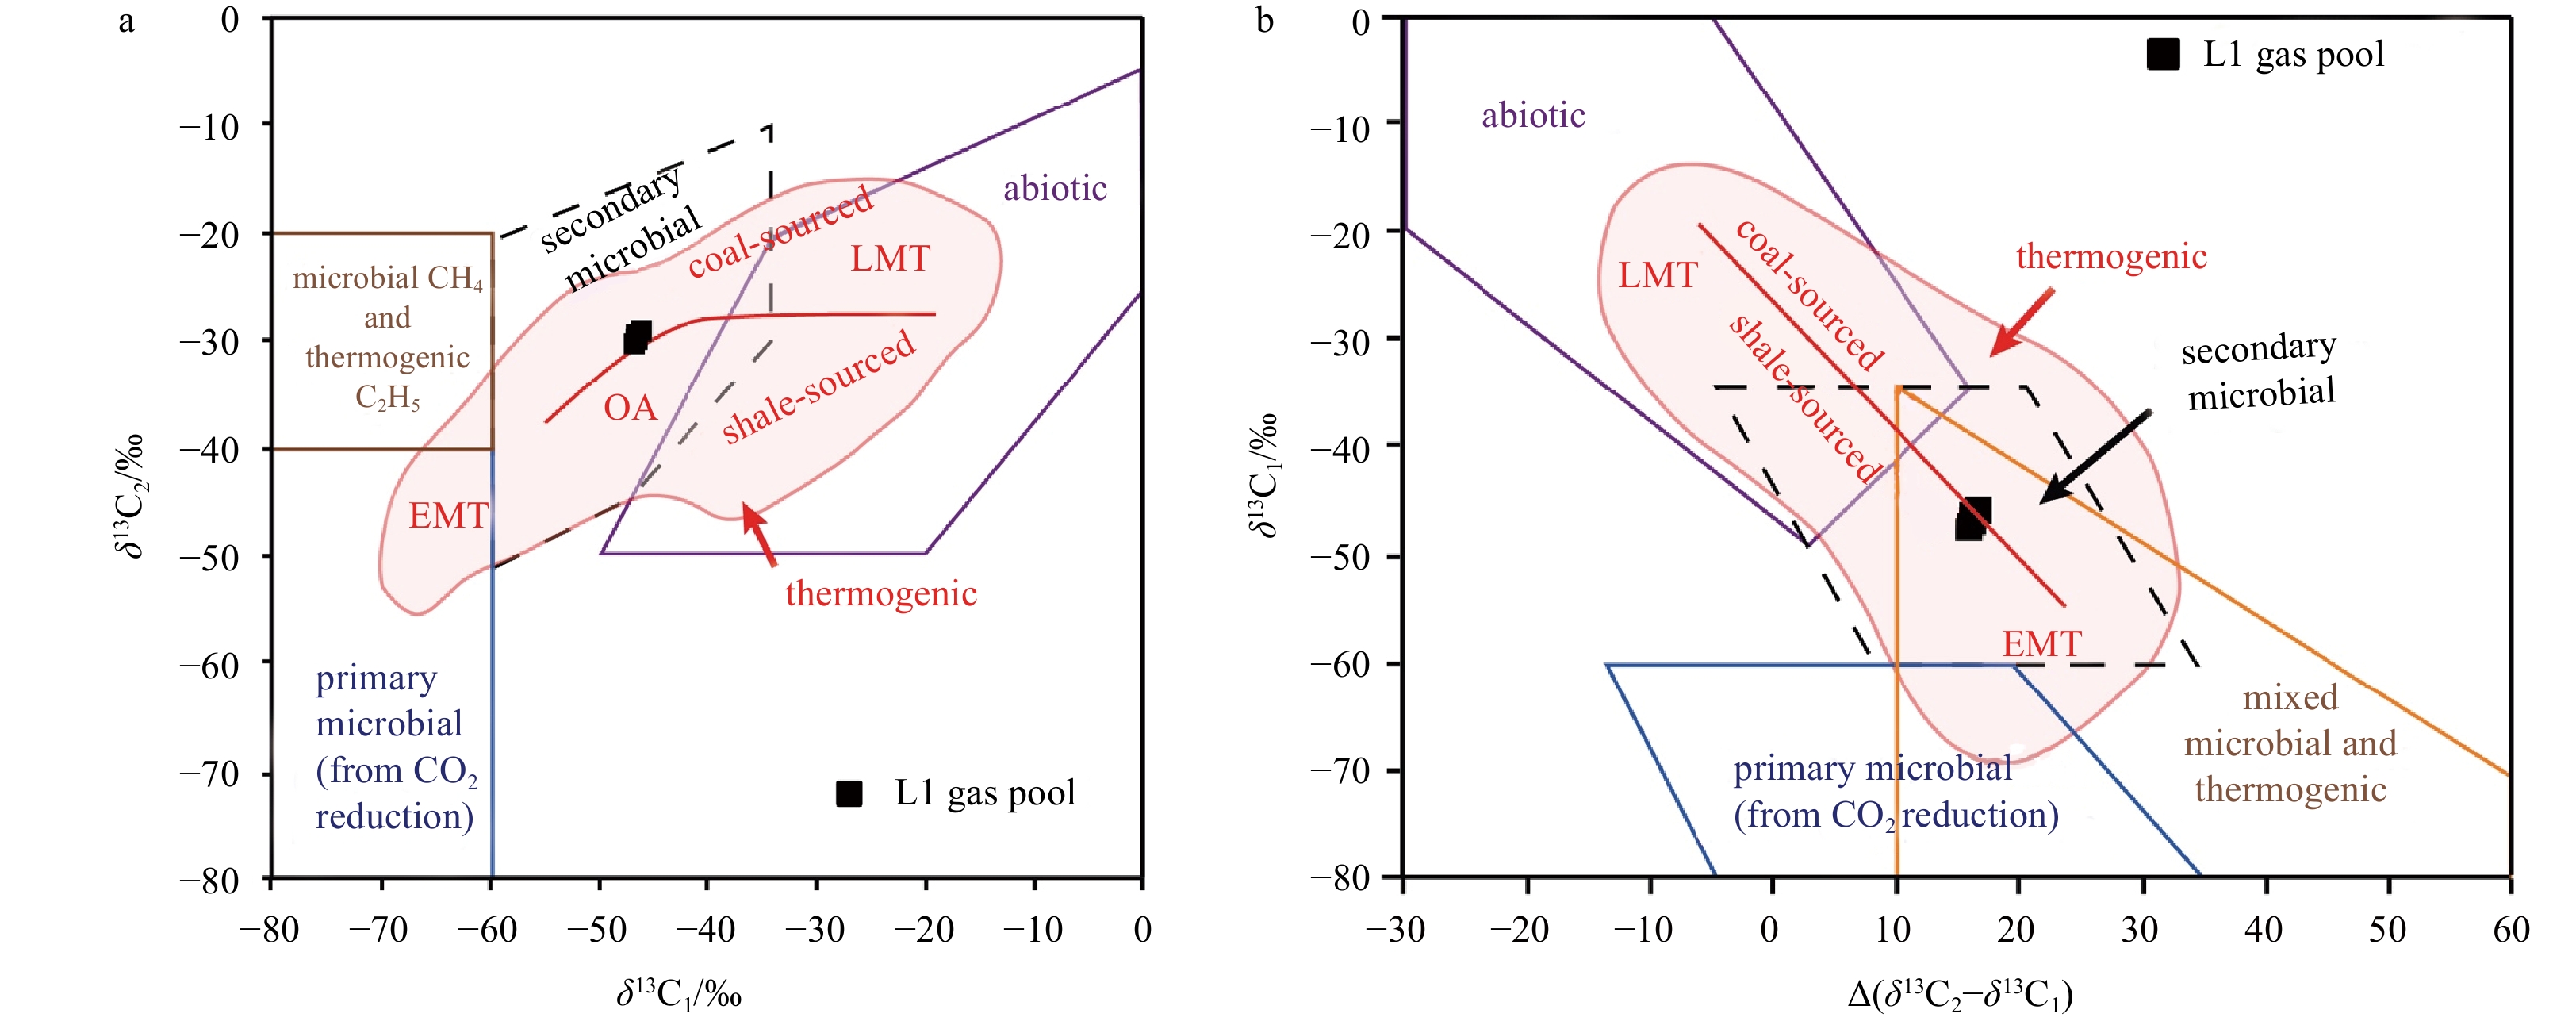
Figure 7. Natural gases of the L1 gas pool plotted on genetic diagrams (modified after Milkov, 2021). a. δ13C1 vs. δ13C2 and b. δ13C1 vs. Δ(δ13C2−δ13C1). EMT, early mature thermogenic gas; LMT, late mature thermogenic gas; OA, oil-associated thermogenic gas.
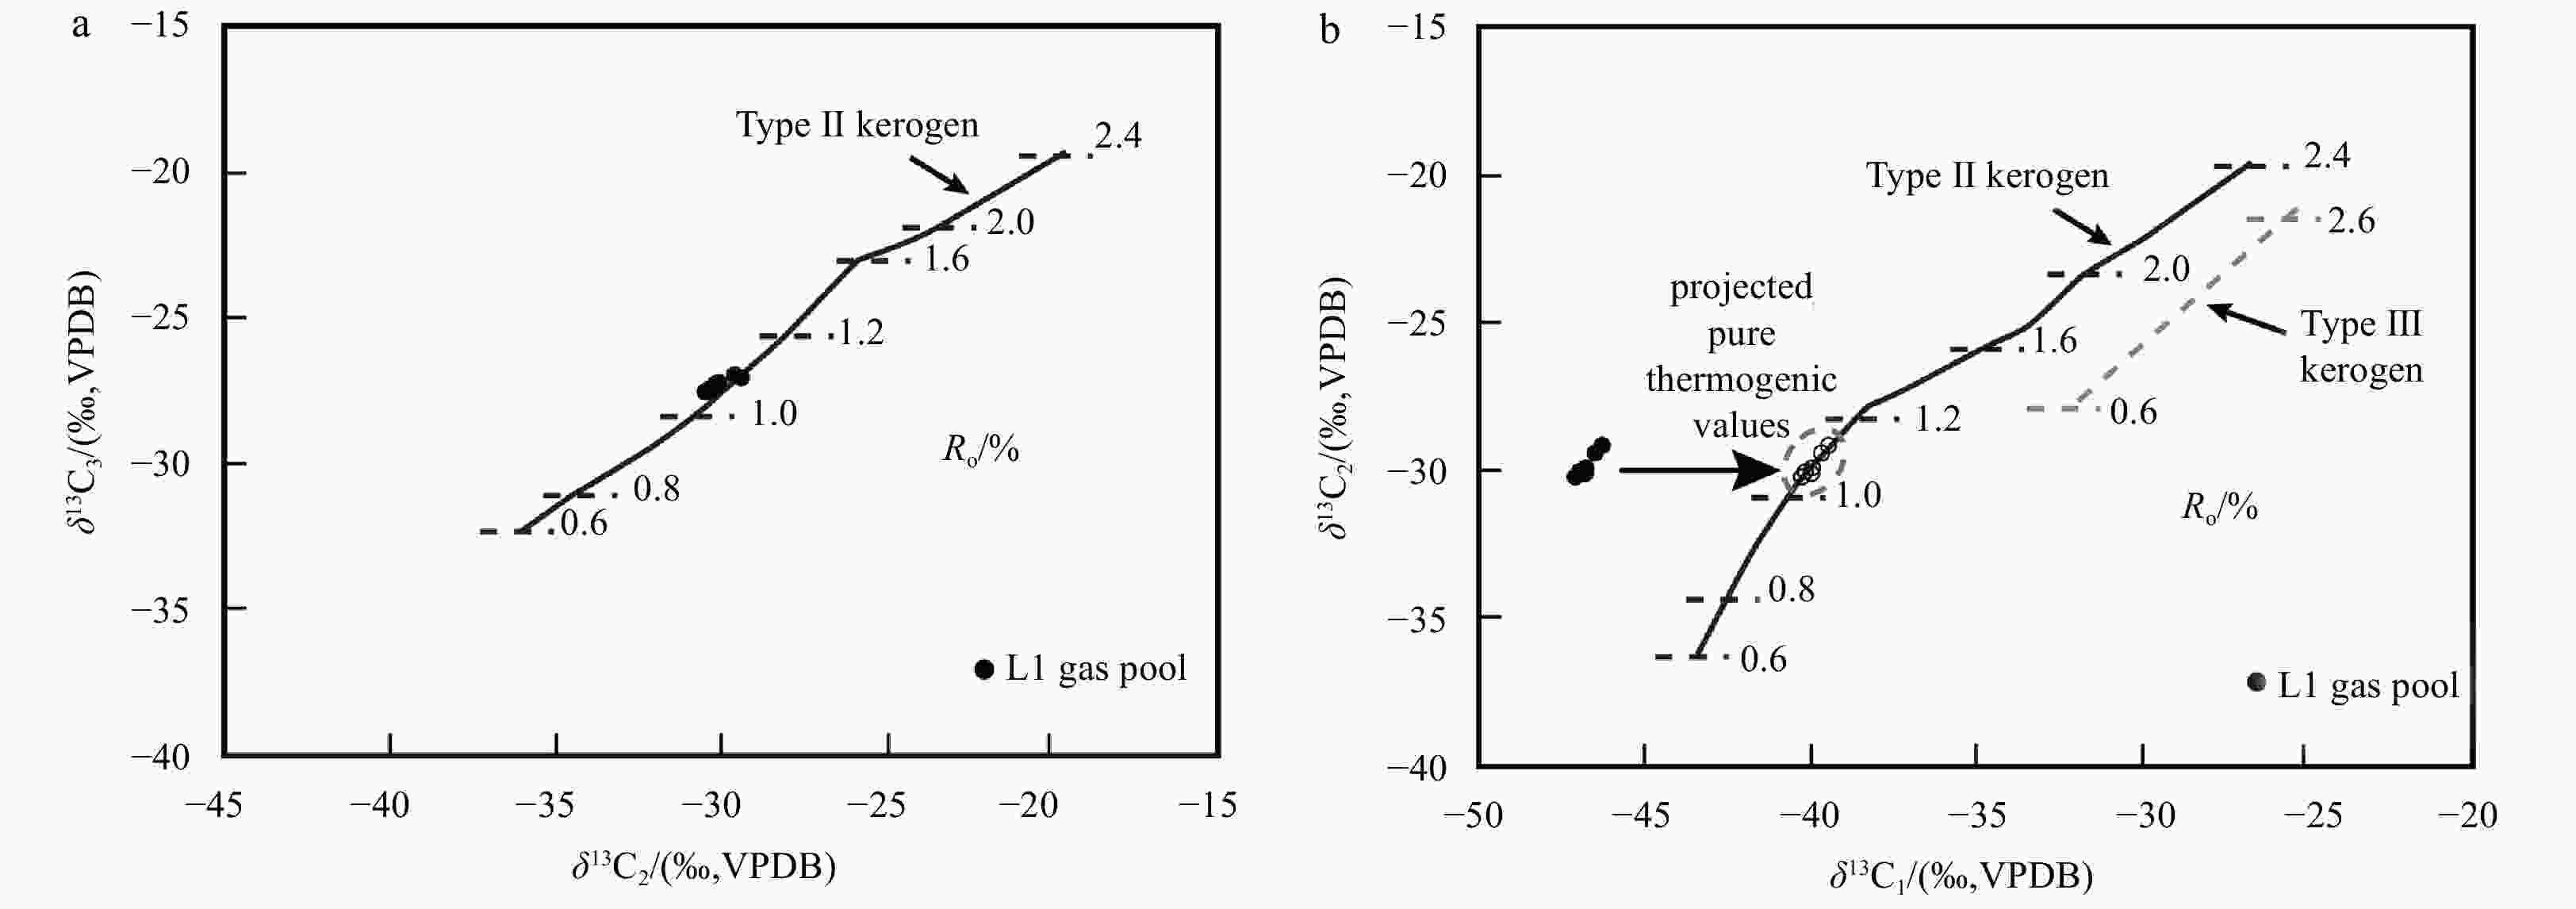
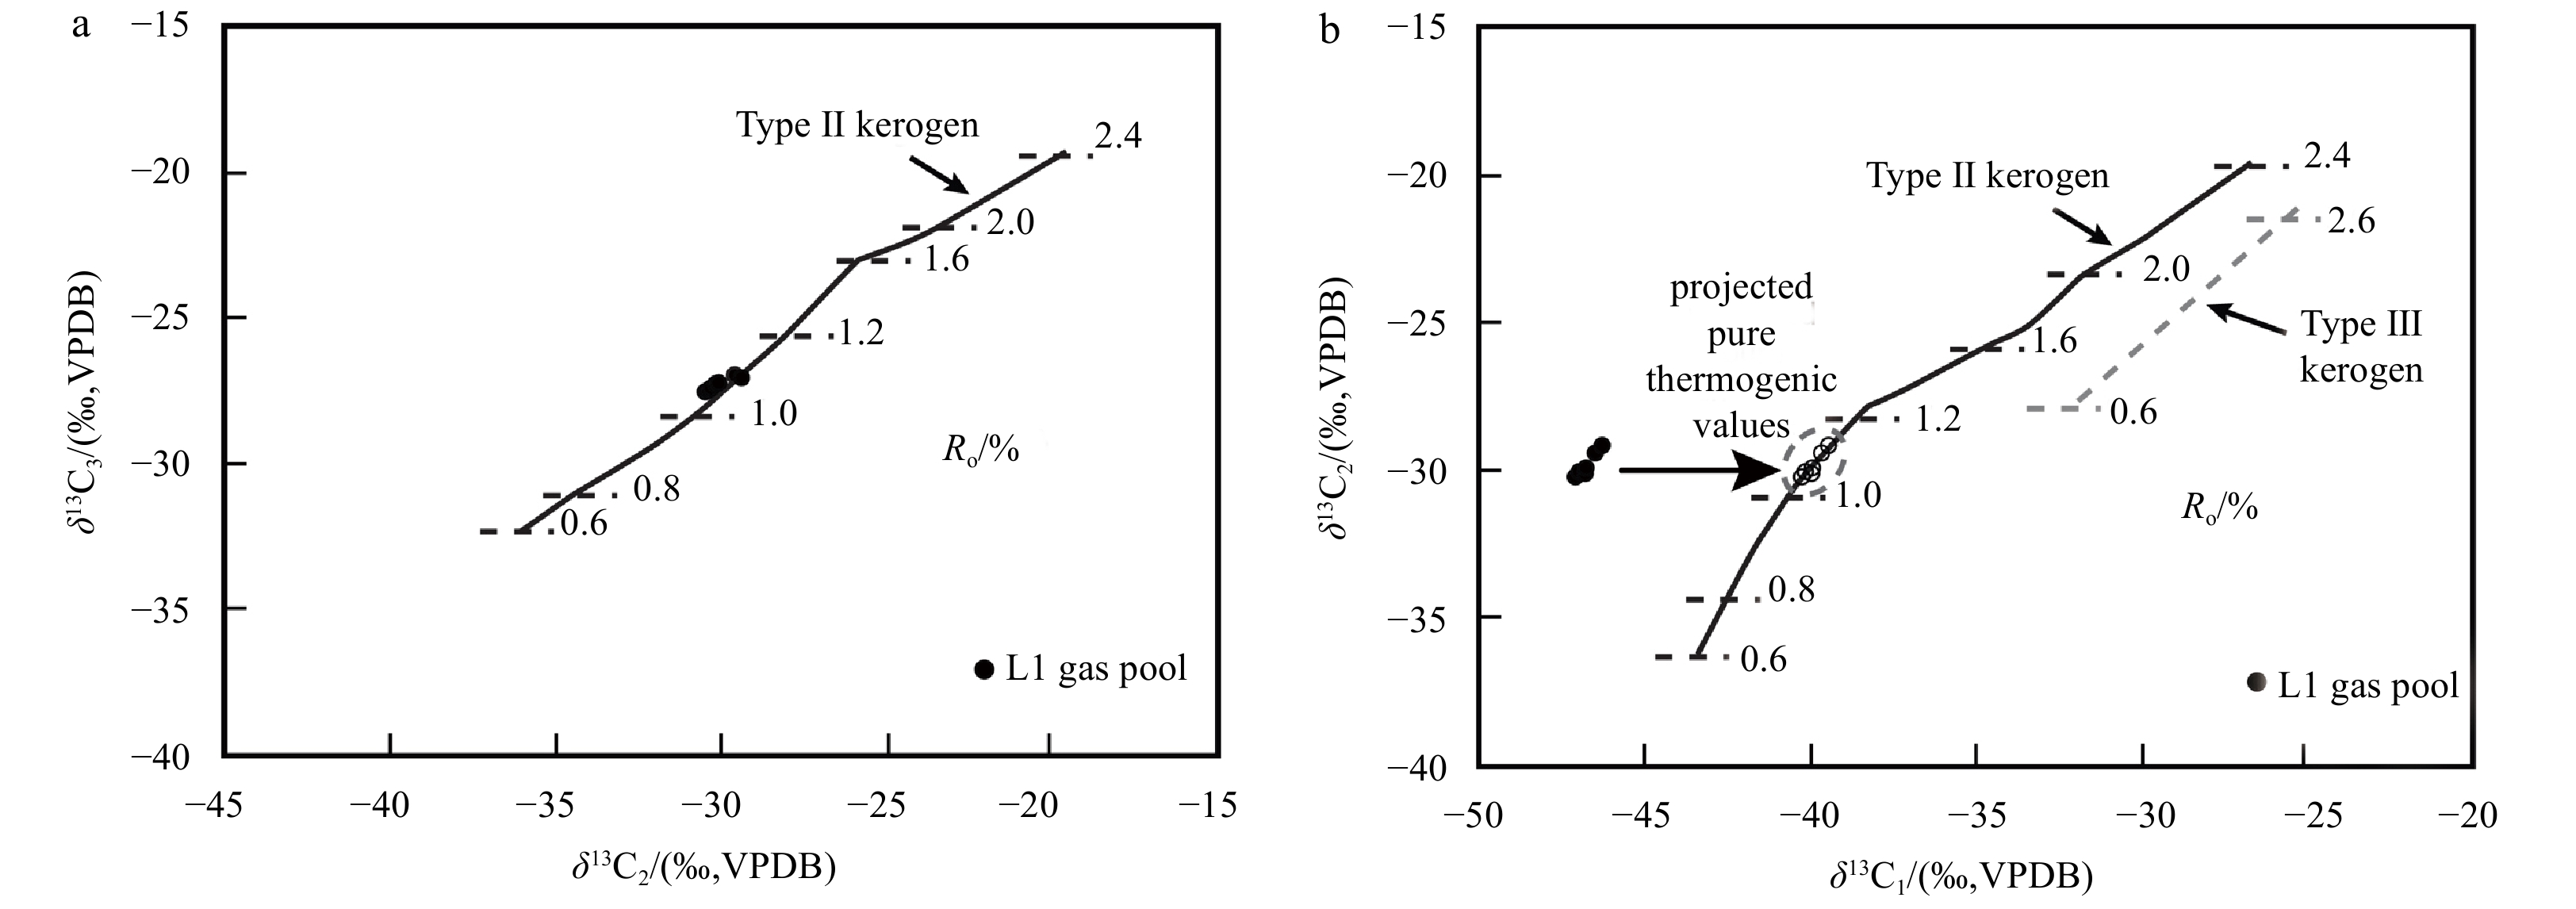
Figure 8. Natural gases of the L1 gas pool plotted on genetic diagrams (modified after Berner and Faber, 1996). a. δ13C2 vs. δ13C3, b. δ13C1 vs. δ13C2. The carbon isotope values of the pure thermogenic gas are inferred by the parallel shifts of δ13C2 values to the treadline. Ro, vitrinite reflectance.

Figure 9. Carbon isotopic compositions of C1−C4 gases from the L1 gas pool exhibited on the natural gas plot (Chung et al., 1988). Dashed lines indicate the extrapolation of carbon isotope values of C2−C4 gases to obtain the estimated δ13C of pure thermogenic methane from –37.0‰ to –38.5‰.
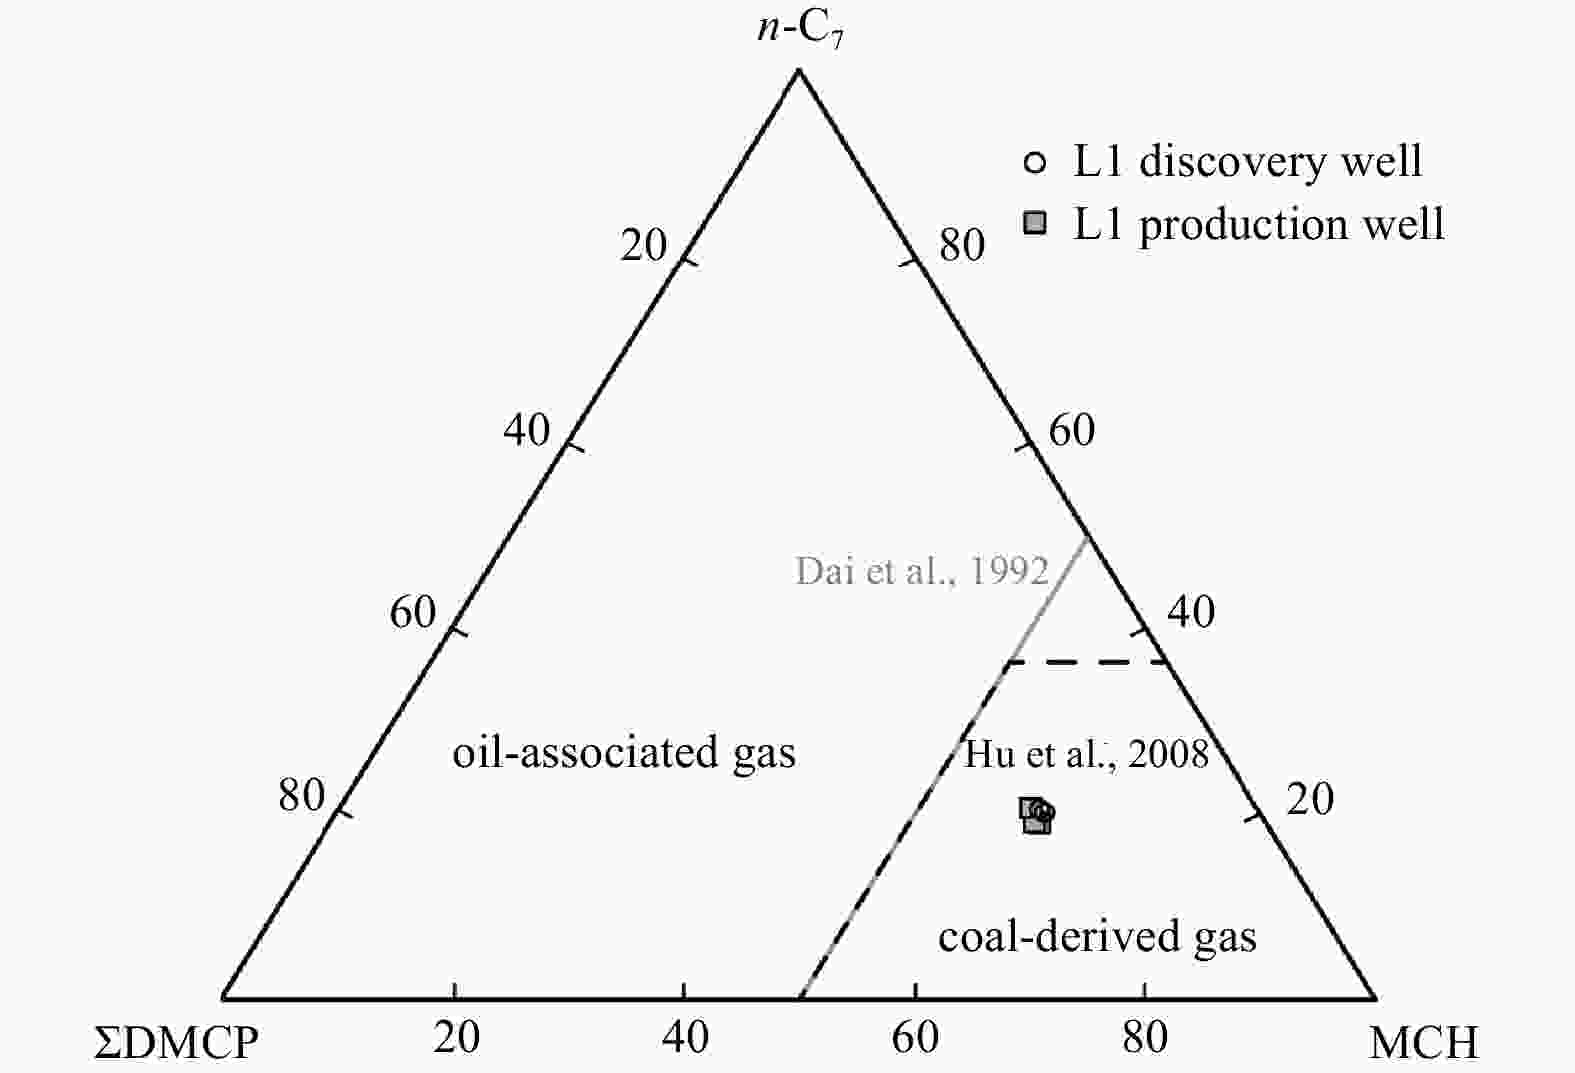
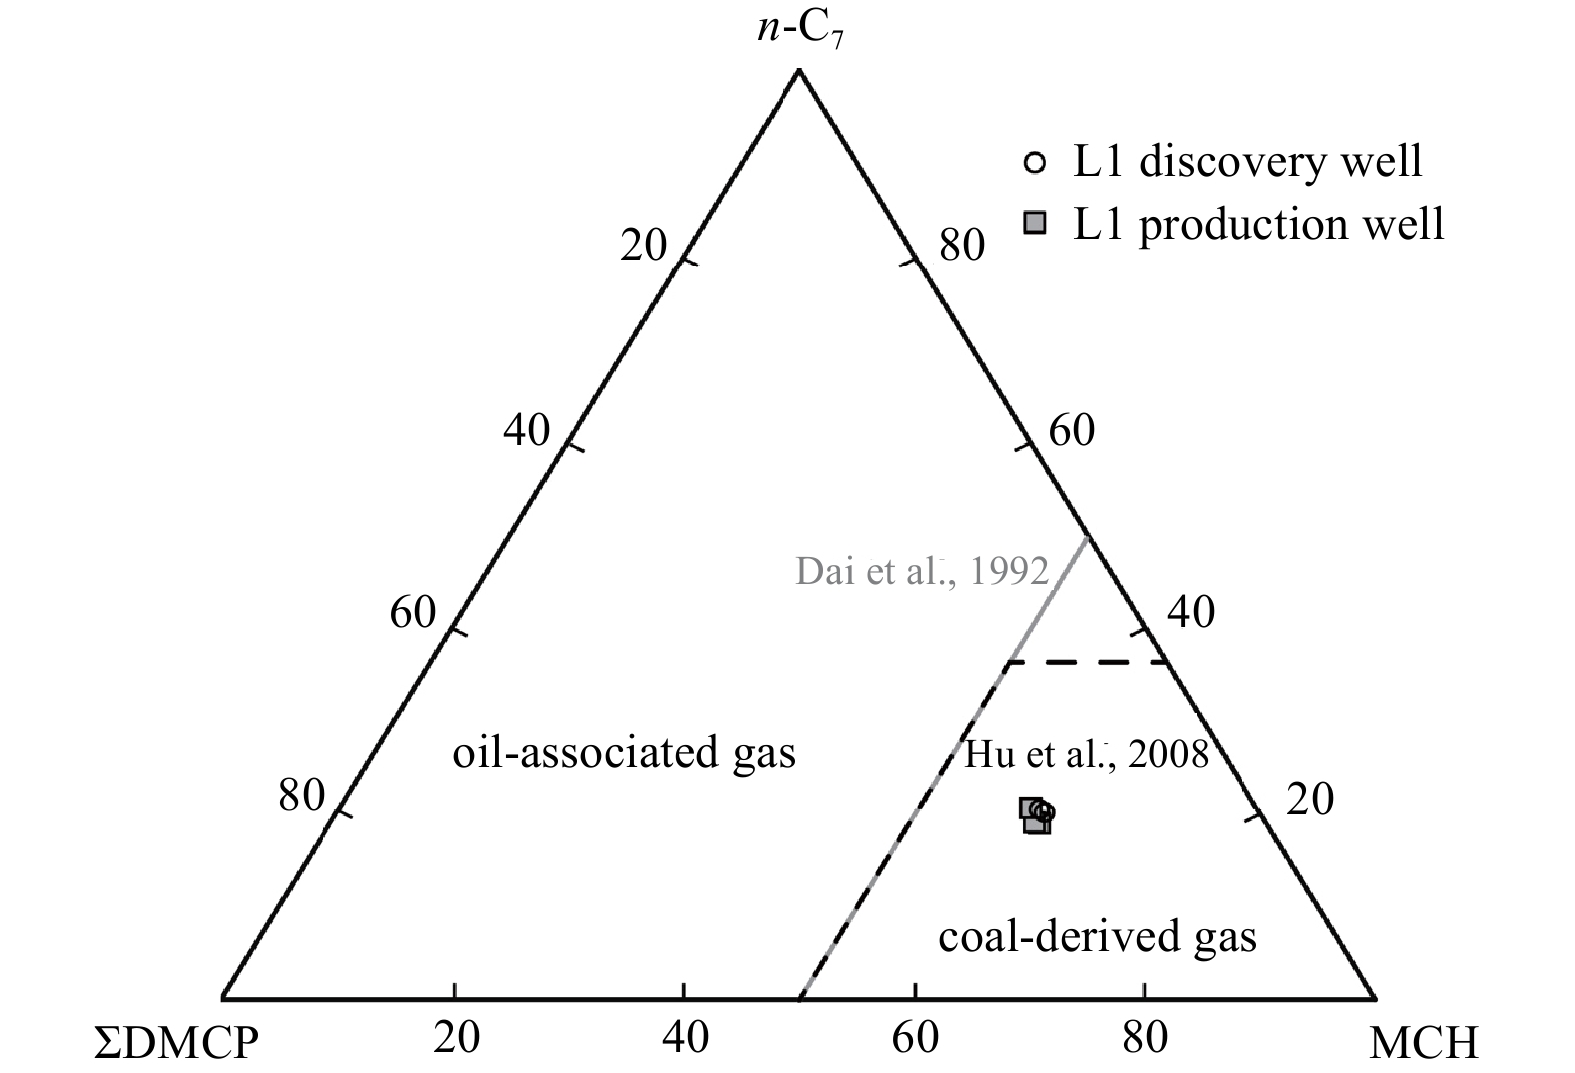
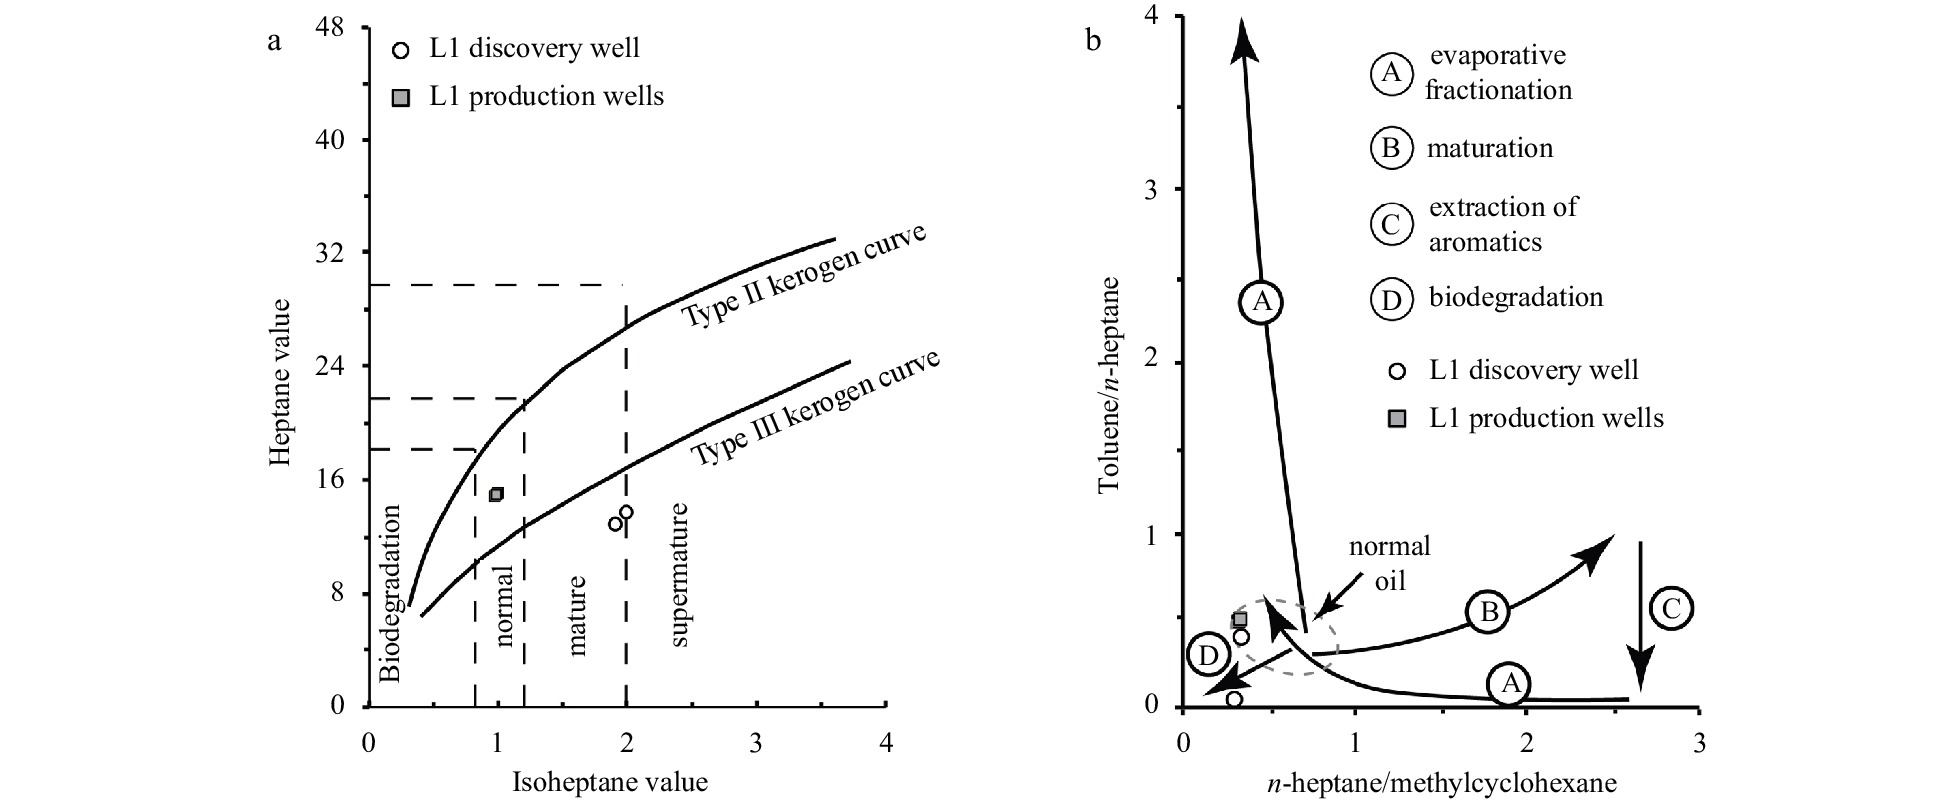
Figure 10. Ternary plot showing the distribution of C7 light hydrocarbons in condensate oil samples of the L1 gas pool (modified after Dai et al., 1992; Hu et al., 2008).
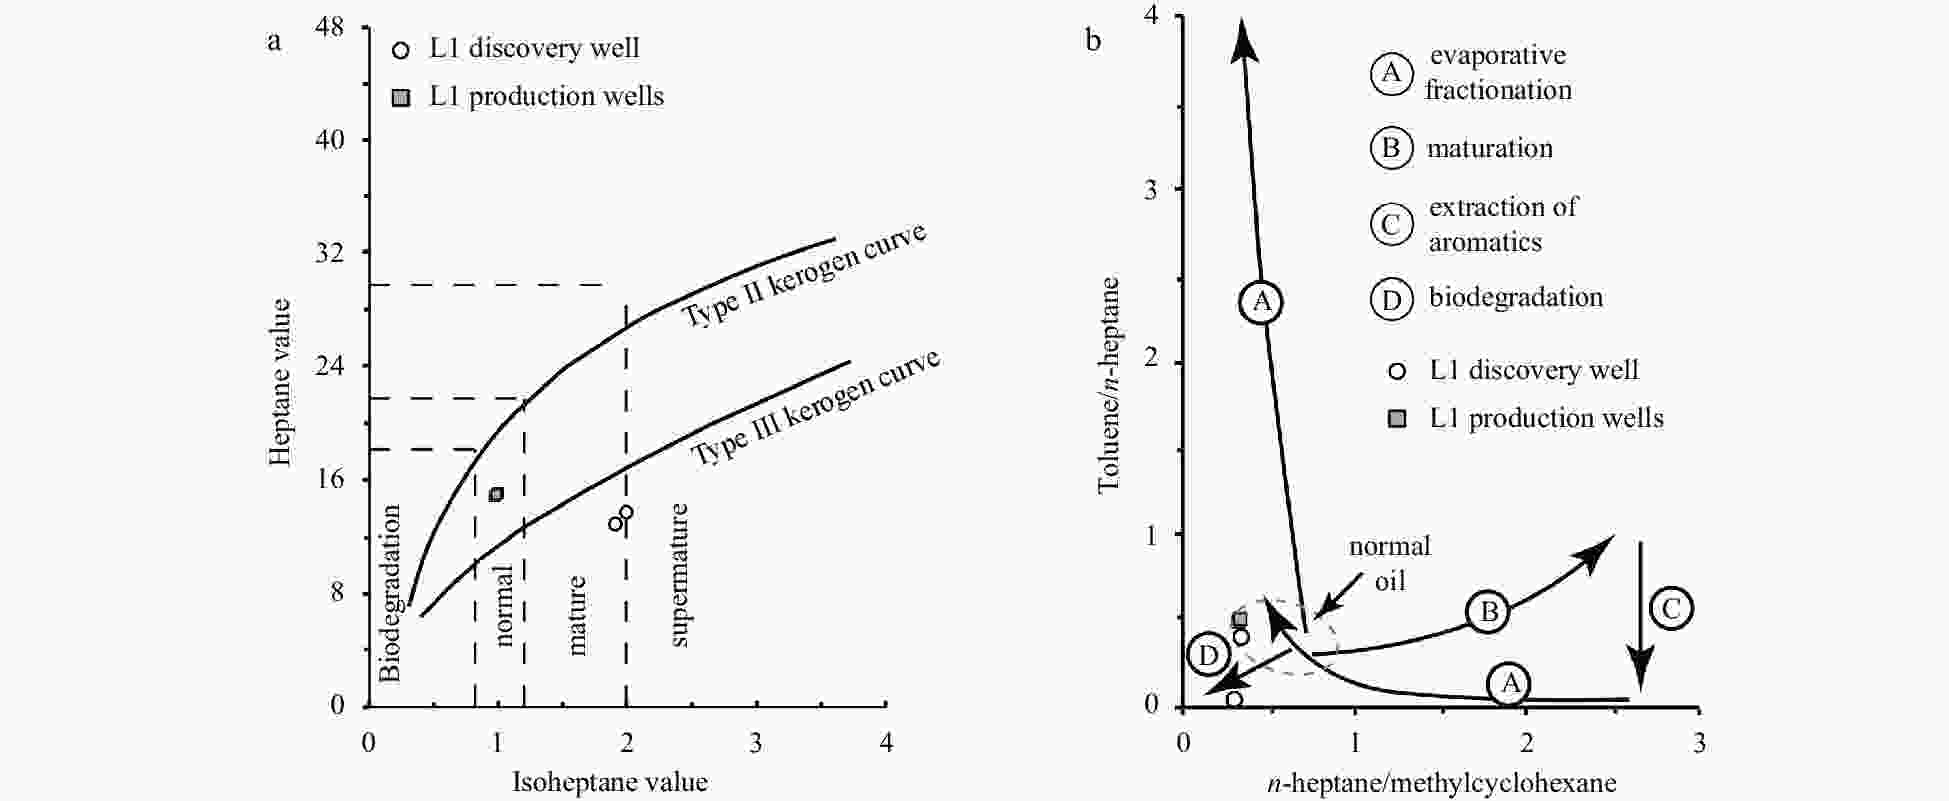
Figure 11. Condensate oil samples from the L1 gas pool plotted on the two commonly used diagrams for light hydrocarbon interpretations. a. Cross-plot of n-heptane values vs. iso-heptane values (modified after Thompson, 1983), and b. cross-plot of n-heptane/methylcyclohexane vs. toluene/n-heptane (modified after Thompson, 1987).
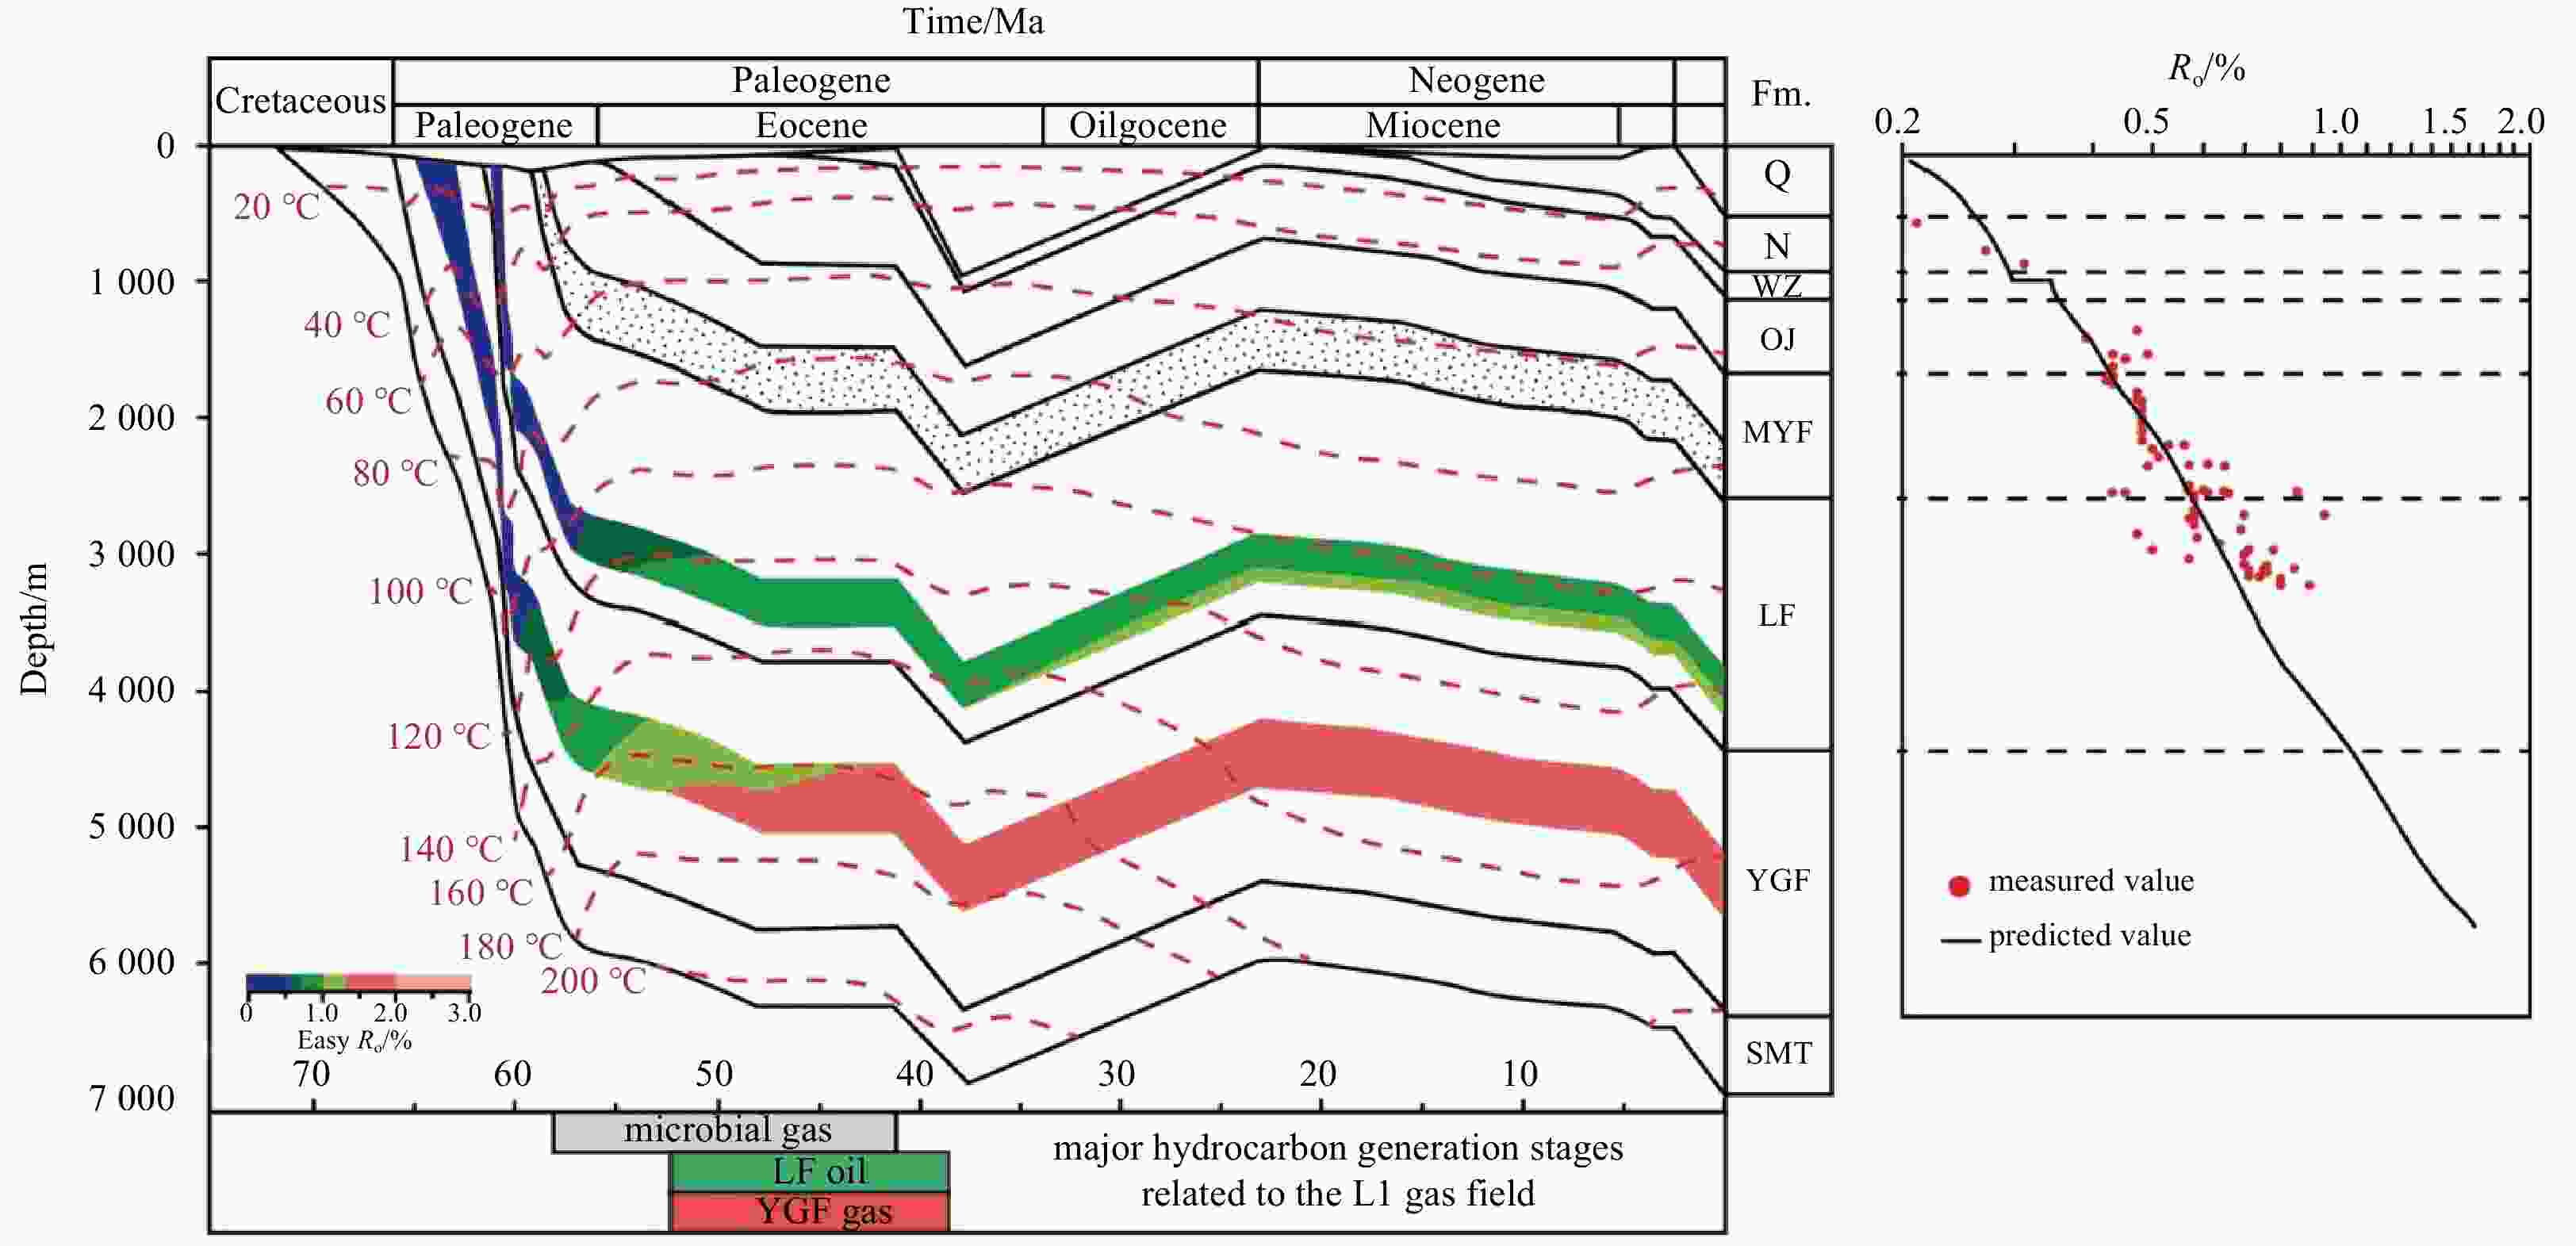
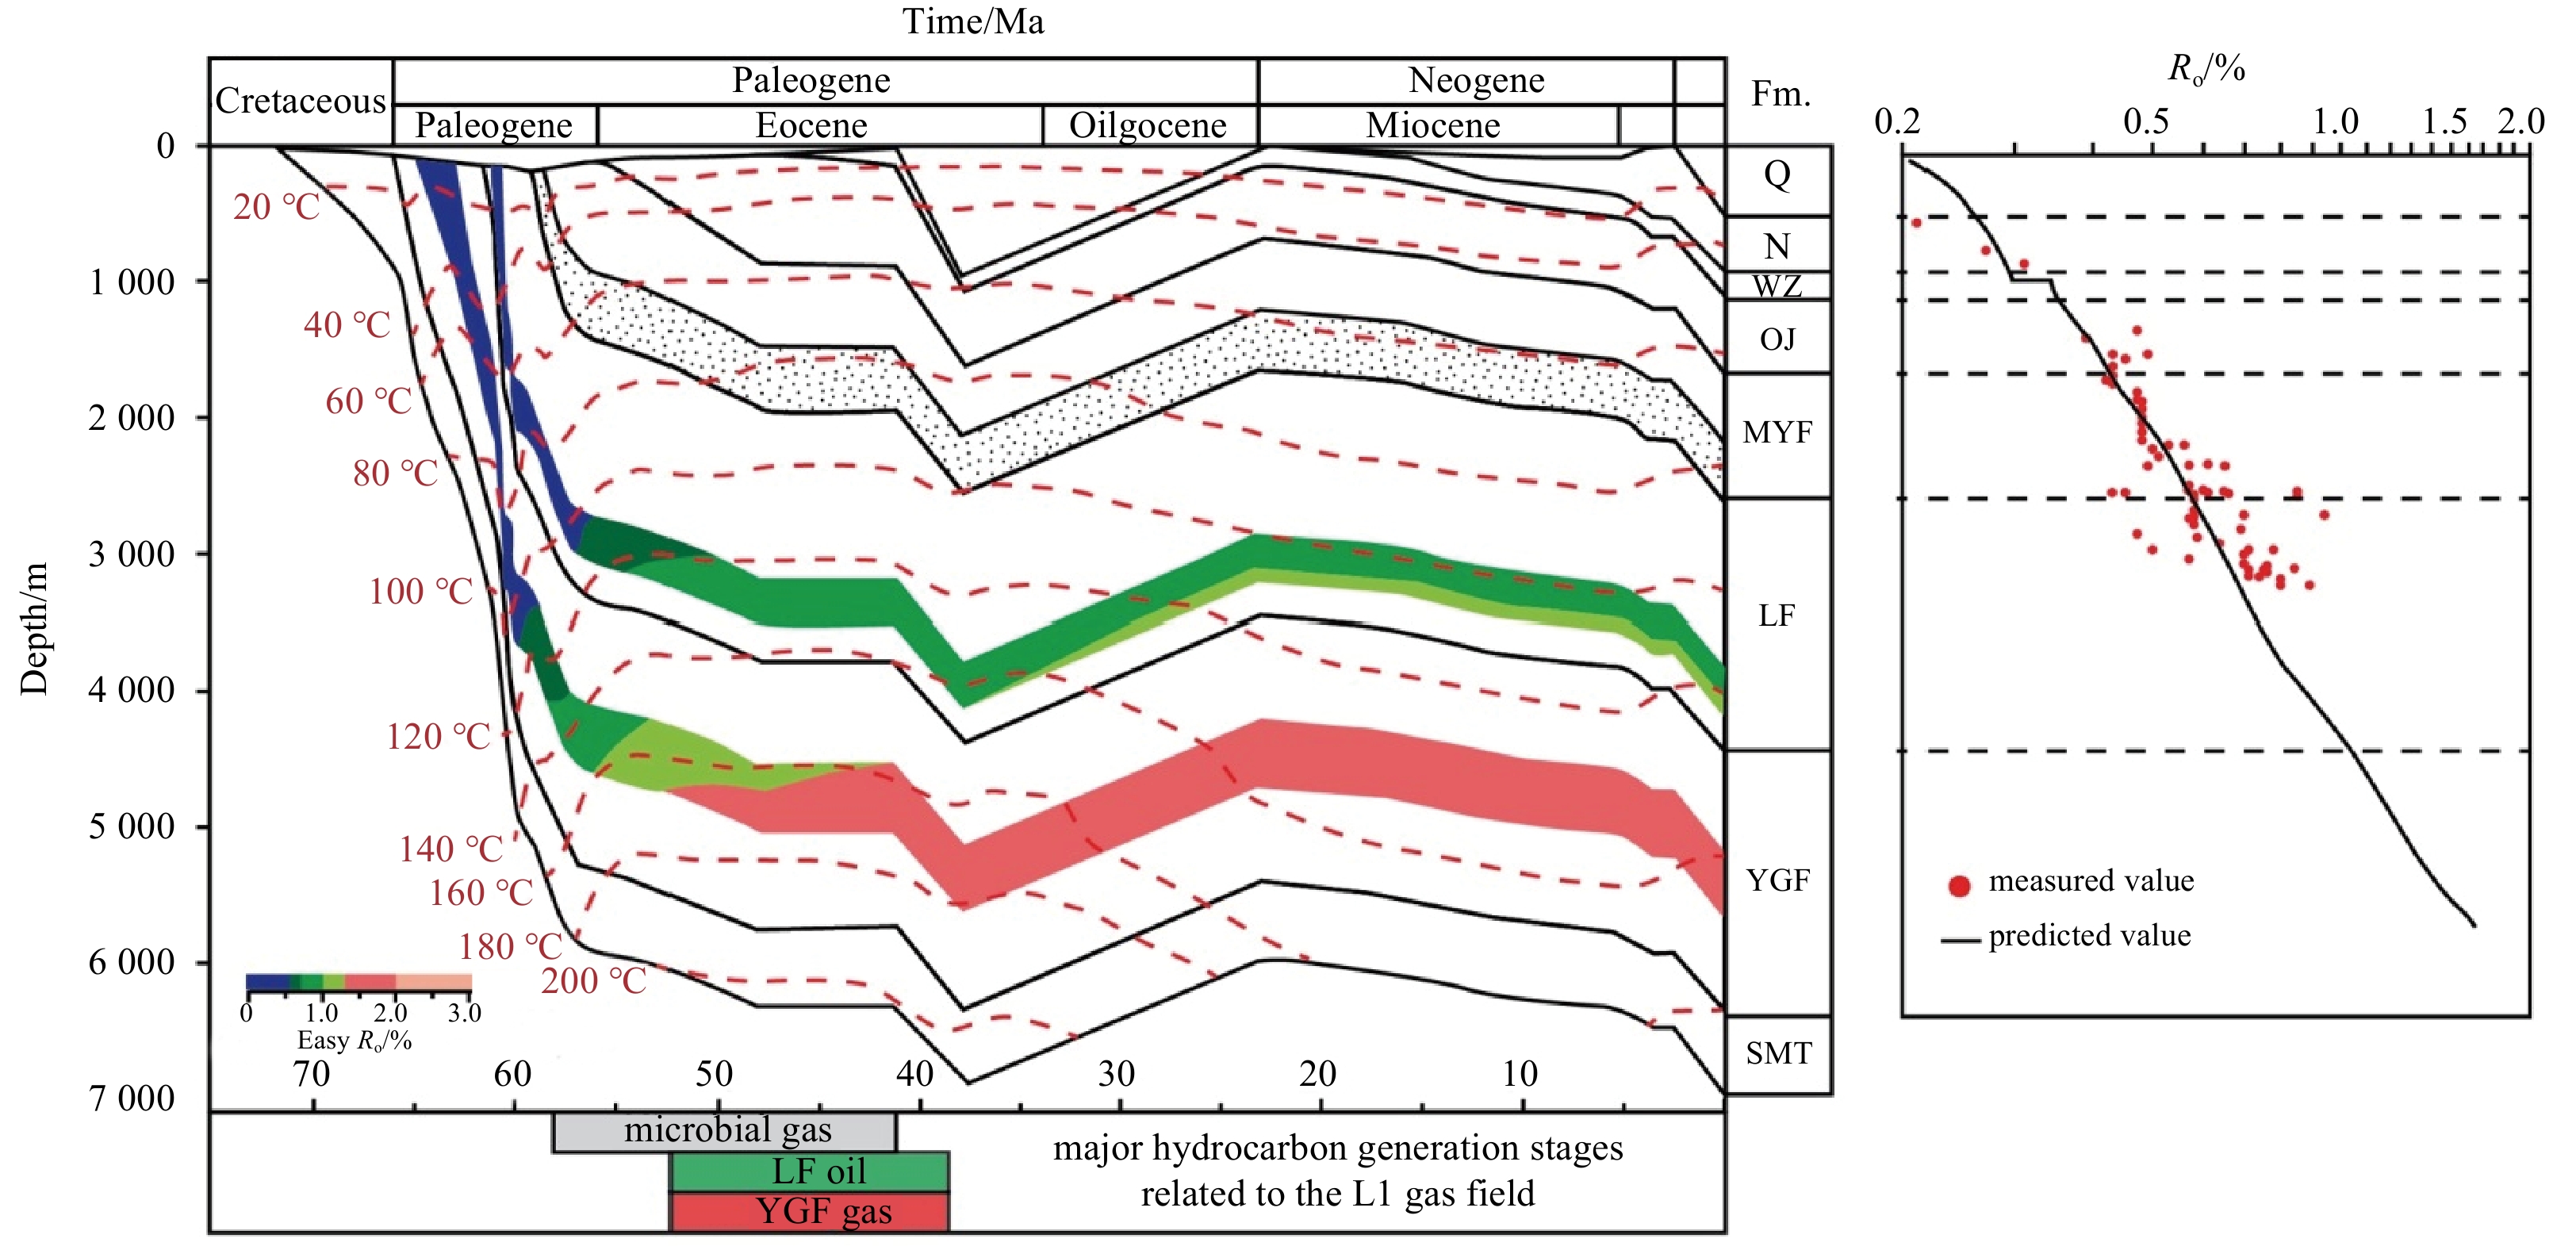
Figure 12. Schematic burial-thermal histories reconstructed for the Well L1 by the 1D model of PetroMod software. Thermal evolutions and major hydrocarbon generation histories of both Yueguifeng and Lingfeng source rocks have been highlighted. Easy Ro is calculated after Sweeney and Burnham (1990). MYF, Mingyuefeng; LF, Lingfeng.; YGF, Yueguifeng; SMT, Shimentan; OJ, Oujiang; WZ, Wenzhou; N, Neogene; Q, Quaternary; Fm., formation.
Table 1. Selected published studies investigating the origins of hydrocarbon fluids in the L1 gas pool
Study Sample Interpreted origin Sun and Xi (2003) gas mixture of mid- to high-maturity sapropelic-type gas from the Yueguifeng Formation and low- to mid-maturity
humic-type gas from the Lingfeng Formationoil from the Lingfeng and Mingyuefeng formations Chen et al. (2008) gas mid-maturity sapropelic-type gas from the Yueguifeng Formation Ge et al. (2012) oil from the Lingfeng and Mingyuefeng formations Su et al. (2014) gas mixture of high-maturity sapropelic-type gas from the Yueguifeng Formation and the low maturity humic-type gas from the Mingyuefeng Formation oil predominantly low-maturity humic-type oil from the Mingyuefeng Formation Li et al. (2021) gas predominantly oil-associated gas from the Yueguifeng Formation oil predominantly from the Lingfeng Formation with a minor portion from the Yueguifeng Formation This study gas mixture of primary microbial methane from the Mingyuefeng Formation and mid-maturity sapropelic-type gas from the Yueguifeng Formation oil early- to mid-maturity humic-type oil from the Lingfeng Formation  下载: 导出CSV
Table 2. Molecular compositions and gas ratios of natural gases from the L1 gas pool
Well Formation Chemical composition (volume)/% Gas ratio Data source C1 C2 C3 i-C4 n-C4 i-C5 n-C5 CO2 N2 C1/Σ(C1−C5) C1/(C2+C3) Production wells MYF 56.55 3.74 2.11 0.50 0.64 0.26 0.19 32.86 3.09 0.88 9.66 this paper MYF 54.45 3.59 2.03 0.48 0.62 0.25 0.19 35.70 2.64 0.88 9.70 MYF 51.83 3.40 1.92 0.45 0.59 0.24 0.18 38.44 2.91 0.88 9.75 MYF 54.60 3.67 2.09 0.49 0.64 0.26 0.19 34.73 3.28 0.88 9.48 MYF 51.97 3.40 1.91 0.45 0.58 0.24 0.17 38.27 2.94 0.88 9.78 Discovery well MYF 55.45 3.63 1.88 0.42 0.47 0.15 0.09 34.15 3.55 0.89 10.06 DST MYF 55.10 3.67 1.92 0.43 0.48 0.16 0.09 34.50 3.44 0.89 9.86 Note: MYF, Mingyuefeng; DST, drill stem test.
下载: 导出CSV
Table 3. Stable carbon and deuterium isotopes of natural gases from the L1 gas pool
Well Formation C isotope/‰ H isotope/‰ Data source C1 C2 C3 i-C4 n-C4 i-C5 n-C5 CO2 C1 Production wells MYF –46.87 –30.29 –27.59 –28.42 –26.67 –26.61 –26.30 –6.92 –173.80 this paper MYF –46.73 –30.24 –27.59 –28.34 –26.67 –26.42 –26.20 –6.88 –173.11 MYF –46.58 –30.15 –27.56 –28.44 –26.42 –26.67 –26.01 –6.77 –177.00 MYF –46.58 –30.11 –27.44 –28.36 –26.63 –26.25 –25.83 –7.10 –175.06 MYF –46.62 –30.01 –27.34 –28.15 –26.86 –26.05 –26.37 –6.62 –174.98 Discovery well MYF –46.30 –29.55 –26.96 – –26.86 – – –5.03 – DST MYF –46.13 –29.31 –27.07 – –26.93 – – –4.67 –
下载: 导出CSV
Table 4. Bulk compositional and physical characteristics of oil samples from the L1 gas pool
Well Formation Density/(g·cm−3) S content/% SARA Data source SAT/% ARO/% NSO/% ASP/% Production wells MYF 0.752 0.0063 87.9 11.4 0.5 0.2 this paper MYF 0.753 0.0063 88.8 10.7 0.4 0.1 MYF 0.761 0.0081 88.2 11.0 0.6 0.2 MYF 0.754 0.0063 87.4 11.9 0.6 0.1 MYF 0.752 0.0058 88.1 11.1 0.6 0.2 Discovery well MYF 0.751 0.0130 95.5 3.9 0.5 0.1 DST MYF 0.751 0.0130 91.2 7.4 1.2 0.2 Note: SAT, saturated hydrocarbons; ARO, aromatic hydrocarbons; NSO, resins; ASP, asphaltenes.
下载: 导出CSV
Table 5. Light hydrocarbon parameters of the oil samples from the L1 gas pool
Well Formation C7/% iso-heptane
valuen-heptane
valueParaffinicity Aromaticity 2, 4-DMP/
2, 3-DMPData source n-C7 MCH ΣDMCP Production wells MYF 20.46 60.27 19.27 1.00 14.99 0.34 0.49 0.42 this paper MYF 20.32 60.45 19.24 0.98 14.92 0.34 0.50 0.42 MYF 19.95 61.24 18.81 0.97 14.80 0.33 0.50 0.41 MYF 20.34 60.24 19.42 0.99 14.89 0.34 0.50 0.42 MYF 20.44 60.01 19.56 0.99 14.88 0.34 0.51 0.43 Discovery well MYF 20.52 59.73 19.75 2.00 13.59 0.34 0.39 – DST MYF 18.71 61.28 20.00 1.92 12.76 0.31 0.04 – Note: n-C7%=n-C7×100/(n-C7+MCH+∑DMCP); MCH%=MCH×100/(n-C7+MCH+∑DMCP); ∑DMCP%=∑DMCP×100/(n-C7+MCH+∑DMCP). iso-heptane value=(2-MH+3-MH)/(t-1, 2-DMCP+c-1, 3-DMCP+t-1, 3-DMCP); n-heptane value=(100×n-C7)/(CH+2-MH+1,1-DMCP+3-MH+c-1,3-DMCP+t-1,3-DMCP+t-1,2-DMCP+n-C7+MCH); paraffinicity=n-heptane/methylcyclohexane; aromaticity=toluene/n-heptane.
下载: 导出CSV
Table 6. Selected geochemical parameters of source rock samples and carbon isotopic compositions of thermal simulation products (modified after Chen et al., 2008).
Well Formation Source rock assessment Simulation
T/℃Yield rate of hydrocarbons/
(mL·g−1)C isotopes of simulated gas/‰ Data
sourceTOC/% Ro/% HI/(mg·g−1) δ13C/‰ C1 C2 C3 i-C4 n-C4 W1 YGF 2.65 0.58 344 –26.3 425 98.67 –37.96 –30.92 –29.61 –29.23 –27.95 Chen
et al. (2008)YGF 2.65 0.58 344 –26.3 450 146.64 –36.95 –30.33 –26.83 –26.09 –22.78 W2 YGF 2.89 1.07 74 –28.1 450 43.01 –42.18 –23.39 –17.71 – – LF 1.61 0.88 80 –26.4 450 66.07 –31.43 –19.97 –12.98 – – L1 LF 0.85 0.8 69 –25.3 450 64.47 –33.06 –21.04 –15.28 – – Note: YGF, Yueguifeng; LF, Lingfeng. See Fig. 1b for well locations.
下载: 导出CSV
-
BeMent W O, Levey R A, Mango F D. 1995. The temperature of oil generation as defined with C7 chemistry maturity parameter (2, 4-DMP/2, 3-DMP ratio). In: Grimalt J O, Dorronsoro C, eds. Organic Geochemistry: Developments and Applications to Energy, Climate, Environment and Human History. Donostian-San Sebastian: European Association of Organic Geochemists, 505–507 Bernard B B, Brooks J M, Sackett W M. 1976. Natural gas seepage in the Gulf of Mexico. Earth and Planetary Science Letters, 31(1): 48–54. doi: 10.1016/0012-821X(76)90095-9 Berner U, Faber E. 1996. Empirical carbon isotope/maturity relationships for gases from algal kerogens and terrigenous organic matter, based on dry, open-system pyrolysis. Organic Geochemistry, 24(10/11): 947–955 Cesar J, Nightingale M, Becker V, et al. 2020. Stable carbon isotope systematics of methane, ethane and propane from low-permeability hydrocarbon reservoirs. Chemical Geology, 558: 119907. doi: 10.1016/j.chemgeo.2020.119907 Chen Jianping, Ge Heping, Chen Xiaodong, et al. 2008. Classification and origin of natural gases from Lishui Sag, the East China Sea Basin. Science in China Series D: Earth Sciences, 51(1): 122–130 Chung H M, Gormly J R, Squires R M. 1988. Origin of gaseous hydrocarbons in subsurface environments: theoretical considerations of carbon isotope distribution. Chemical Geology, 71(1–3): 97–104 Cukur D, Horozal S, Kim D C, et al. 2011. Seismic stratigraphy and structural analysis of the northern East China Sea Shelf Basin interpreted from multi-channel seismic reflection data and cross-section restoration. Marine and Petroleum Geology, 28(5): 1003–1022. doi: 10.1016/j.marpetgeo.2011.01.002 Dai Jinxing, Gong Deyu, Ni Yunyan, et al. 2014. Stable carbon isotopes of coal-derived gases sourced from the Mesozoic coal measures in China. Organic Geochemistry, 74: 123–142. doi: 10.1016/j.orggeochem.2014.04.002 Dai Jinxing, Pei Xigu, Qi Houfa. 1992. Natural Gas Geology in China, vol. 1 (in Chinese). Beijing: Petroleum Industry Press, 35–86 Ge Heping, Chen Xiaodong, Diao Hui, et al. 2012. An analysis of oil geochemistry and sources in Lishui sag, East China Sea basin. China Offshore Oil and Gas (in Chinese), 24(4): 8–12,31 Hu Guoyi, Li Jian, Li Jin, et al. 2008. Preliminary study on the origin identification of natural gas by the parameters of light hydrocarbon. Science in China Series D: Earth Sciences, 51(S1): 131–139. doi: 10.1007/s11430-008-5017-x Hu Guoyi, Peng Weilong, Yu Cong. 2017. Insight into the C8 light hydrocarbon compositional differences between coal-derived and oil-associated gases. Journal of Natural Gas Geoscience, 2(3): 157–163. doi: 10.1016/j.jnggs.2017.08.001 Huang Yaohao, Tarantola A, Lu Wanjun, et al. 2020. CH4 accumulation characteristics and relationship with deep CO2 fluid in Lishui sag, East China Sea Basin. Applied Geochemistry, 115: 104563. doi: 10.1016/j.apgeochem.2020.104563 Katz B J. 2011. Microbial processes and natural gas accumulations. The Open Geology Journal, 5: 75–83. doi: 10.2174/1874262901105010075 Li Deyong, Dong Bingjie, Jiang Xiaodian, et al. 2016. Geochemical evidence for provenance and tectonic background from the Palaeogene sedimentary rocks of the East China Sea Shelf Basin. Geological Journal, 51(S1): 209–228 Li Yang, Zhang Jinliang, Liu Yang, et al. 2019. Organic geochemistry, distribution and hydrocarbon potential of source rocks in the Paleocene, Lishui Sag, East China Sea Shelf Basin. Marine and Petroleum Geology, 107: 382–396. doi: 10.1016/j.marpetgeo.2019.05.025 Li Yang, Zhang Jinliang, Xu Yaohui, et al. 2021. Improved understanding of the origin and accumulation of hydrocarbons from multiple source rocks in the Lishui Sag: Insights from statistical methods, gold tube pyrolysis and basin modeling. Marine and Petroleum Geology, 134: 105361. doi: 10.1016/j.marpetgeo.2021.105361 Liang Jintong, Wang Hongliang. 2019. Cenozoic tectonic evolution of the East China Sea Shelf Basin and its coupling relationships with the Pacific Plate subduction. Journal of Asian Earth Sciences, 171: 376–387. doi: 10.1016/j.jseaes.2018.08.030 Liu Quanyou, Wu Xiaoqi, Wang Xiaofeng, et al. 2019. Carbon and hydrogen isotopes of methane, ethane, and propane: A review of genetic identification of natural gas. Earth-Science Reviews, 190: 247–272. doi: 10.1016/j.earscirev.2018.11.017 Mango F D. 1987. An invariance in the isoheptanes of petroleum. Science, 237(4814): 514–517. doi: 10.1126/science.237.4814.514 Mango F D. 1990. The origin of light hydrocarbons in petroleum: a kinetic test of the steady-state catalytic hypothesis. Geochimica et Cosmochimica Acta, 54(5): 1315–1323. doi: 10.1016/0016-7037(90)90156-F Mango F D. 1997. The light hydrocarbons in petroleum: a critical review. Organic Geochemistry, 26(7–8): 417–440 Milkov A V, Dzou, L. 2007. Geochemical evidence of secondary microbial methane from very slight biodegradation of undersaturated oils in a deep hot reservoir. Geology, 35(5): 455–458. doi: 10.1130/G23557A.1 Milkov A V. 2021. New approaches to distinguish shale-sourced and coal-sourced gases in petroleum systems. Organic Geochemistry, 158: 104271. doi: 10.1016/j.orggeochem.2021.104271 Milkov A V, Etiope G. 2018. Revised genetic diagrams for natural gases based on a global dataset of >20, 000 samples. Organic Geochemistry, 125: 109–120. doi: 10.1016/j.orggeochem.2018.09.002 Schellart W P, Lister G S. 2005. The role of the East Asian active margin in widespread extensional and strike-slip deformation in East Asia. Journal of the Geological Society, 162(6): 959–972. doi: 10.1144/0016-764904-112 Schoell M. 1980. The hydrogen and carbon isotopic composition of methane from natural gases of various origins. Geochimica et Cosmochimica Acta, 44(5): 649–661. doi: 10.1016/0016-7037(80)90155-6 Schoell M. 1983. Genetic characterization of natural gases. AAPG Bulletin, 67(12): 2225–2238 Su Ao, Chen Honghan, Cao Laisheng, et al. 2014. Genesis, source and charging of oil and gas in Lishui Sag, East China Sea Basin. Petroleum Exploration and Development, 41(5): 574–584. doi: 10.1016/S1876-3804(14)60068-9 Sun Yumei, Xi Xiaoying. 2003. Petroleum reservoir filling history and oil-source correlation in the Lishui Sag, East China Sea Basin. Petroleum Exploration and Development, 30(6): 24–28 Sweeney J J, Burnham A K. 1990. Evaluation of a simple model of vitrinite reflectance based on chemical kinectics. AAPG Bulletin, 74(10): 1559–1570 Tang Y, Perry J K, Jenden P D, et al. 2000. Mathematical modeling of stable carbon isotope ratios in natural gases. Geochimica et Cosmochimica Acta, 64(15): 2673–2687. doi: 10.1016/S0016-7037(00)00377-X Ten Haven H L. 1996. Applications and limitations of Mango’s light hydrocarbon parameters in petroleum correlation studies. Organic Geochemistry, 24(10/11): 957–976 Thompson K F M. 1983. Classification and thermal history of petroleum based on light hydrocarbons. Geochimica et Cosmochimica Acta, 47(2): 303–316. doi: 10.1016/0016-7037(83)90143-6 Thompson K F M. 1987. Fractionated aromatic petroleums and the generation of gas-condensates. Organic Geochemistry, 11(6): 573–590. doi: 10.1016/0146-6380(87)90011-8 Vandré C, Cramer B, Gerling P, et al. 2007. Natural gas formation in the western Nile delta (Eastern Mediterranean): Thermogenic versus microbial. Organic Geochemistry, 38(4): 523–539. doi: 10.1016/j.orggeochem.2006.12.006 Wang Xiaofeng, Liu Wenhui, Shi Baoguang, et al. 2015. Hydrogen isotope characteristics of thermogenic methane in Chinese sedimentary basins. Organic Geochemistry, 83–84: 178–189 Whiticar M J. 1996. Isotope tracking of microbial methane formation and oxidation. Internationale Vereinigung für Theoretische und Angewandte Limnologie: Mitteilungen, 25(1): 39–54 Whiticar M J. 1999. Carbon and hydrogen isotope systematics of bacterial formation and oxidation of methane. Chemical Geology, 161(1–3): 291–314 Whiticar M J. 2020. The biogeochemical methane cycle. In: Wilkes H, ed. Hydrocarbons, Oils and Lipids: Diversity, Origin, Chemistry and Fate. Springer, 669–746 Yang Shuchun, Hu Shengbiao, Cai Dongsheng, et al. 2004. Present-day heat flow, thermal history and tectonic subsidence of the East China Sea Basin. Marine and Petroleum Geology, 21(9): 1095–1105. doi: 10.1016/j.marpetgeo.2004.05.007 -


 点击查看大图
计量
- 文章访问数: 489
- HTML全文浏览量: 165
- PDF下载量: 28
- 被引次数: 0

