

-
Abstract: In order to characterize the features of radium isotopes in estuaries of Tianjin, a continuous survey and sampling of typical estuaries were conducted from 2013 to 2017 in this study. The activities of natural radioactive radium isotopes (223Ra, 224Ra, and 228Ra) in groundwater and surface water were measured by the radium-delayed coincidence counting (RaDeCC) system. The non-conservative behavior of the radium isotopes was investigated under hydrogeochemical conditions and urbanization. The results indicated that in terms of horizontal distribution, the activities of radium in groundwater (Hangu, Tanggu, and Dagang) showed an upward trend from north to south and demonstrated a higher figure than surface water (Haihe River and Duliujian River). Concerning the vertical distribution, the activitives of radium at a 15 m burial depth was higher than that at a 30 m burial depth in all measurements. The activities of radium isotopes in the study area increased with the increase of total dissolved solids, and their desorption behavior on Fe-Mn oxides was constrained by the redox intensity. Different hydrogeological conditions resulted in variations in the vertical profile of radium activities. The activity of radium was regulated by seasonal variation and precipitation in groundwater and surface water. In addition, the rapid urbanization has caused a significant impact on the features of radium isotopes in typical estuaries of Tianjin. Meanwhile, radium isotopes can be applied to reflect the impact of urbanization on surface water-groundwater systems. Clarifying and cleverly utilizing the relationship between behavior of radium isotopes and urbanization will promote the development of the Tianjin Binhai New Area in a healthy way.
-
Key words:
- estuary /
- radium isotope /
- total dissolved solids /
- ionic strength /
- urbanization
-
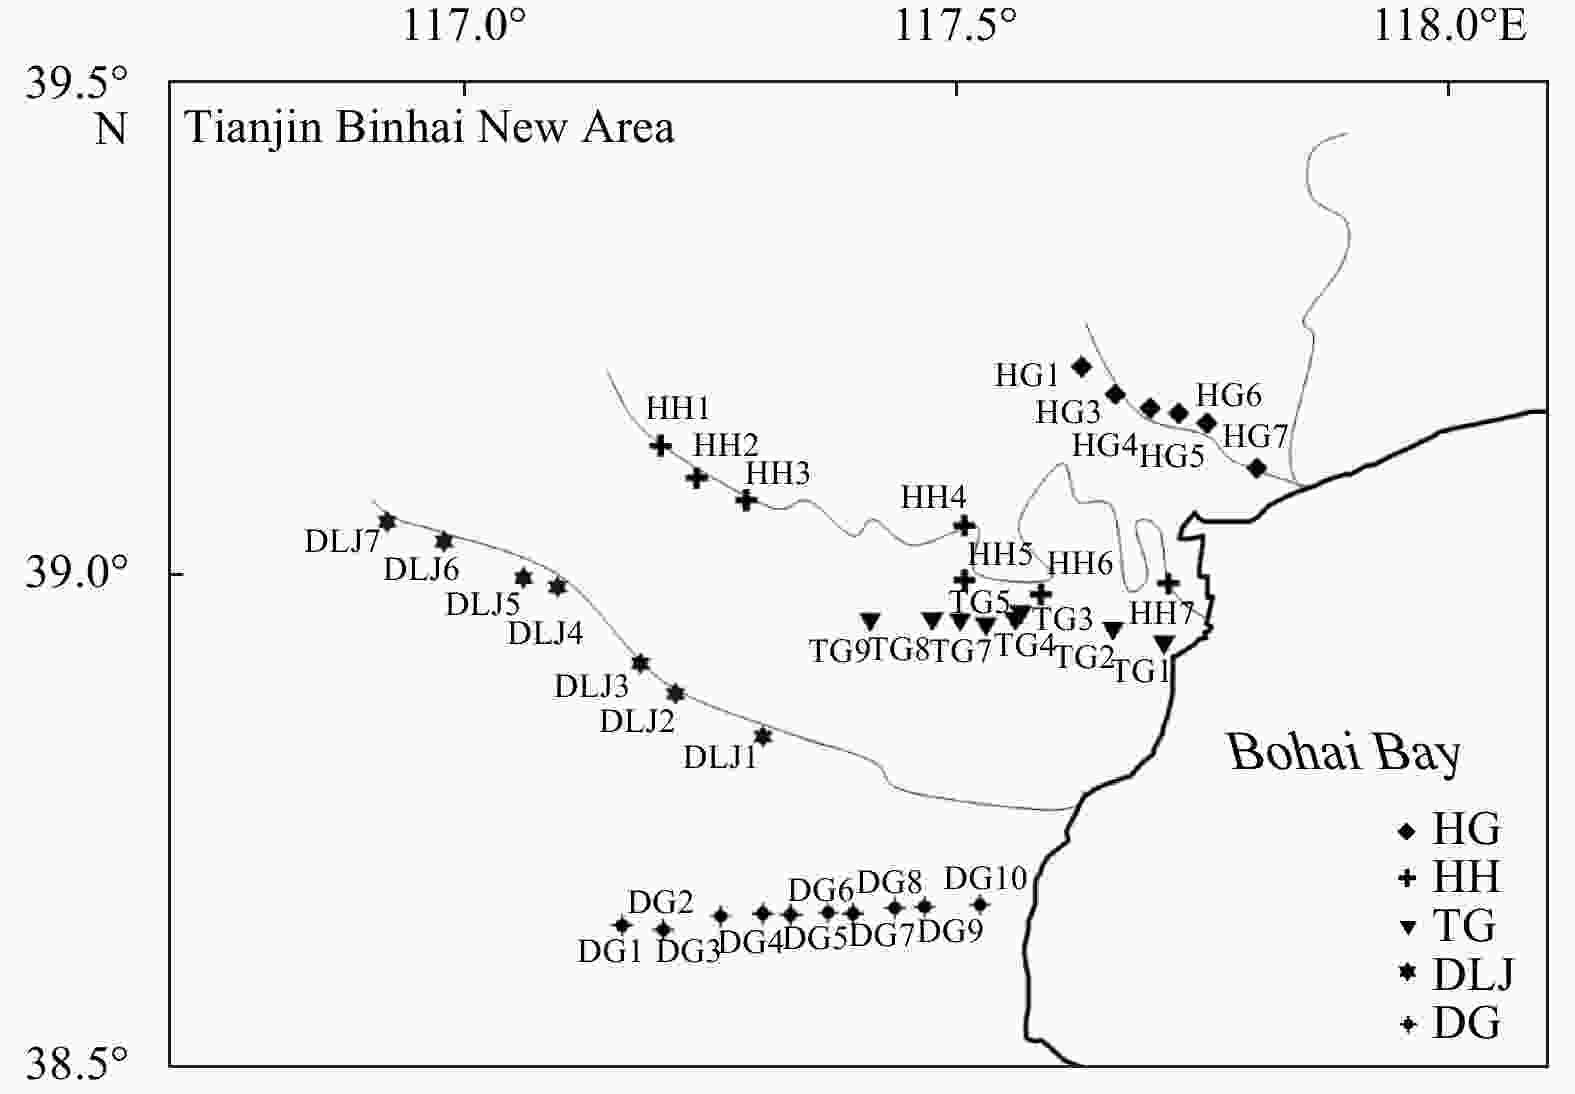
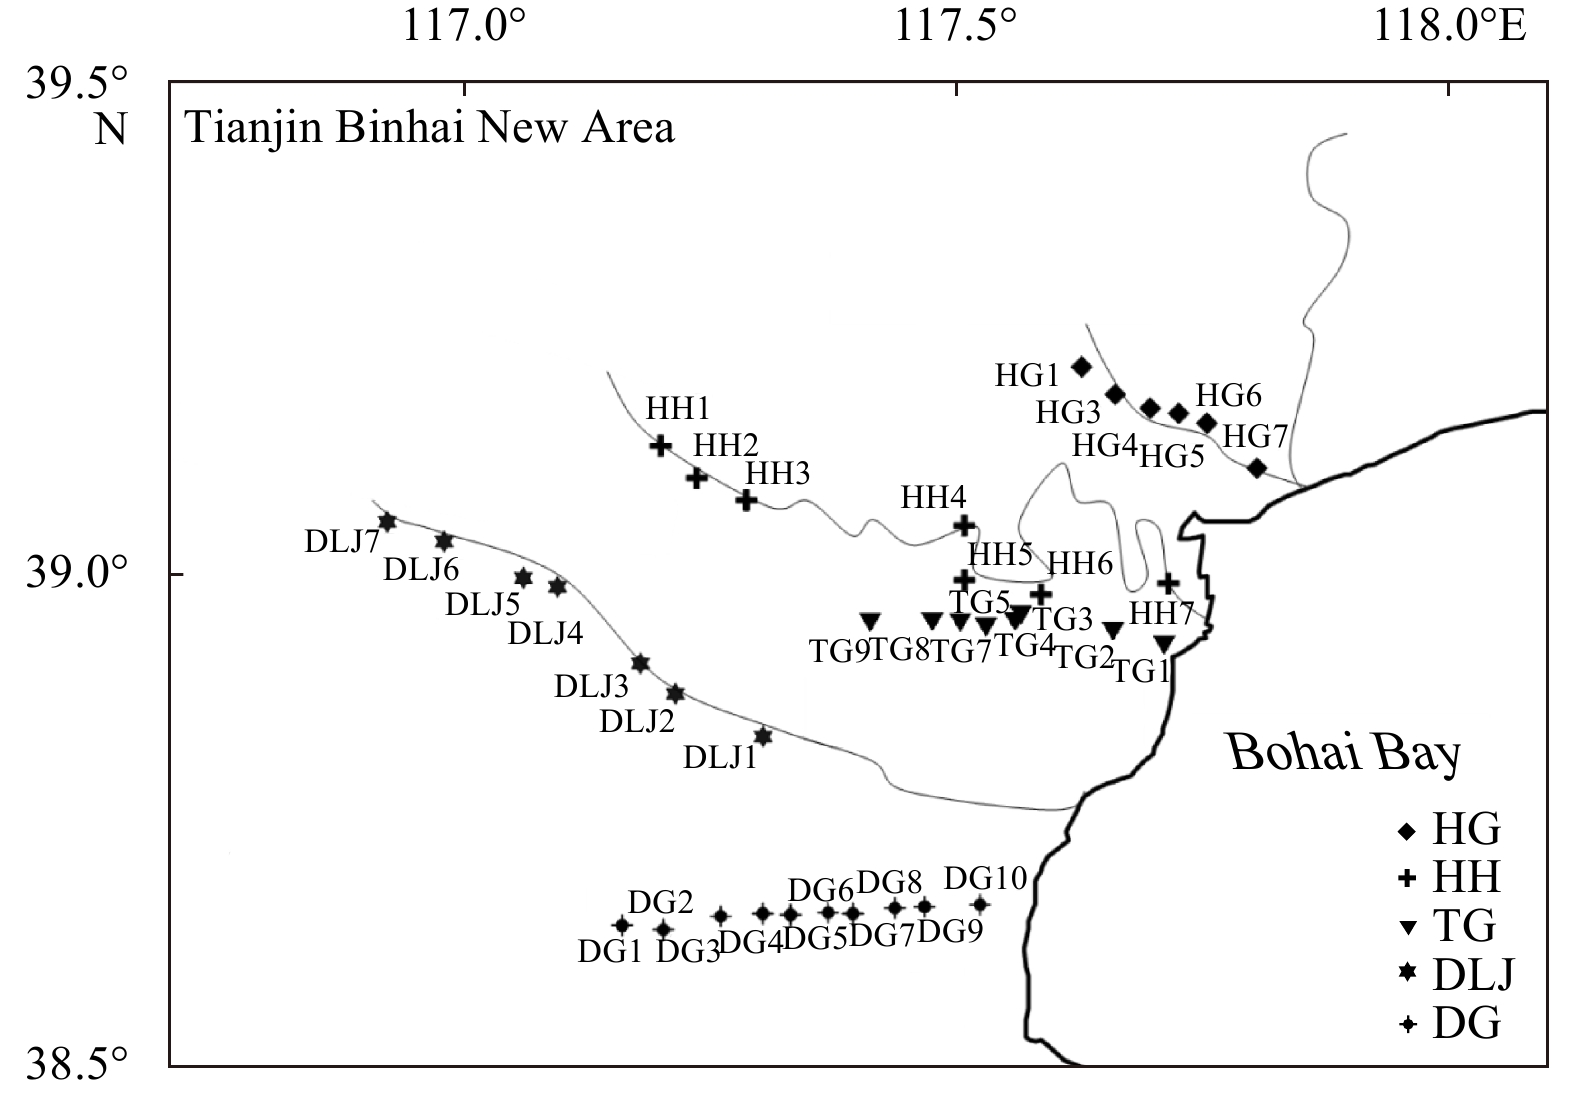
Figure 1. The scope of the study area and sampling stations. HG: Hangu; TG: Tanggu; DG: Dagang; HH: Haihe River; DLJ: Duliujian River.
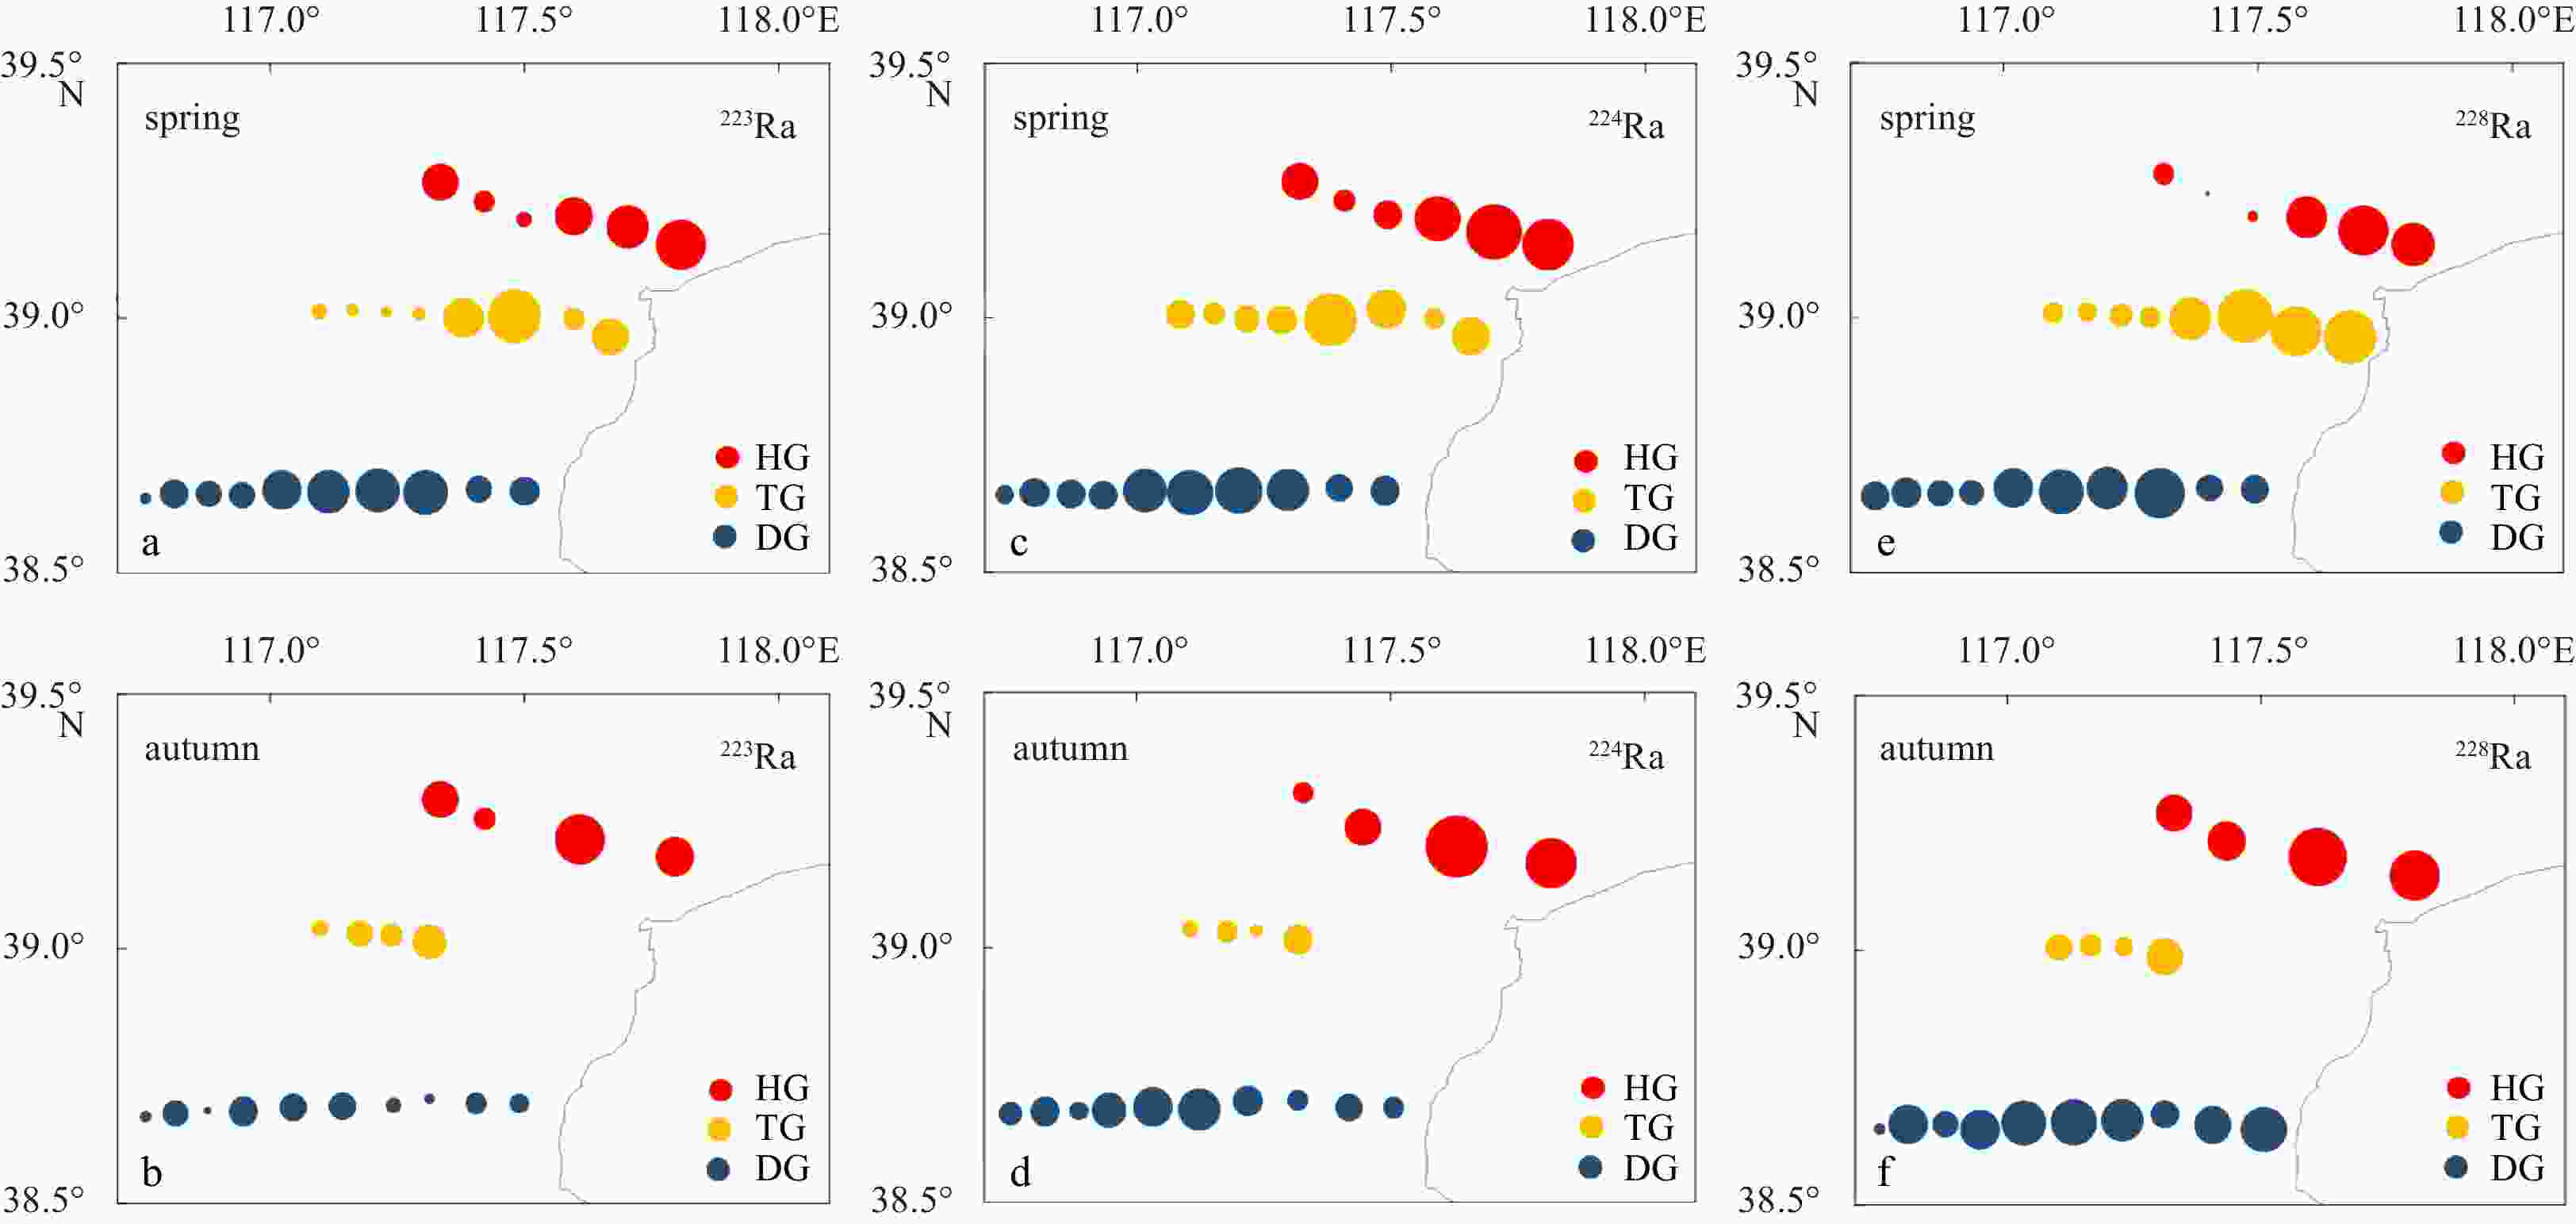
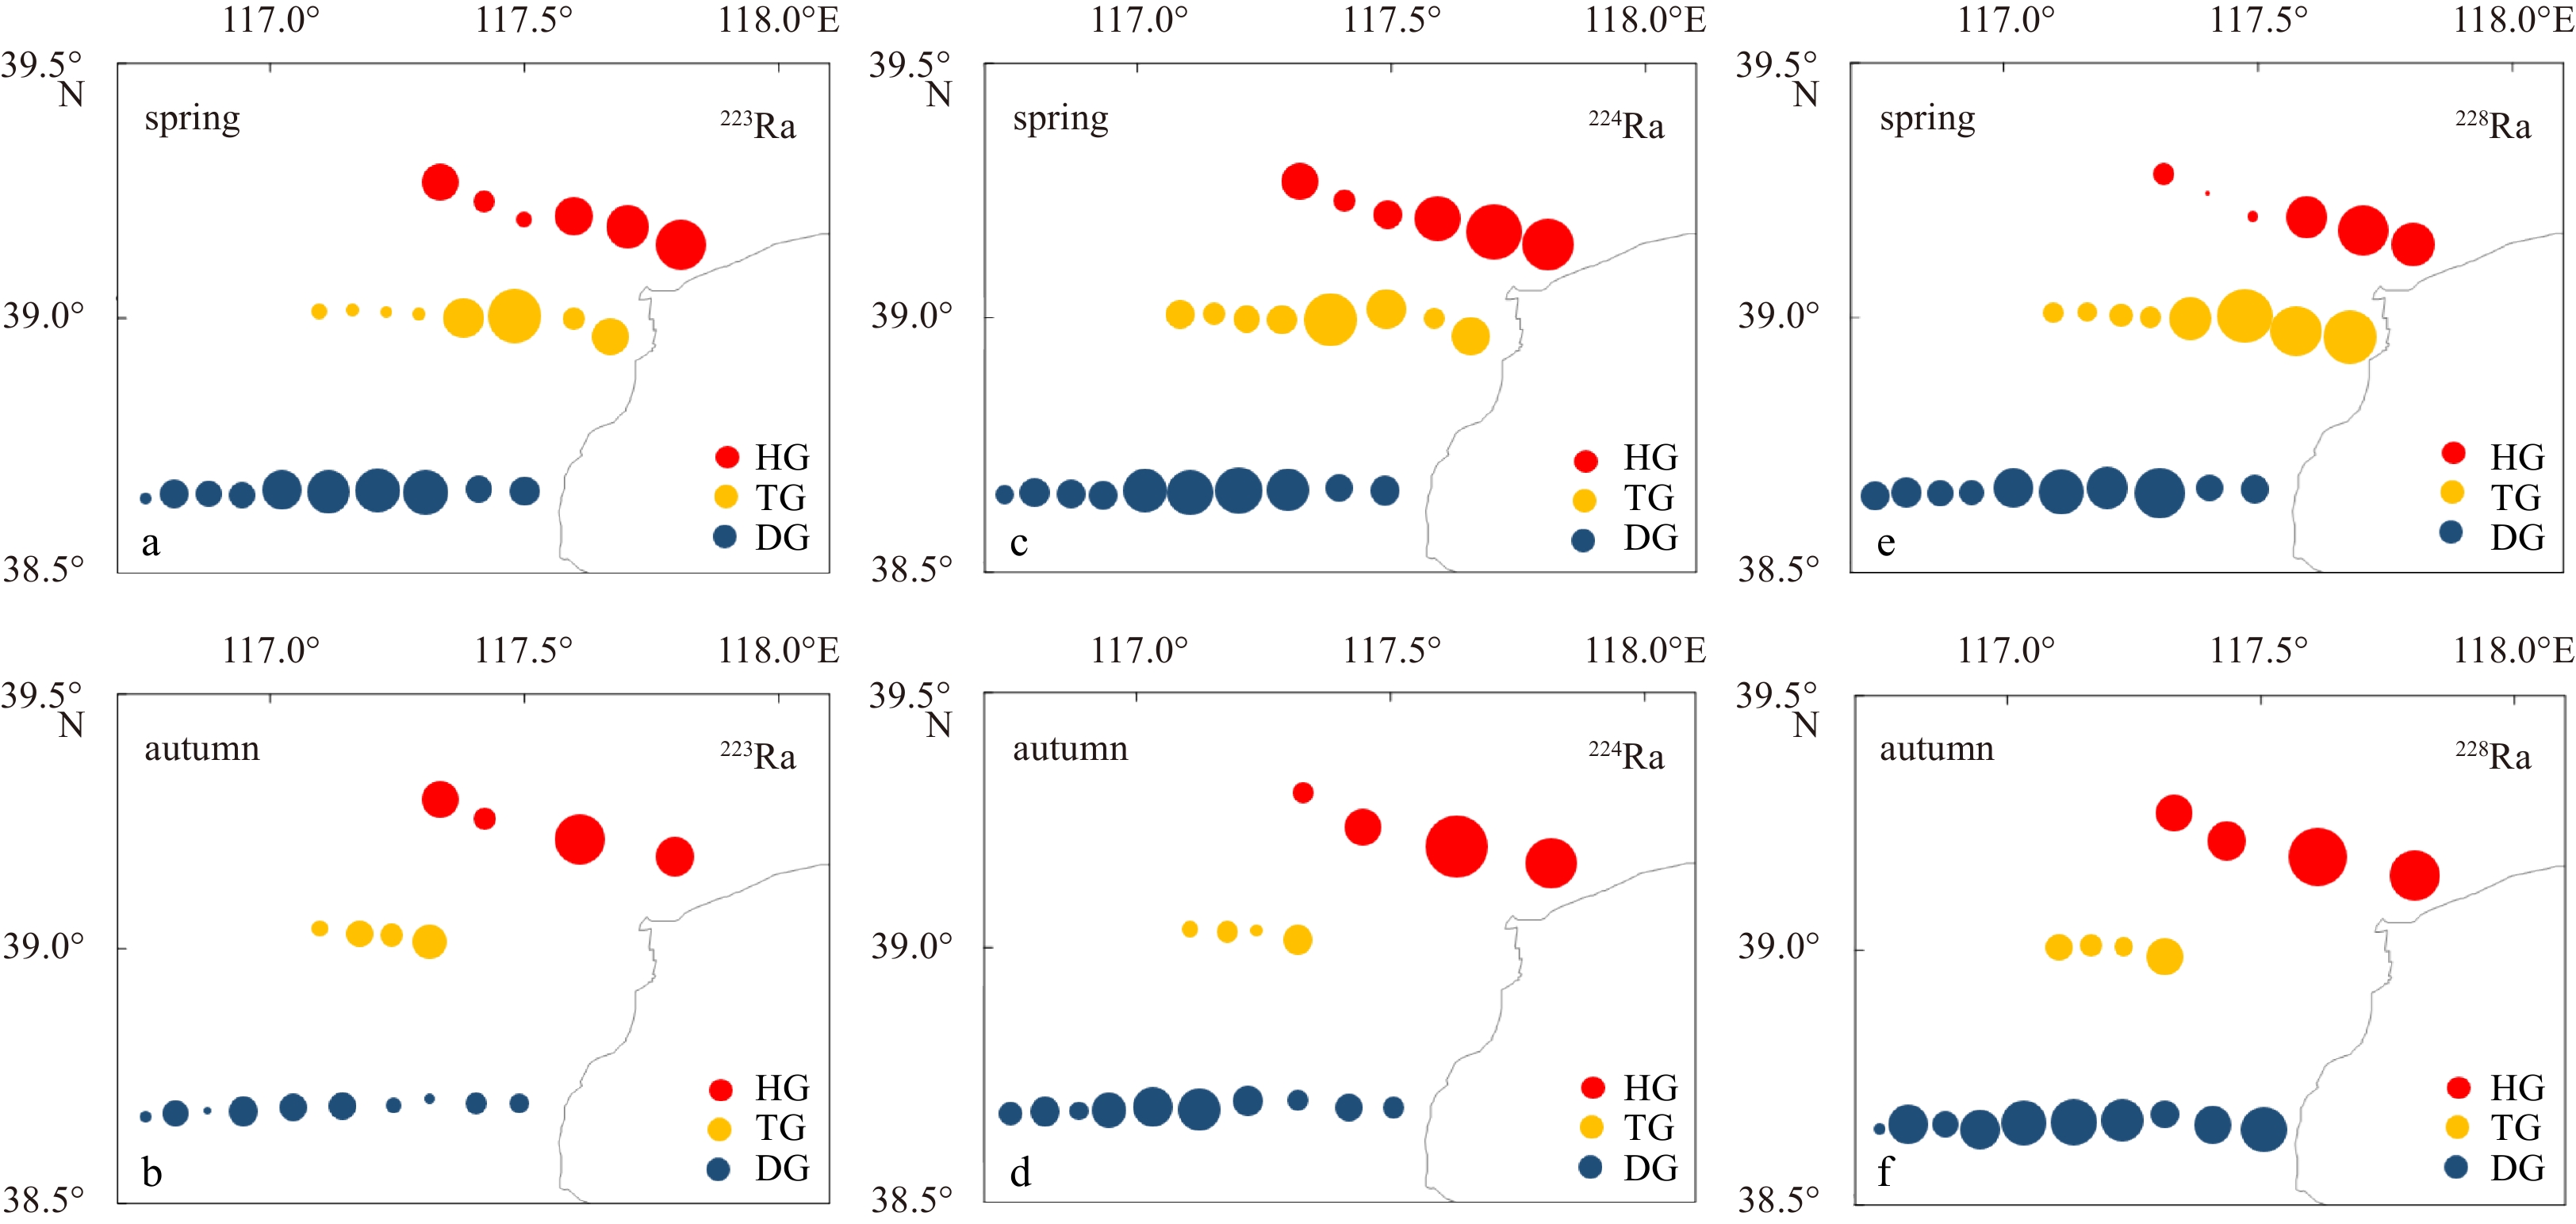
Figure 2. Horizontal distribution of 223Ra (a, b), 224Ra (c, d) and 228Ra (e, f) activities in groundwater (HG: Hangu; TG: Tanggu; DG: Dagang).
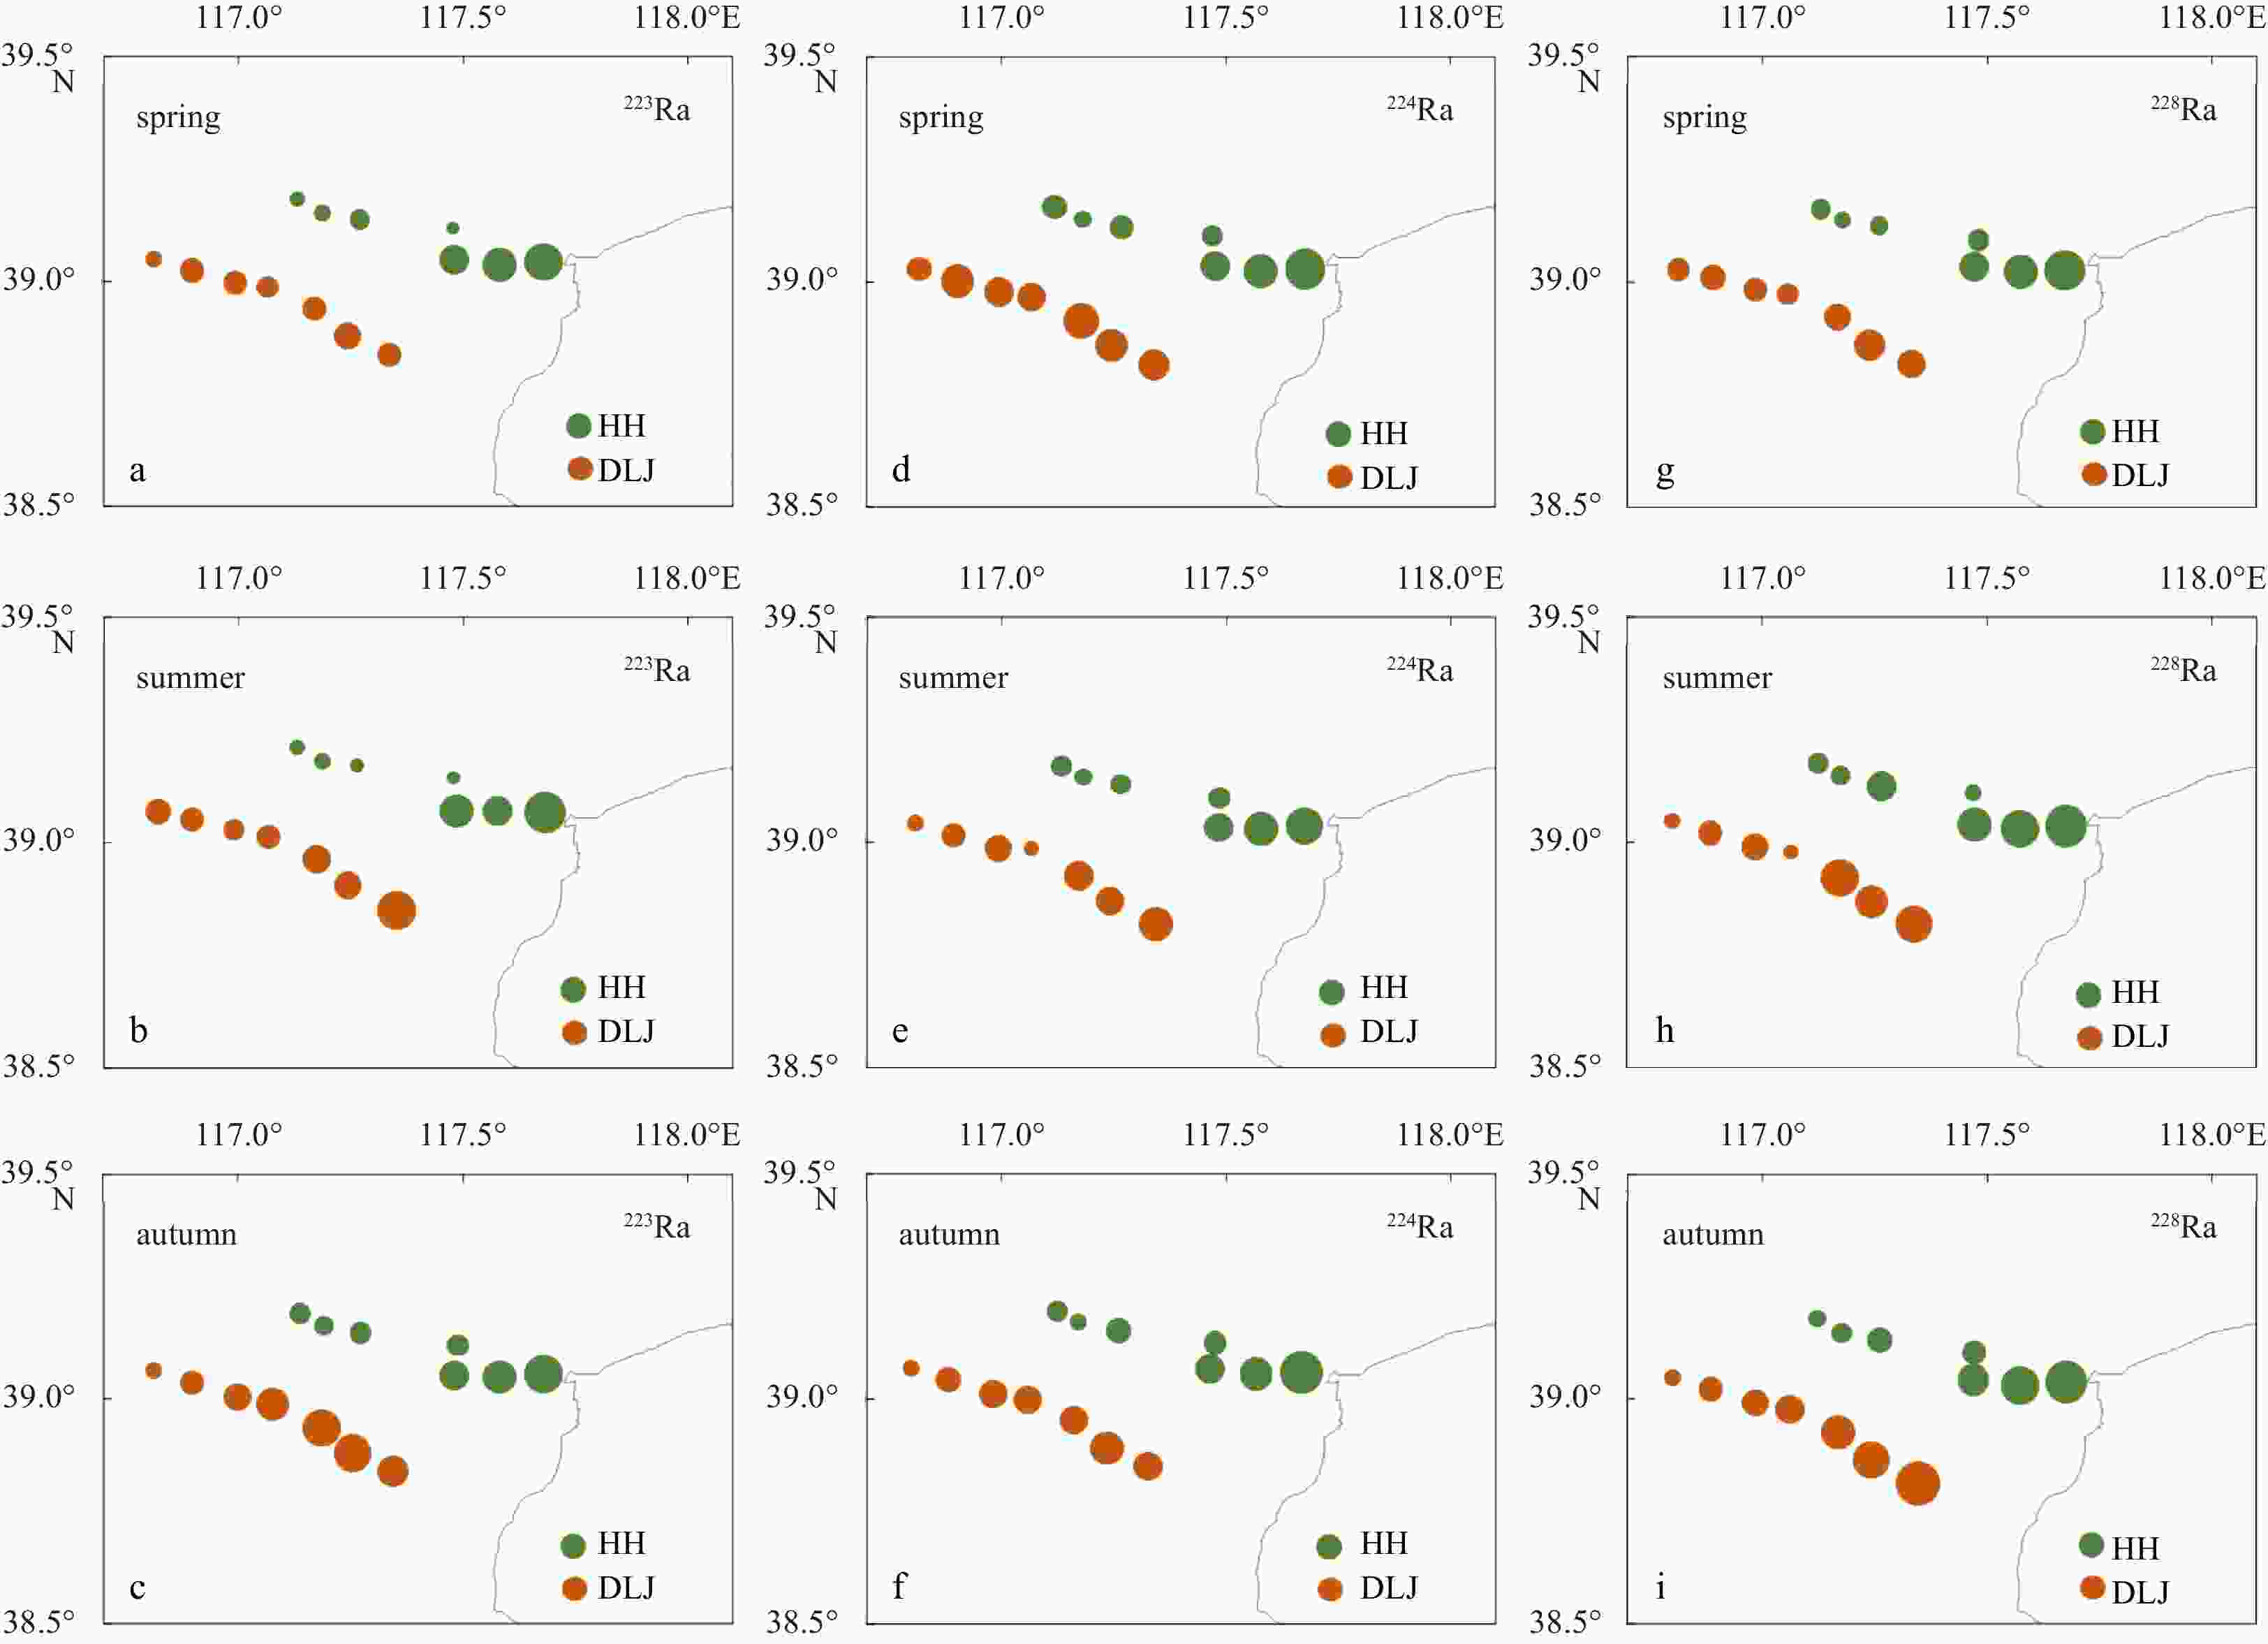
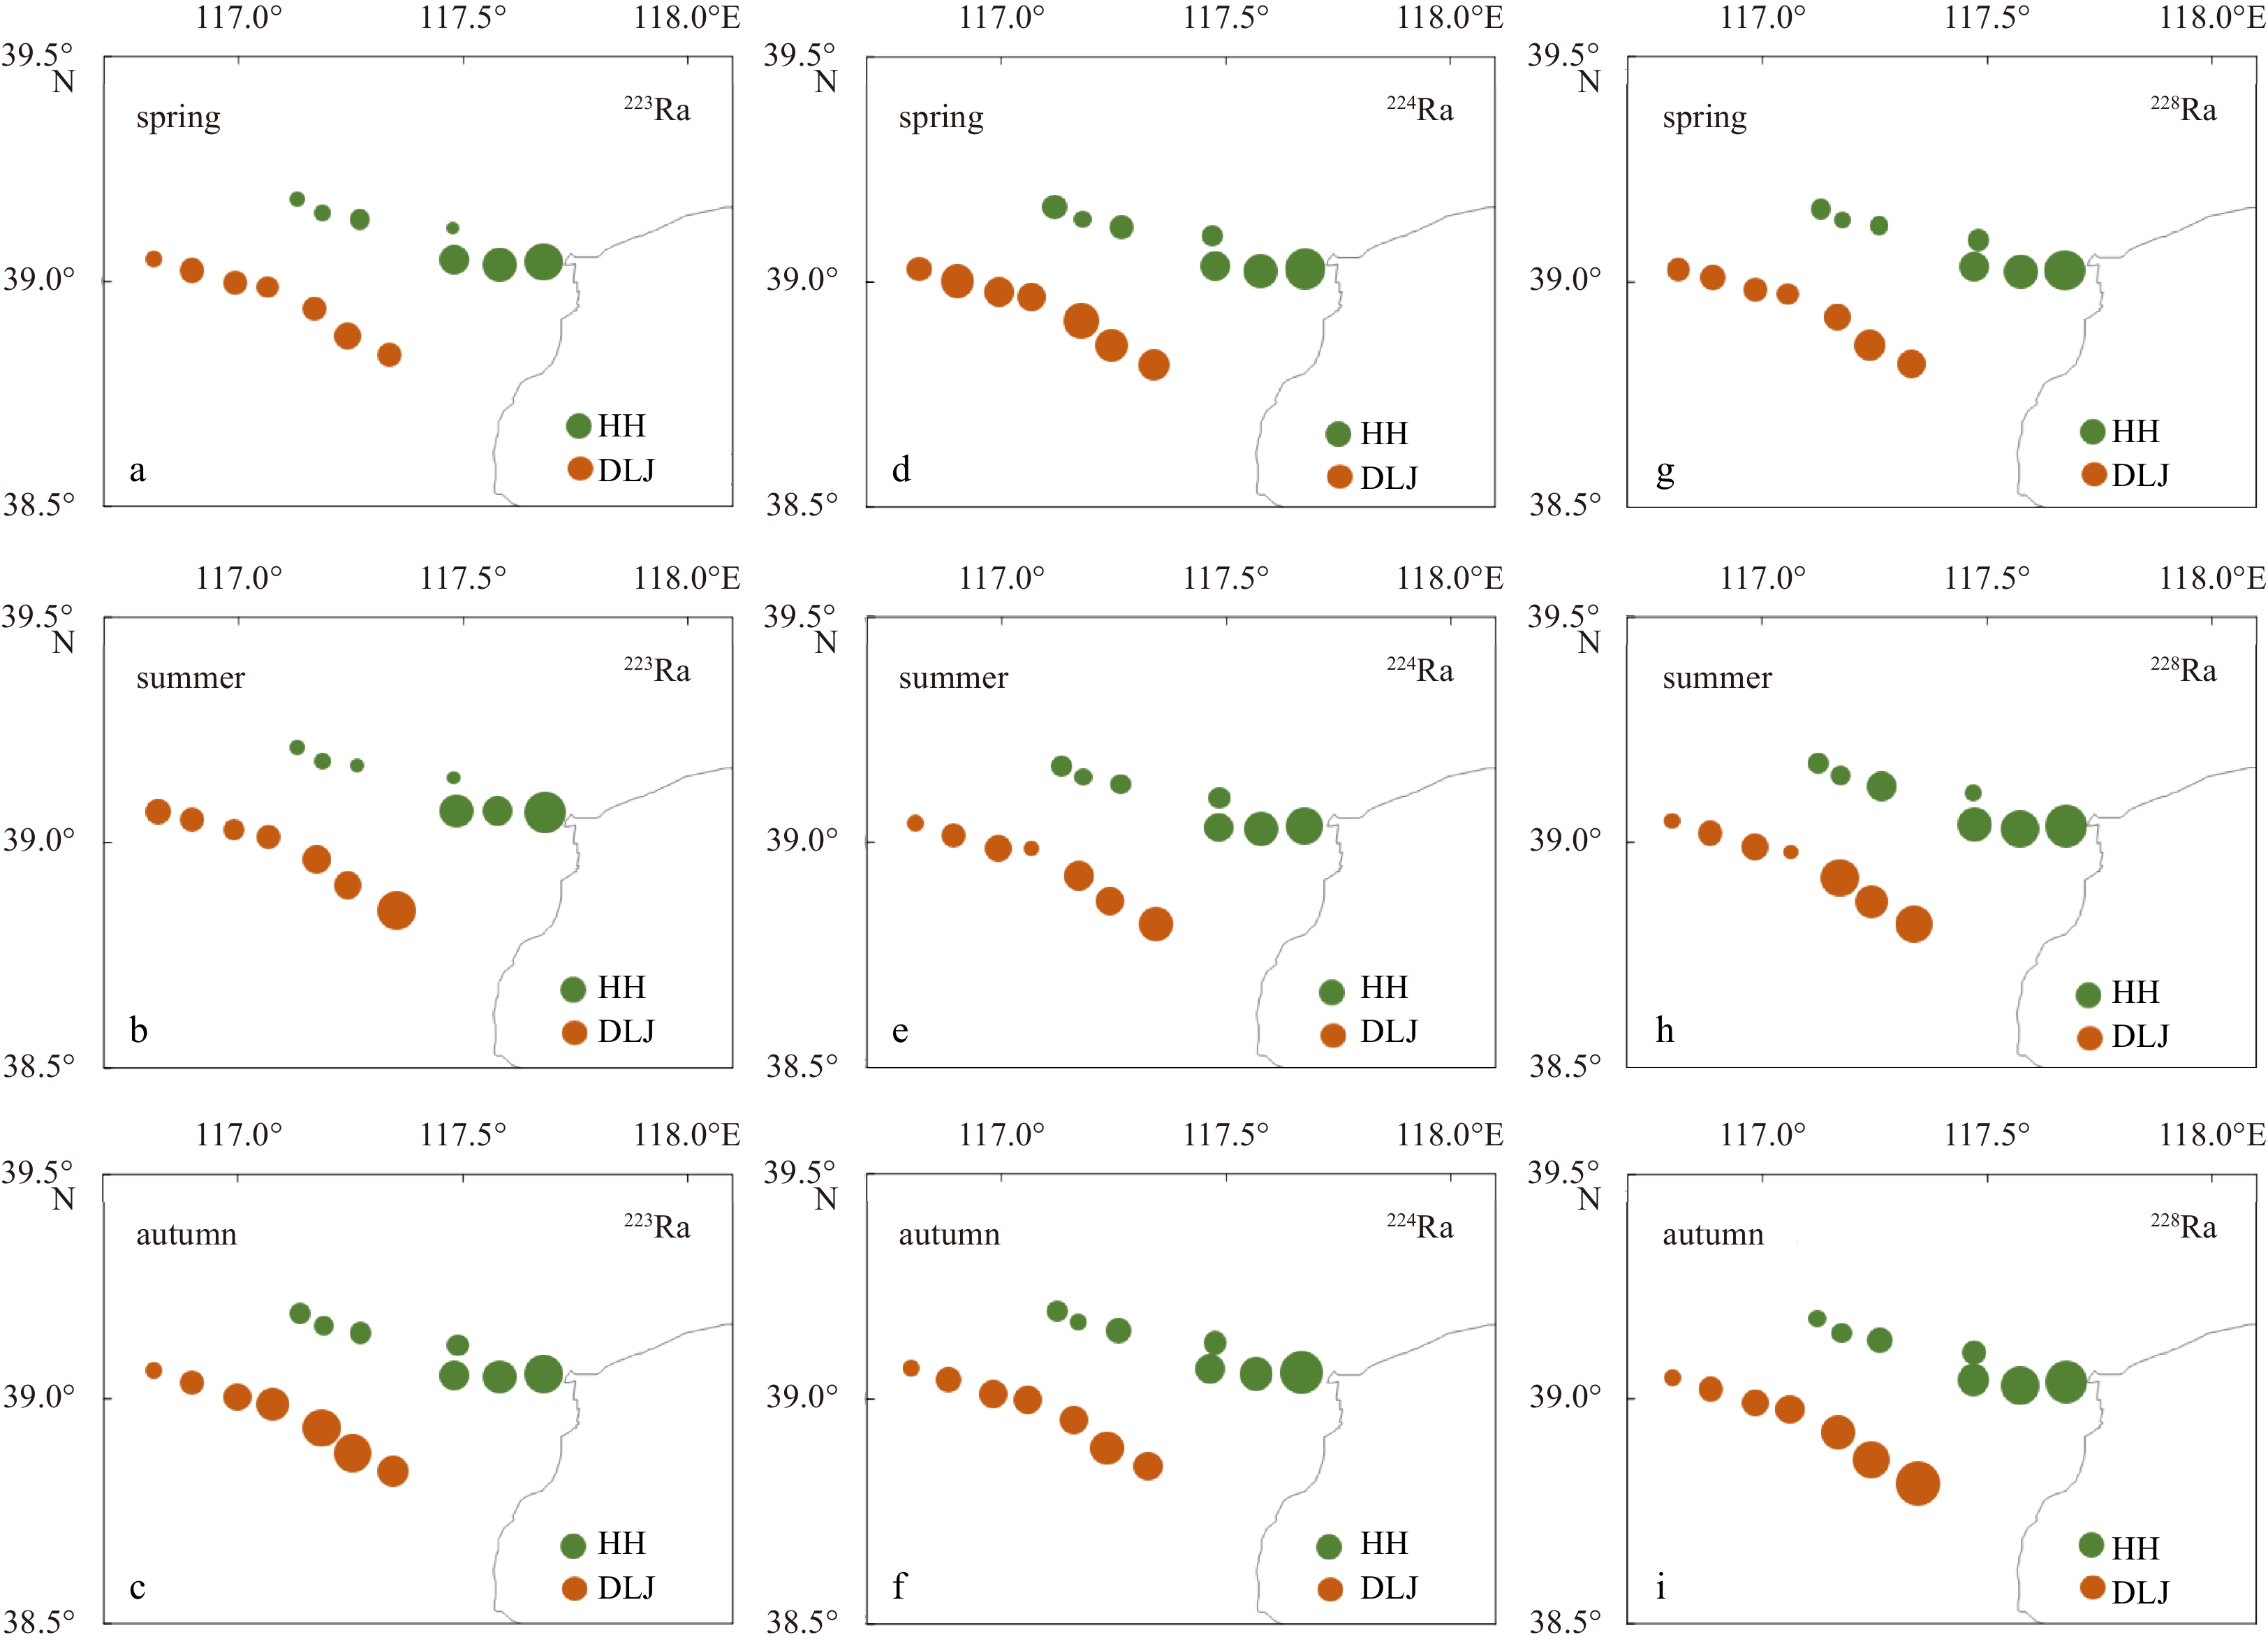
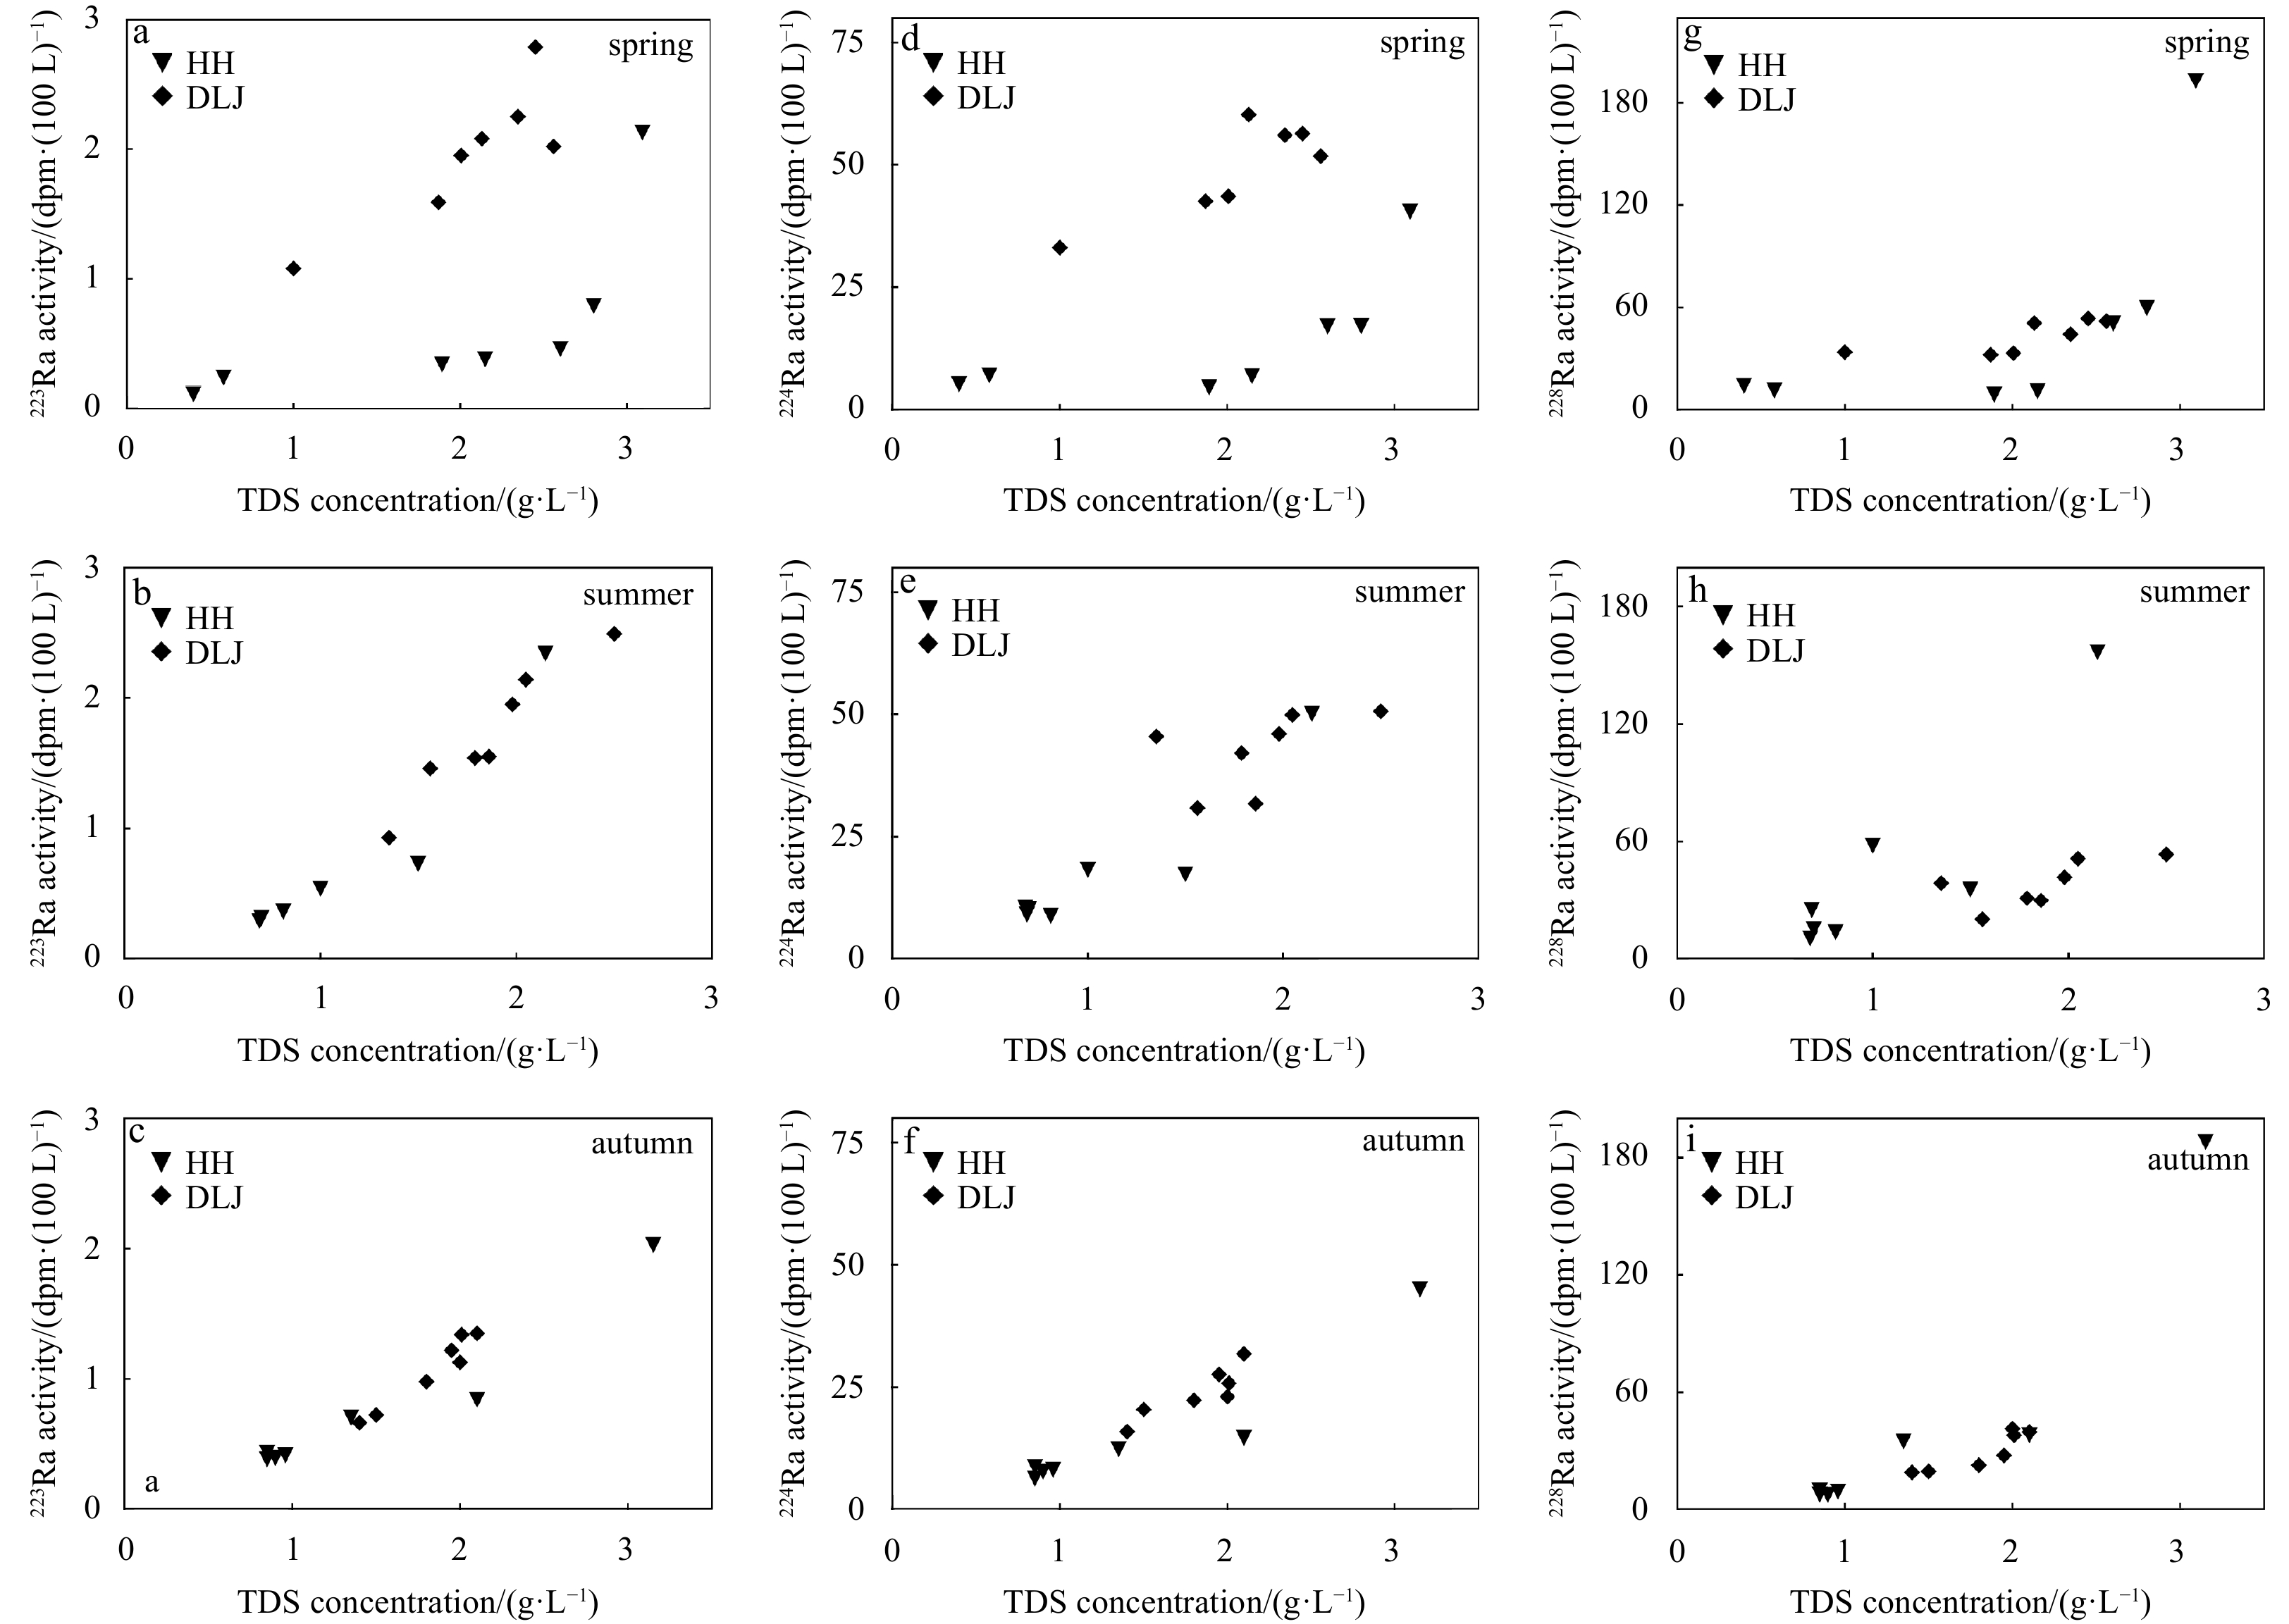
Figure 3. Horizontal distribution of 223Ra (a−c), 224Ra (d−f) and 228Ra (g−i) activities in surface water (HH: Haihe River; DLJ: Duliujian River).

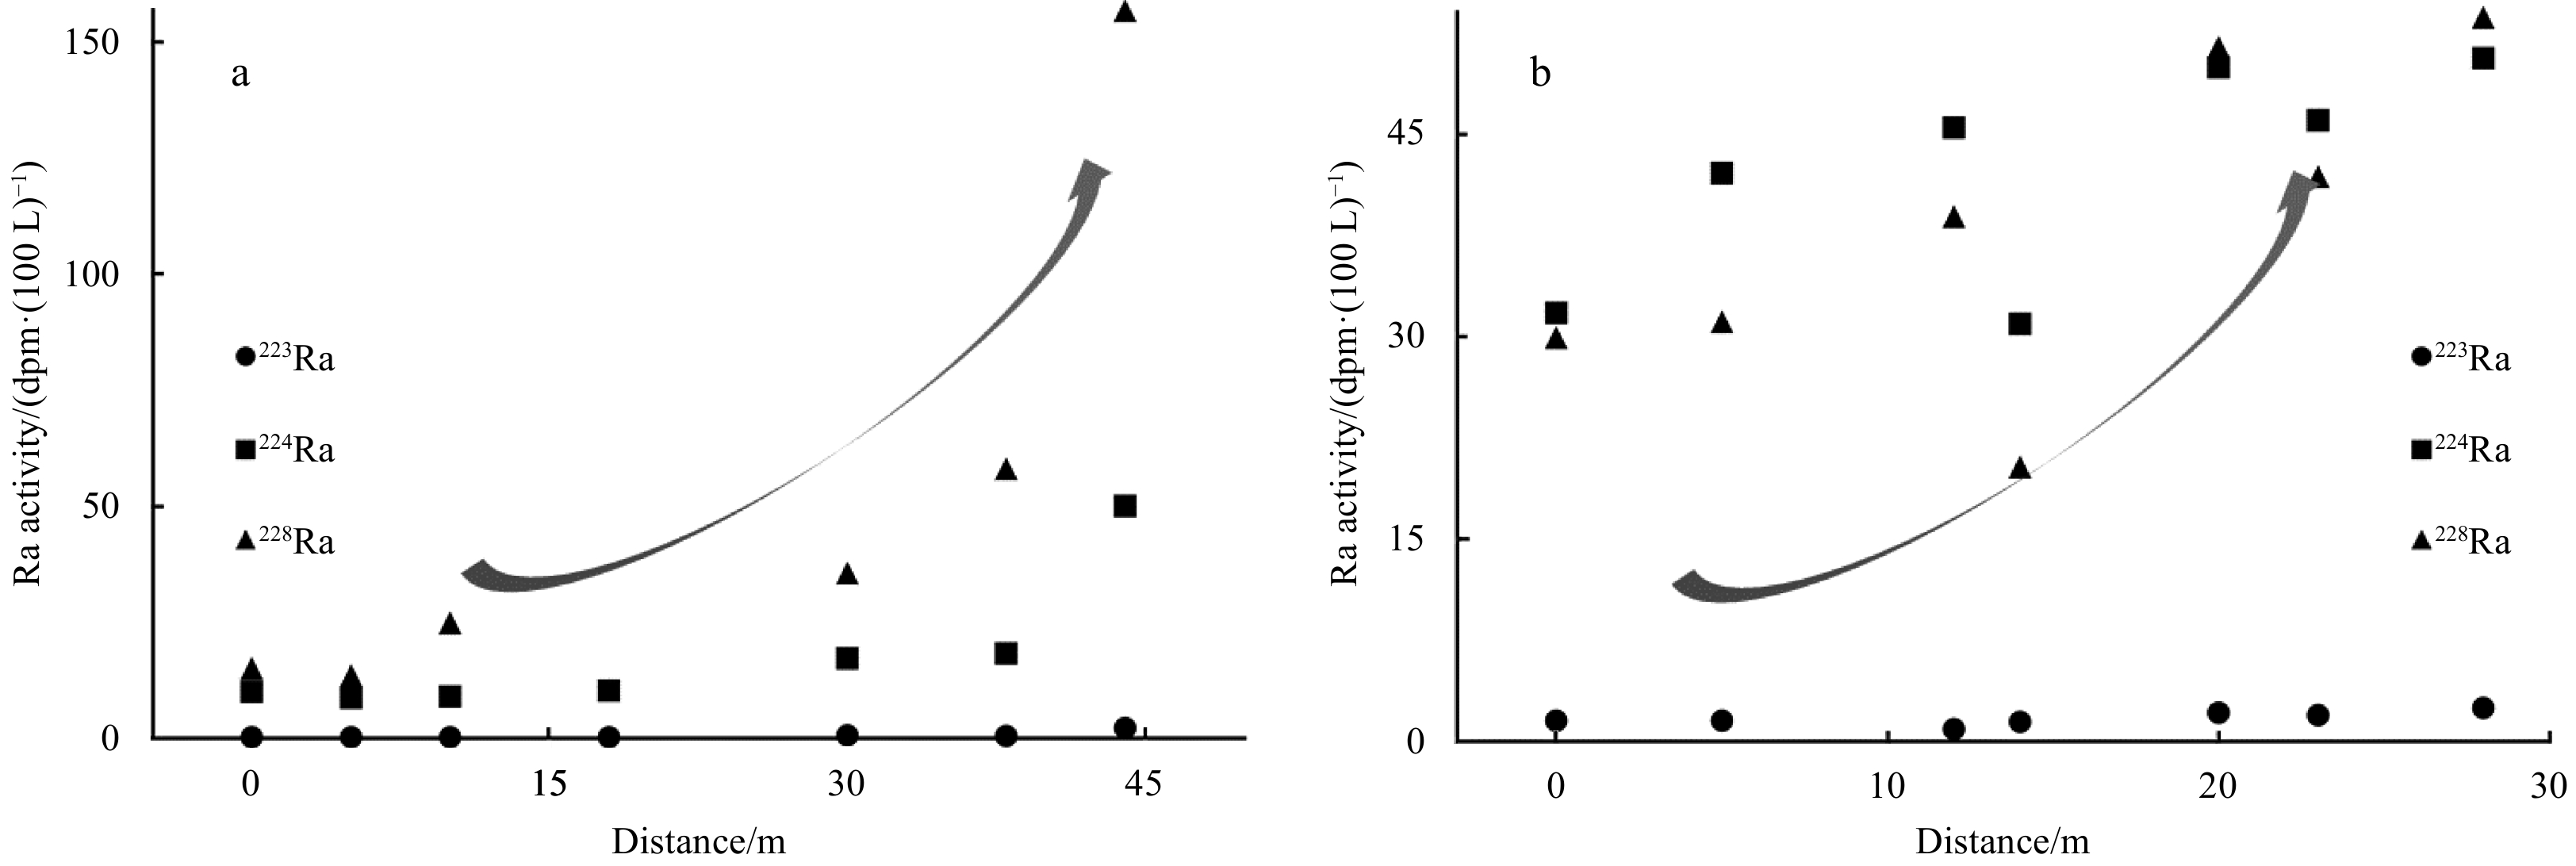
Figure 4. Activity of 223Ra, 224Ra and 228Ra in surface water (Haihe River (a) and Duliujian River (b)) at each station.

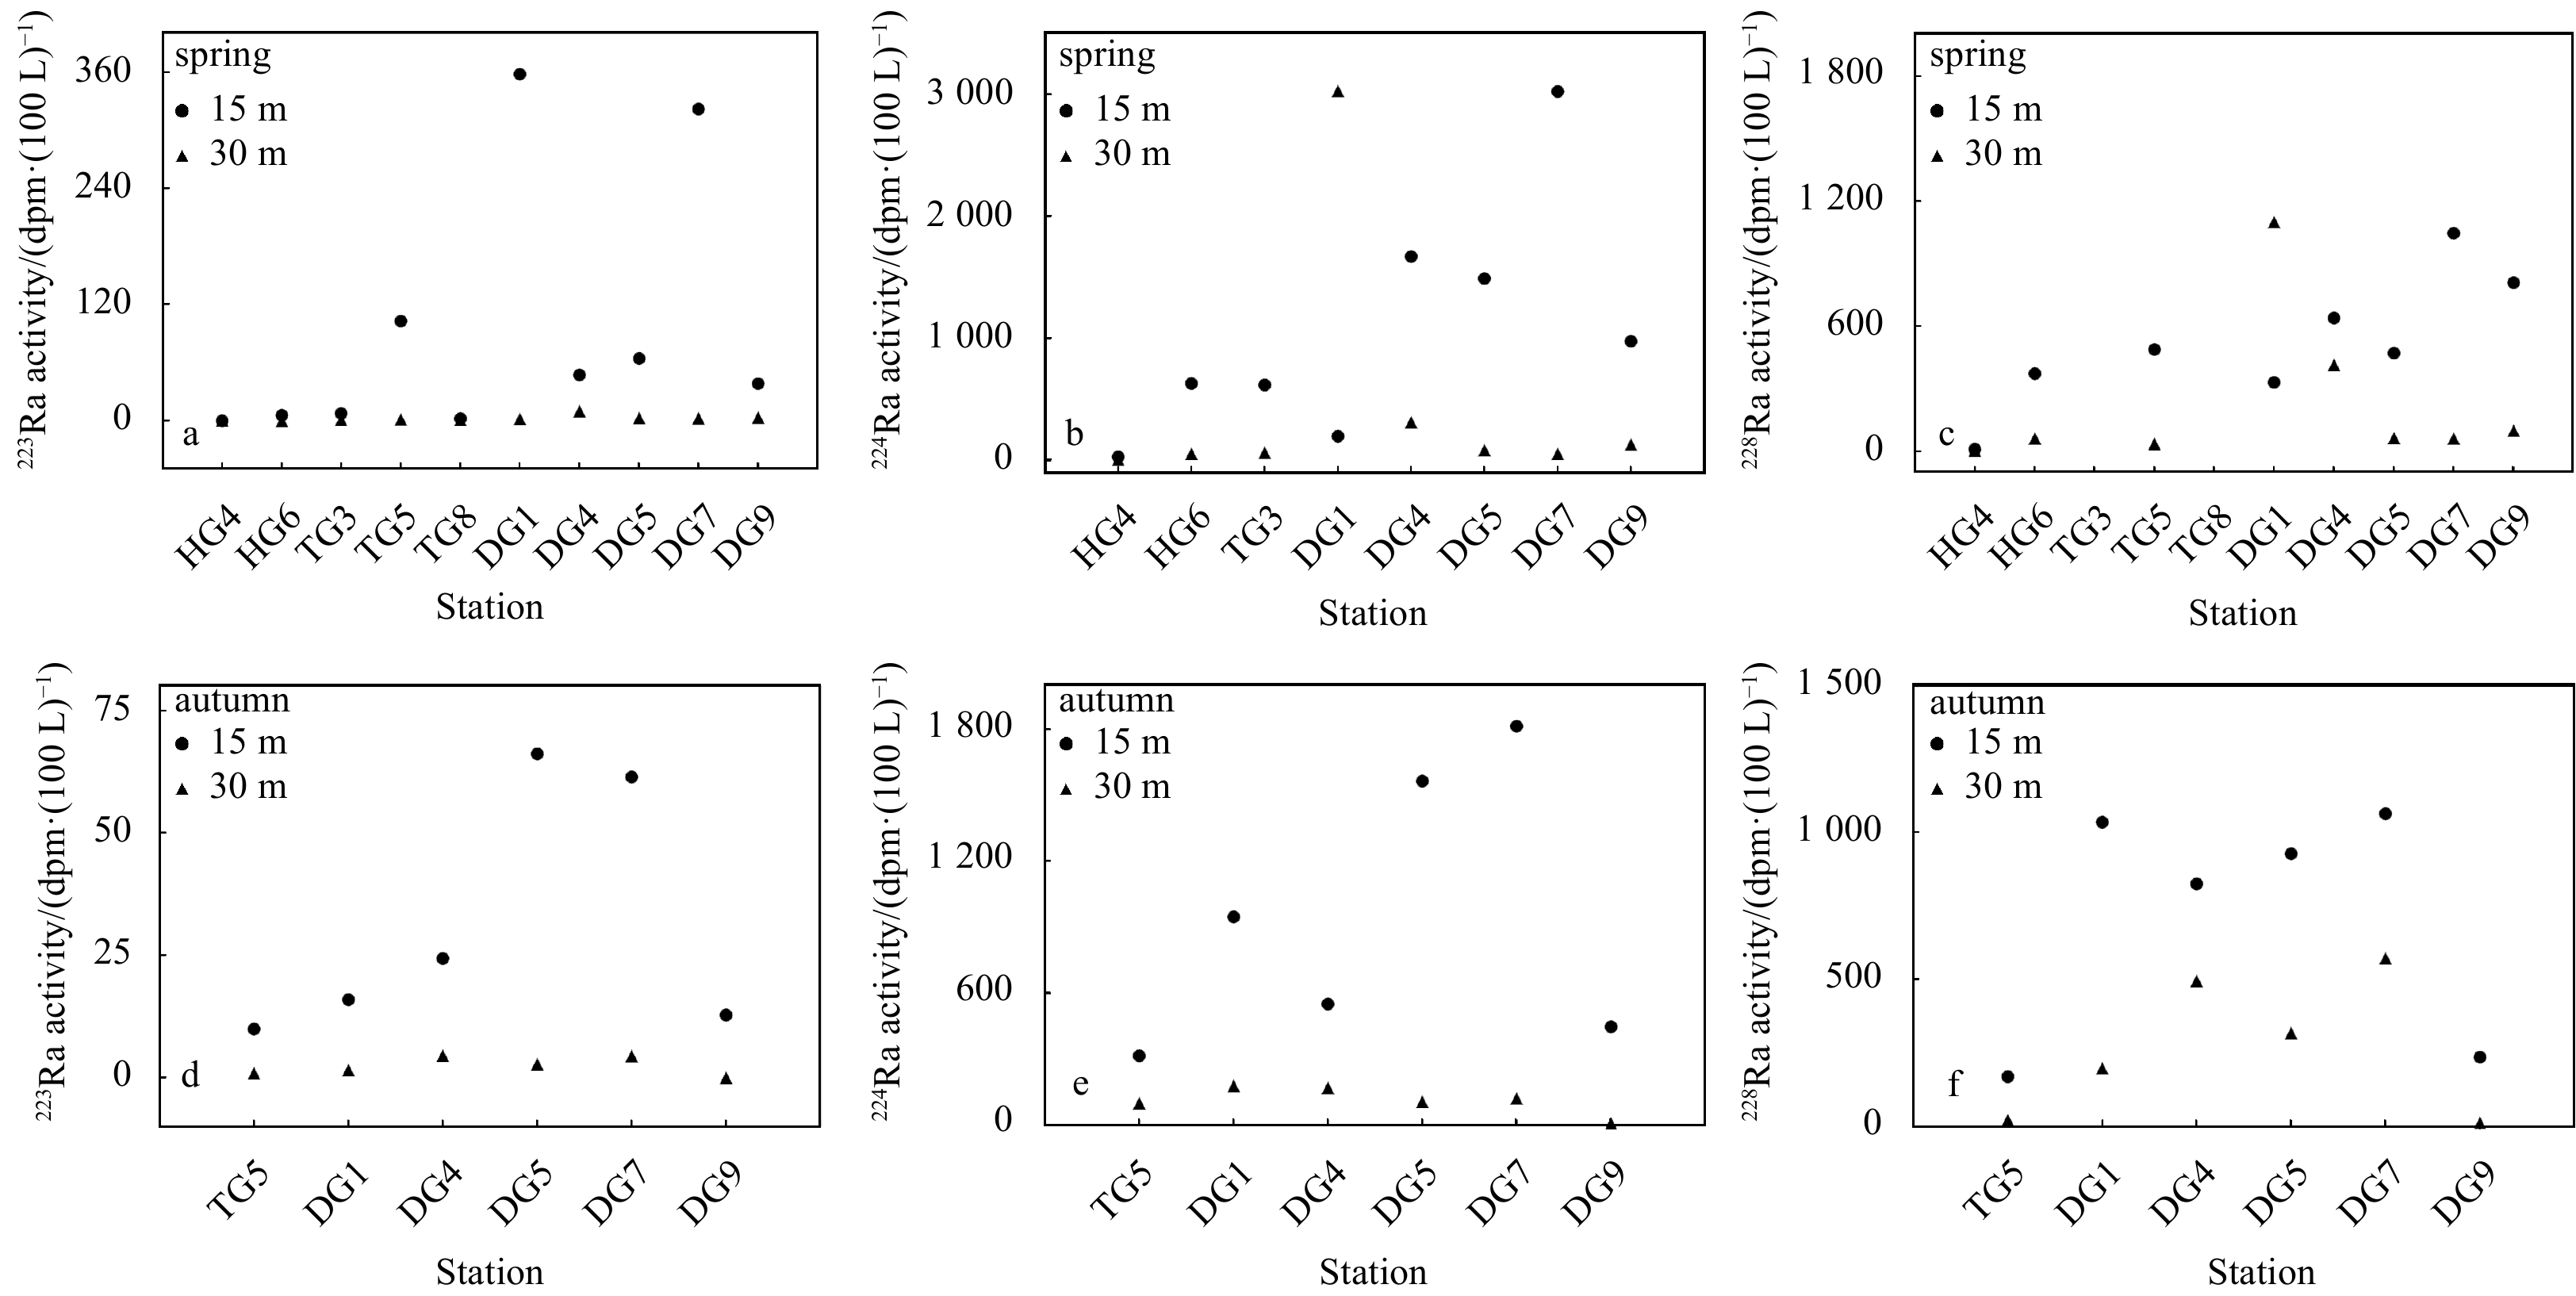
Figure 5. Groundwater vertical distribution of 223Ra, 224Ra and 228Ra activities in spring (a−c) and autumn (d−f).
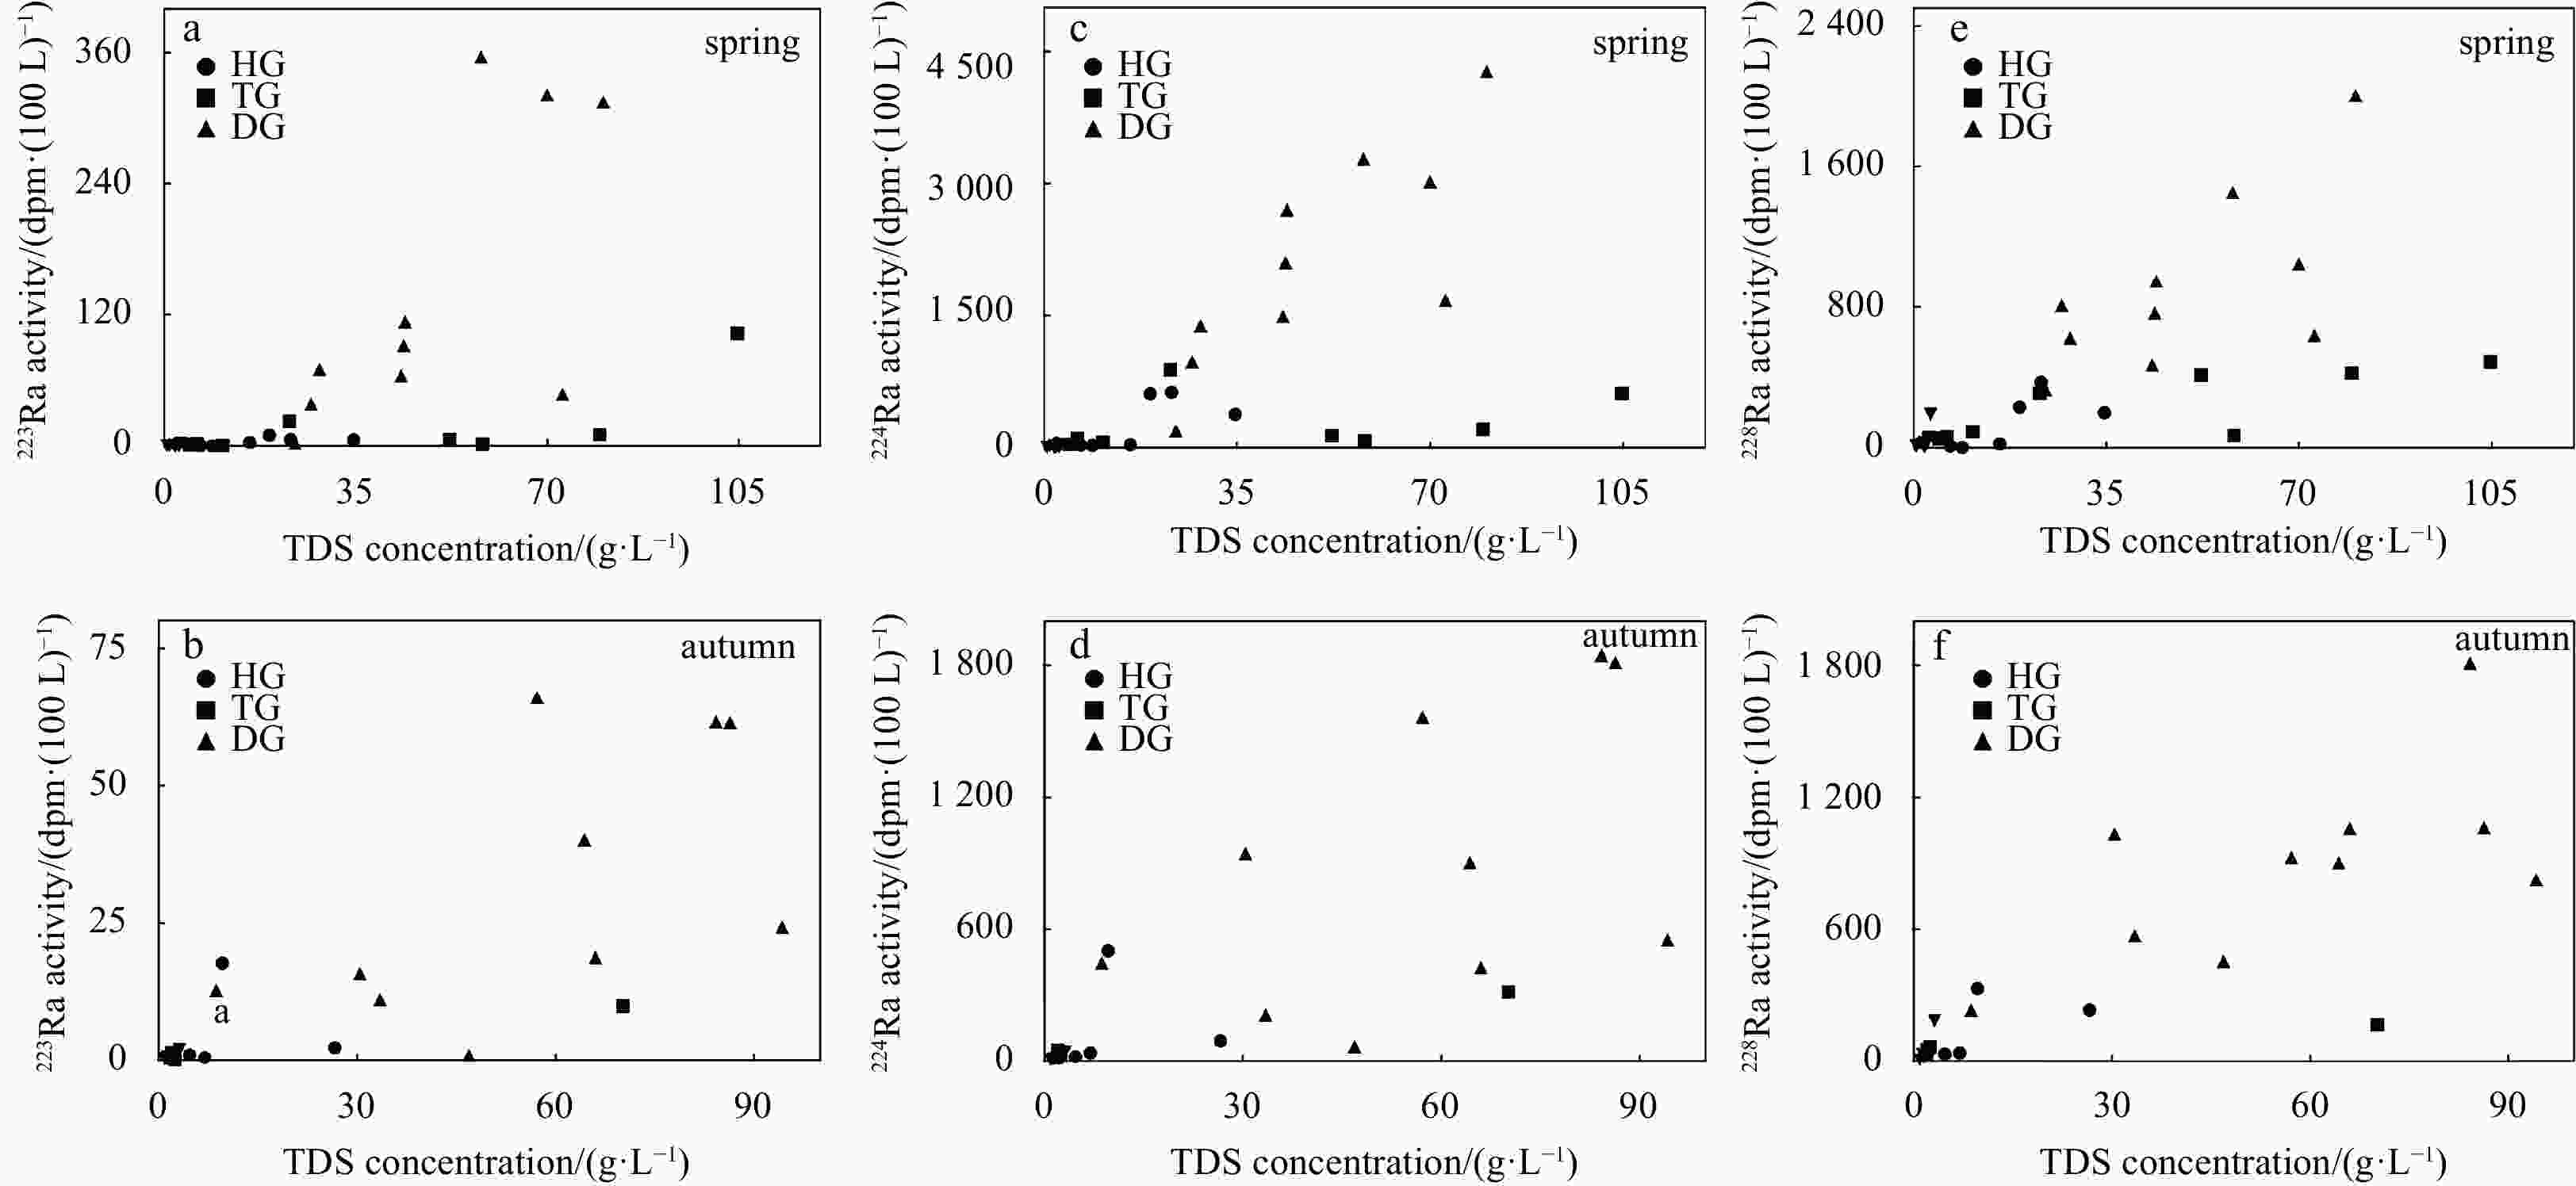
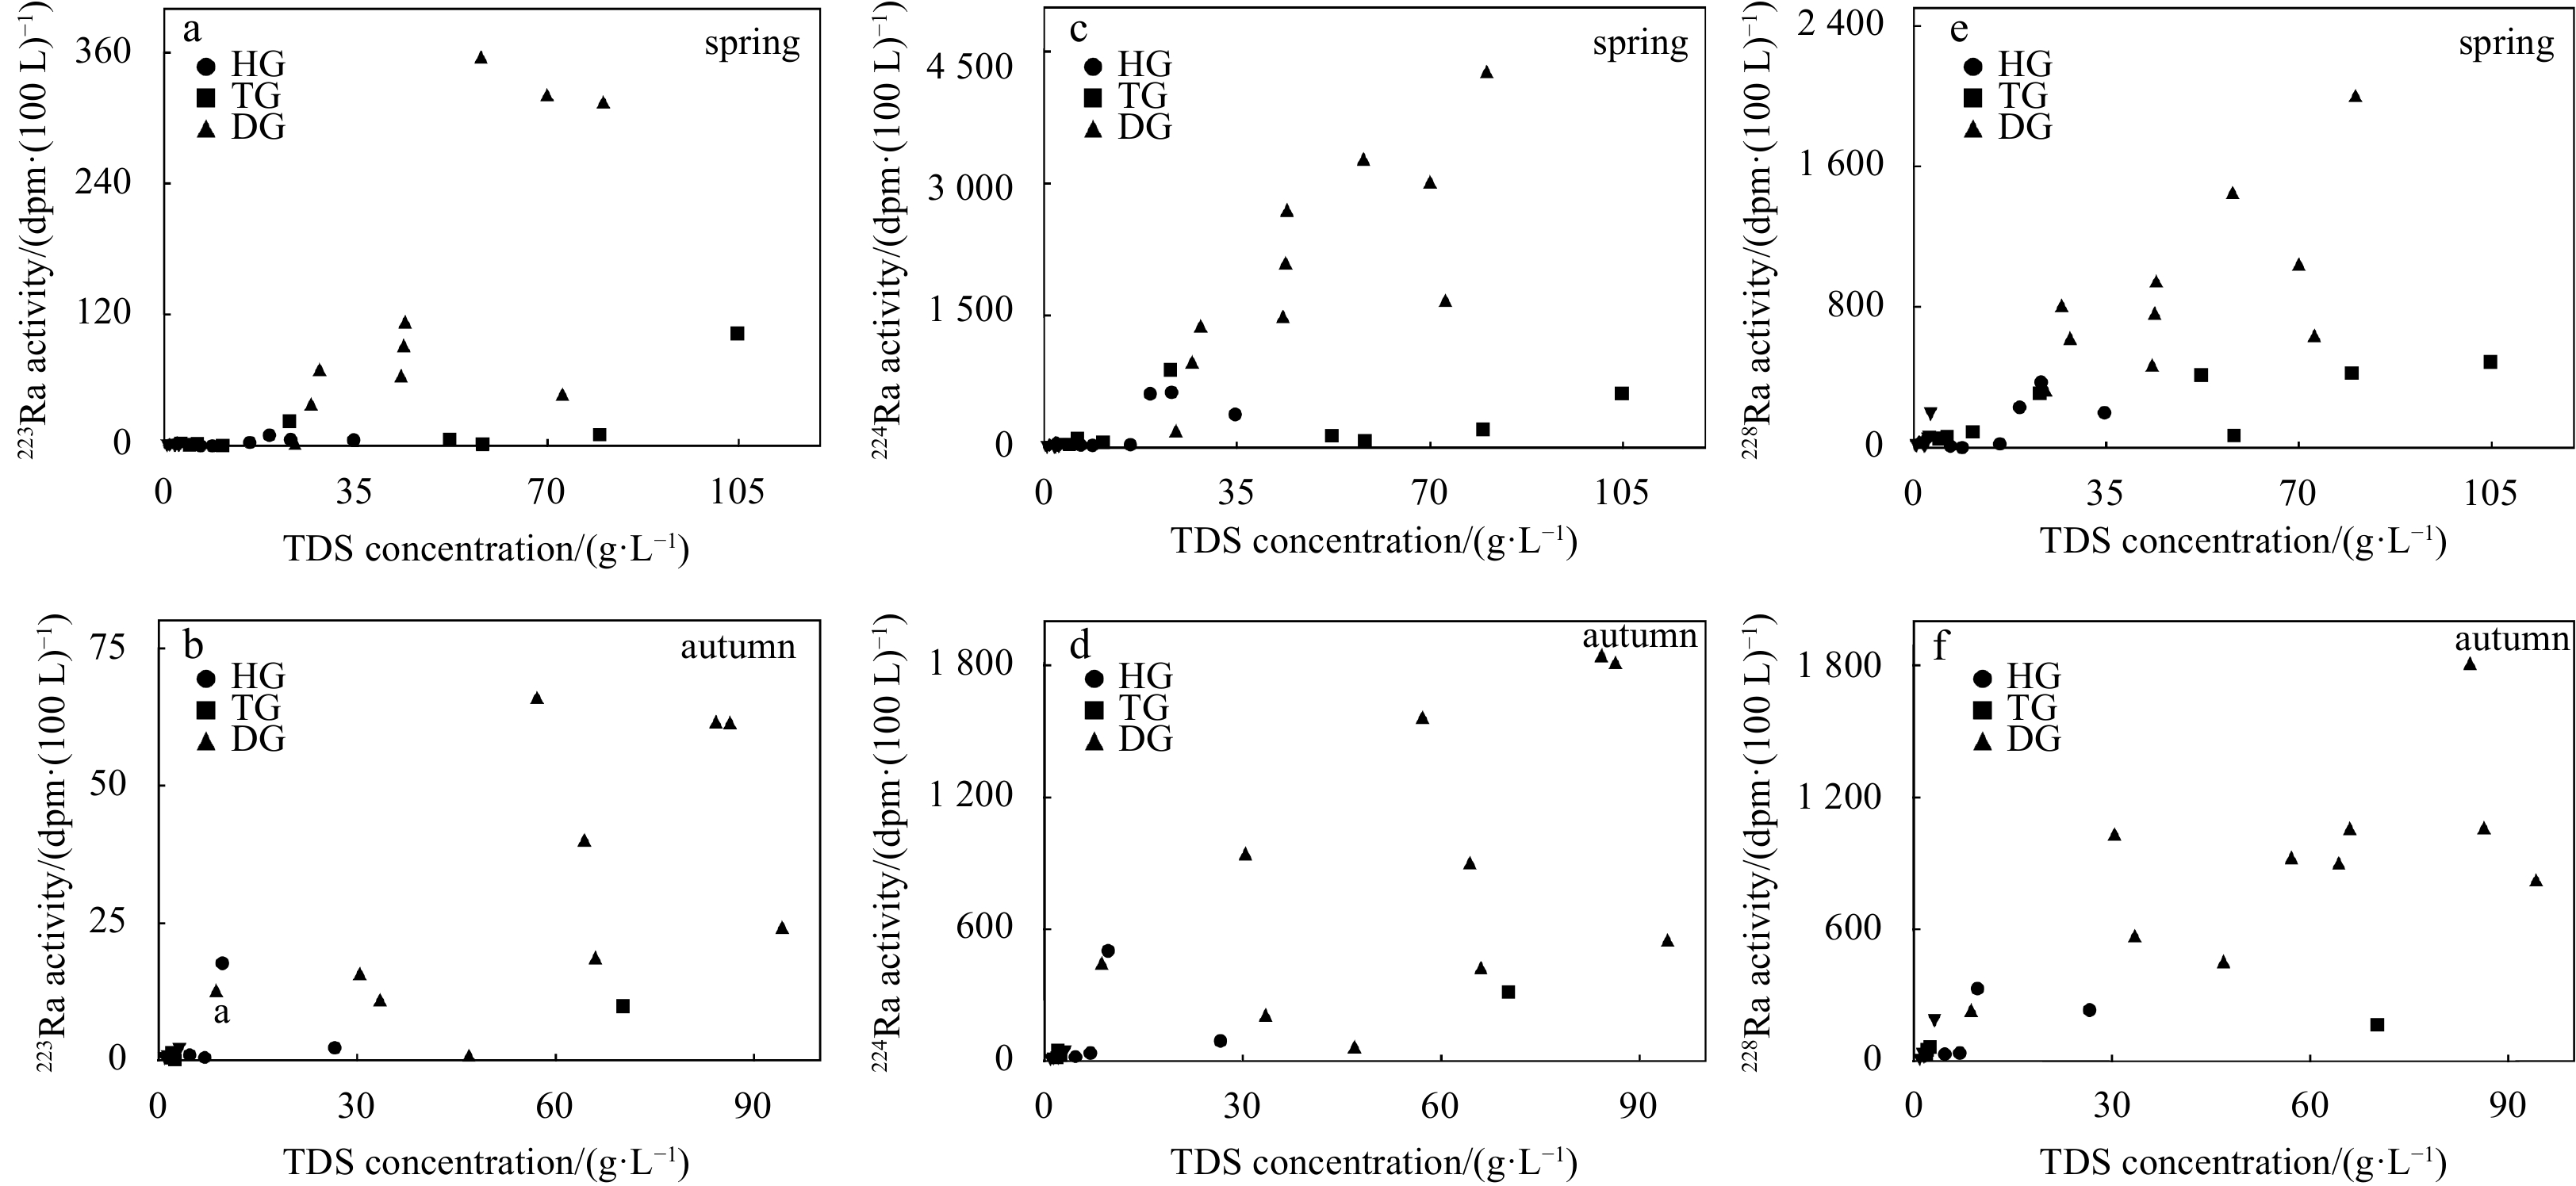
Figure 6. Different kinds of plots depicting 223Ra (a, b), 224Ra (c, d) and 228Ra (e, f) activities of groundwater (HG: Hangu; TG: Tanggu; DG: Dagang) in relationship with total dissolved solid (TDS) in spring and autumn.
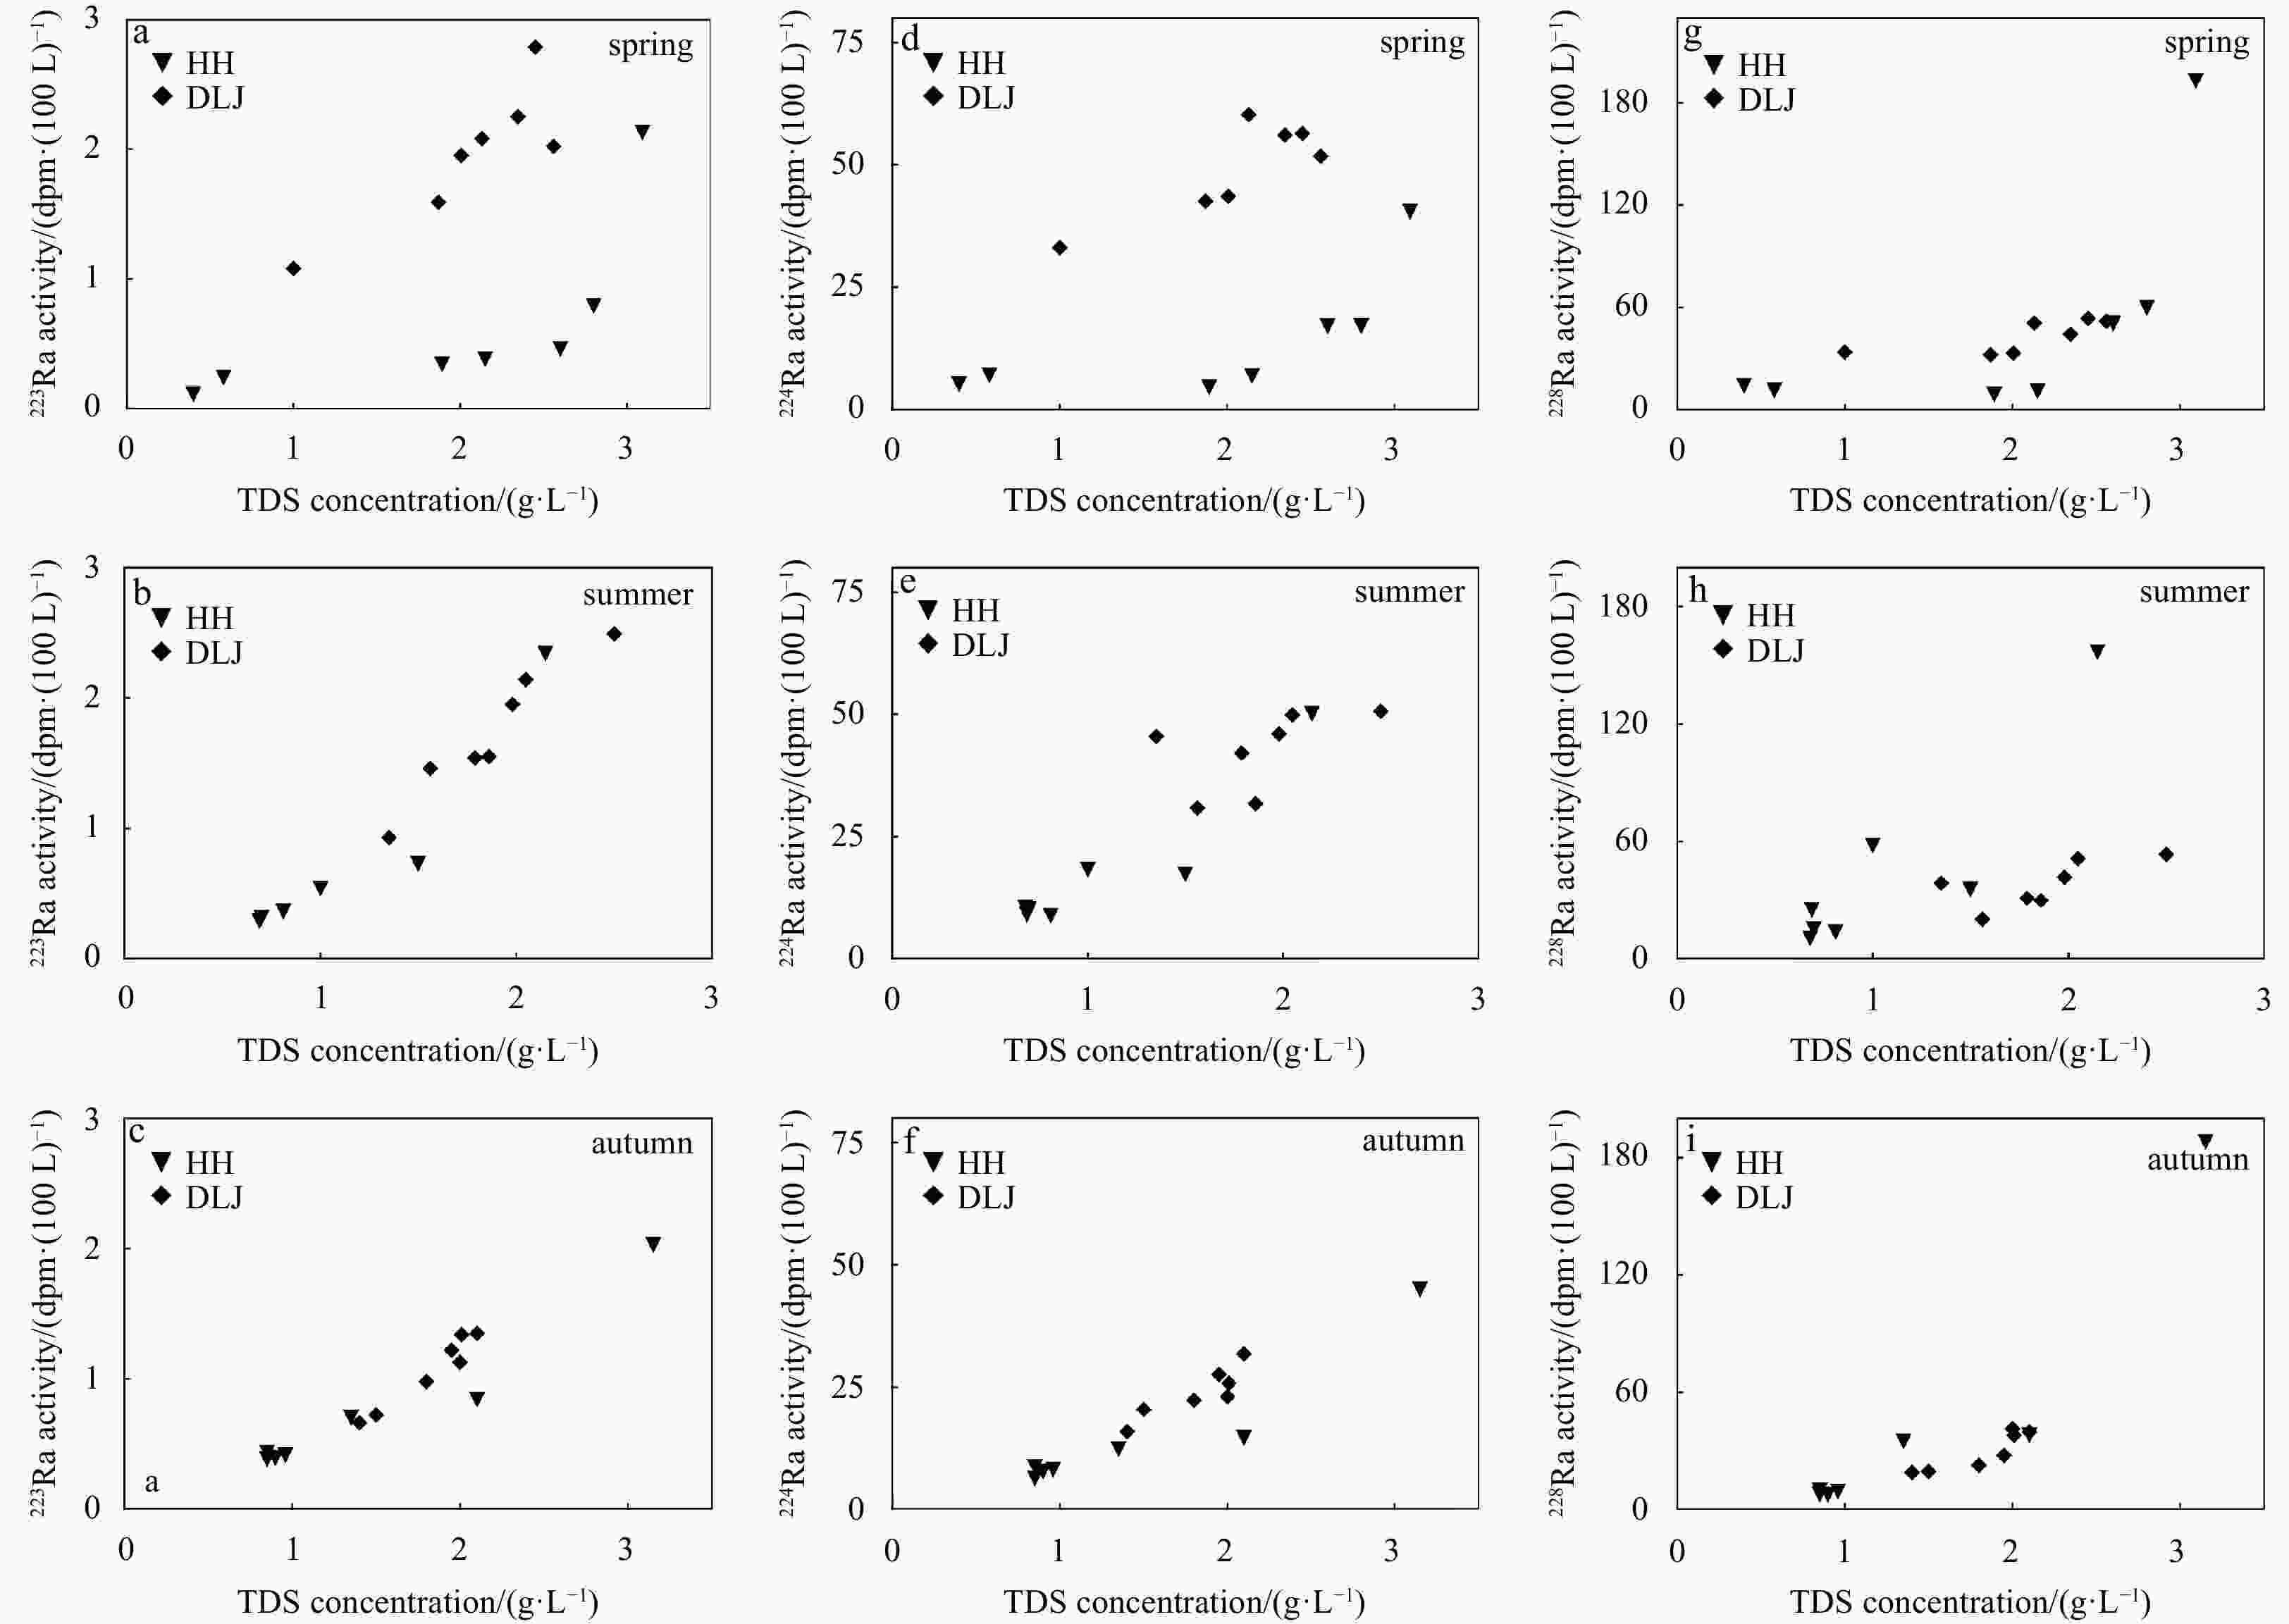
Figure 7. Different kinds of plots depicting 223Ra (a−c), 224Ra (d−f) and 228Ra (g−i) activities of surface water (HH: Haihe River; DLJ: Duliujian River) in relationship with total dissolved solid (TDS) in spring, summer and autumn.
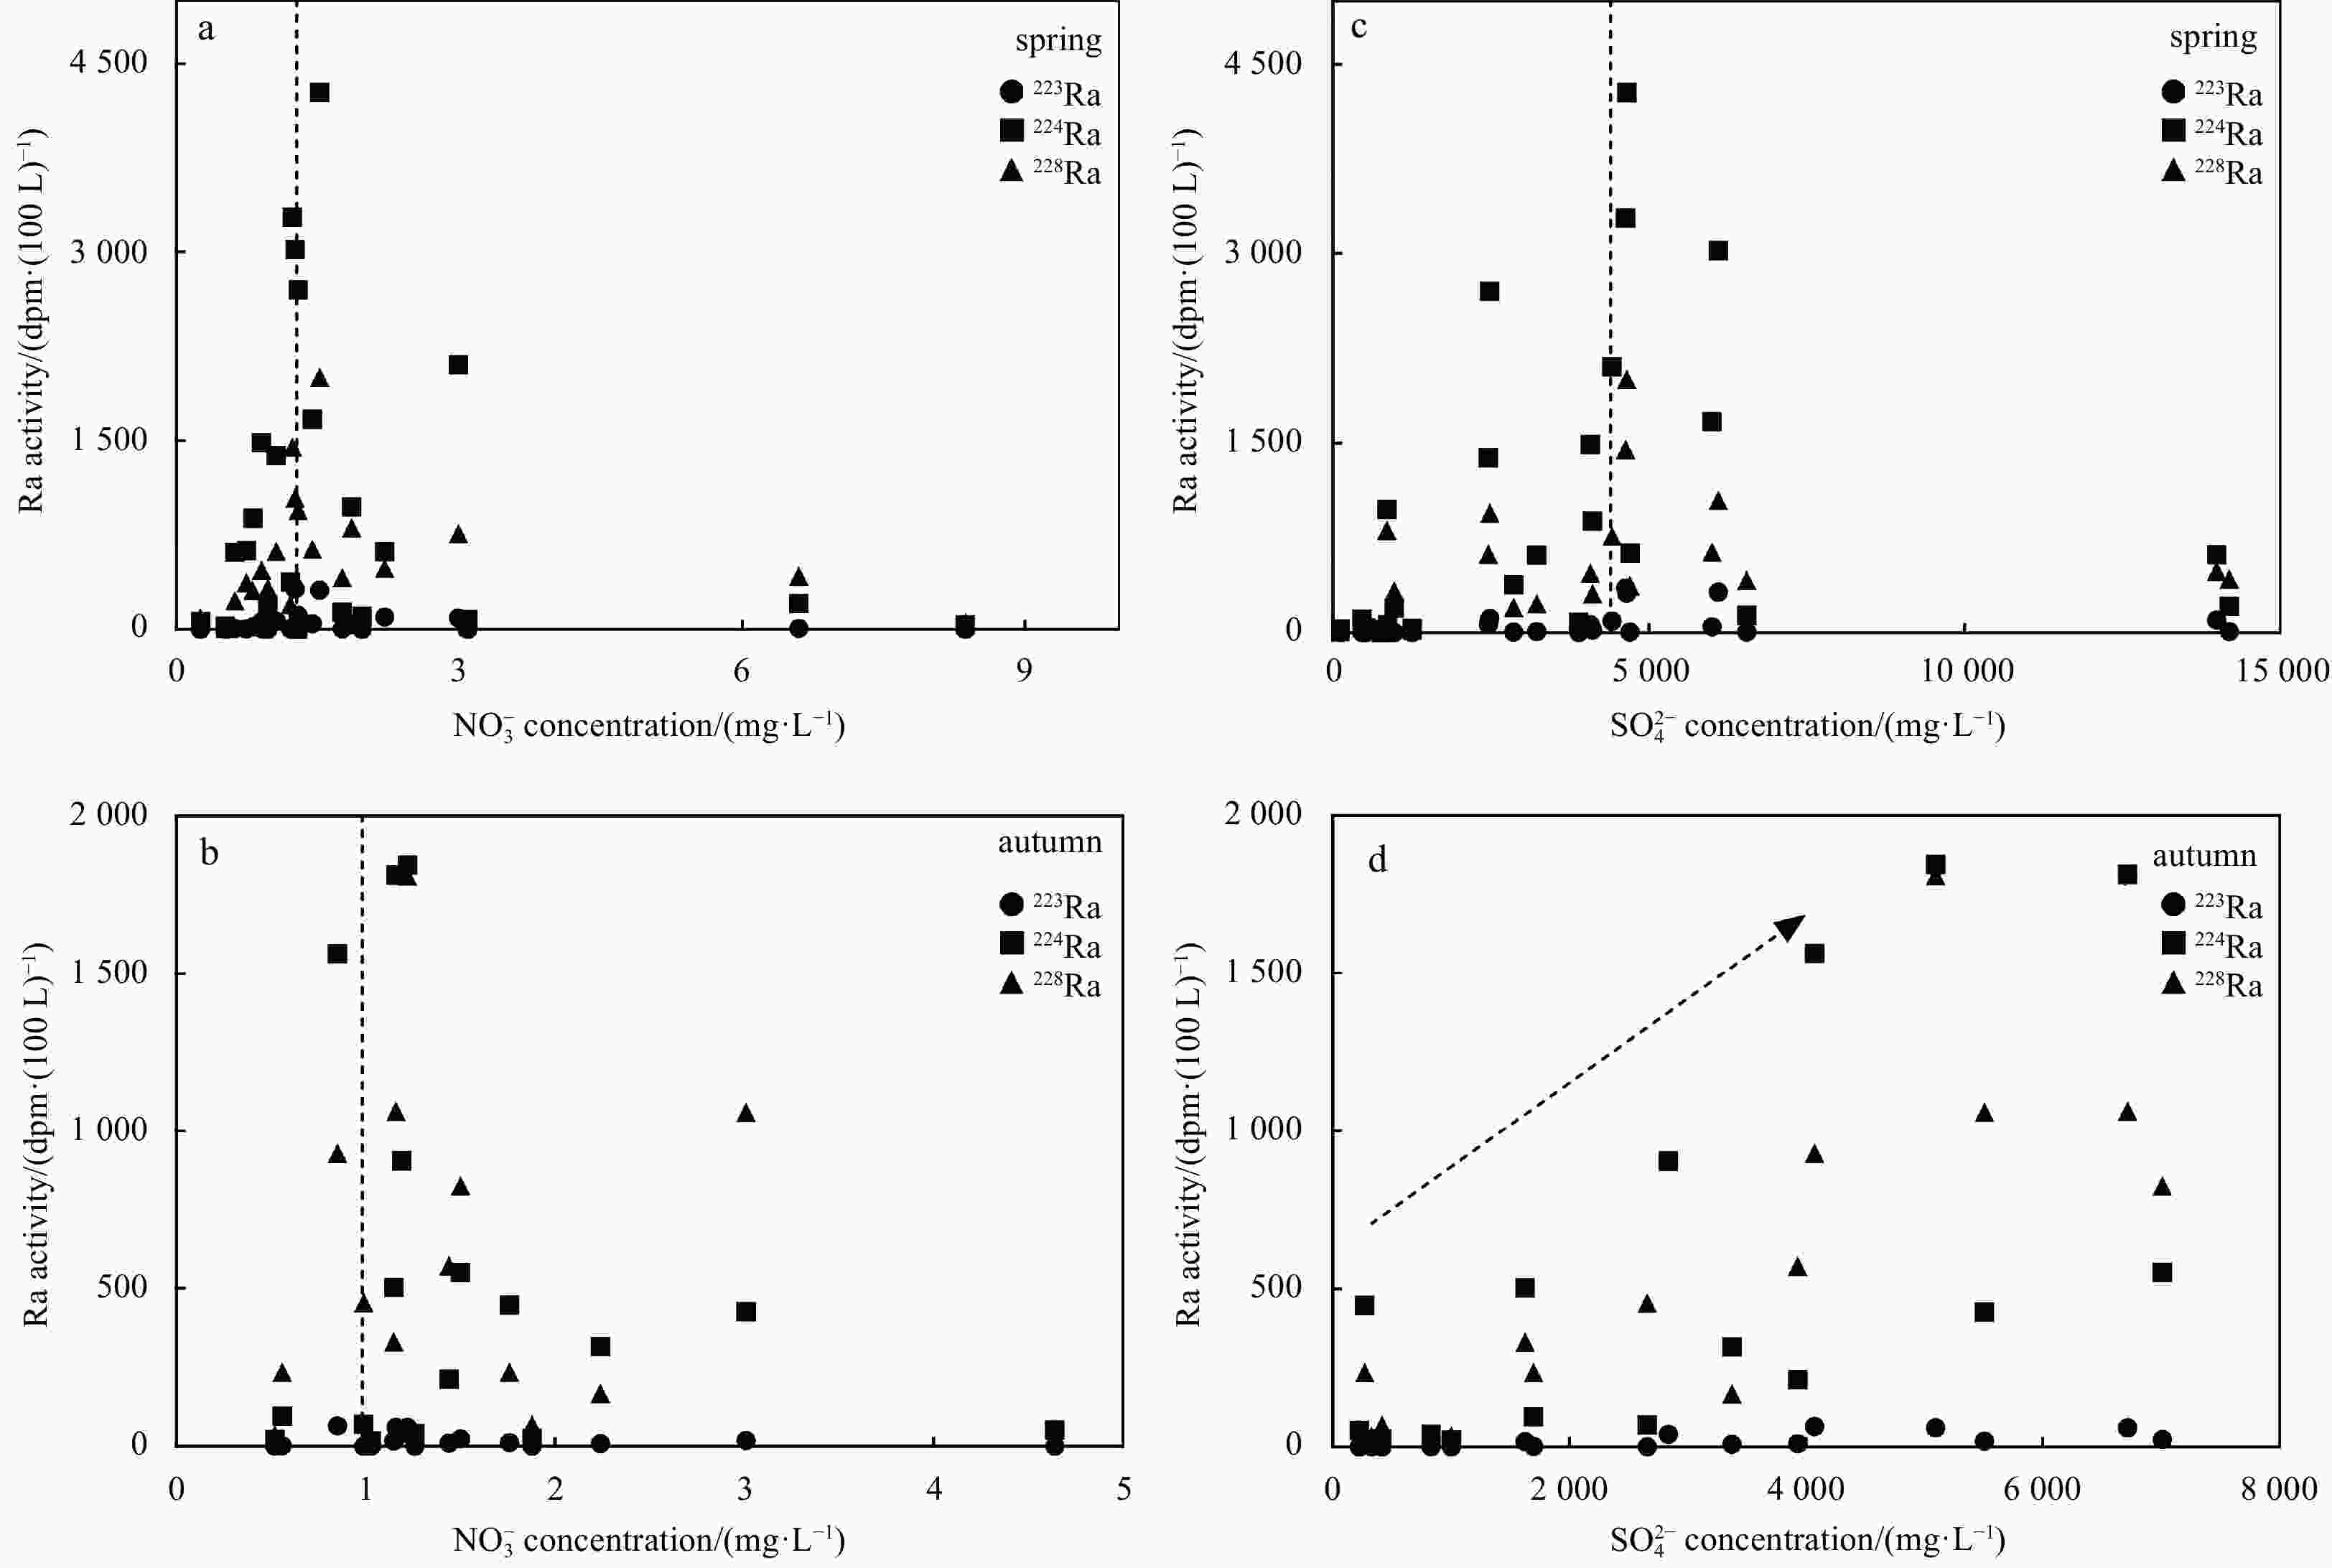
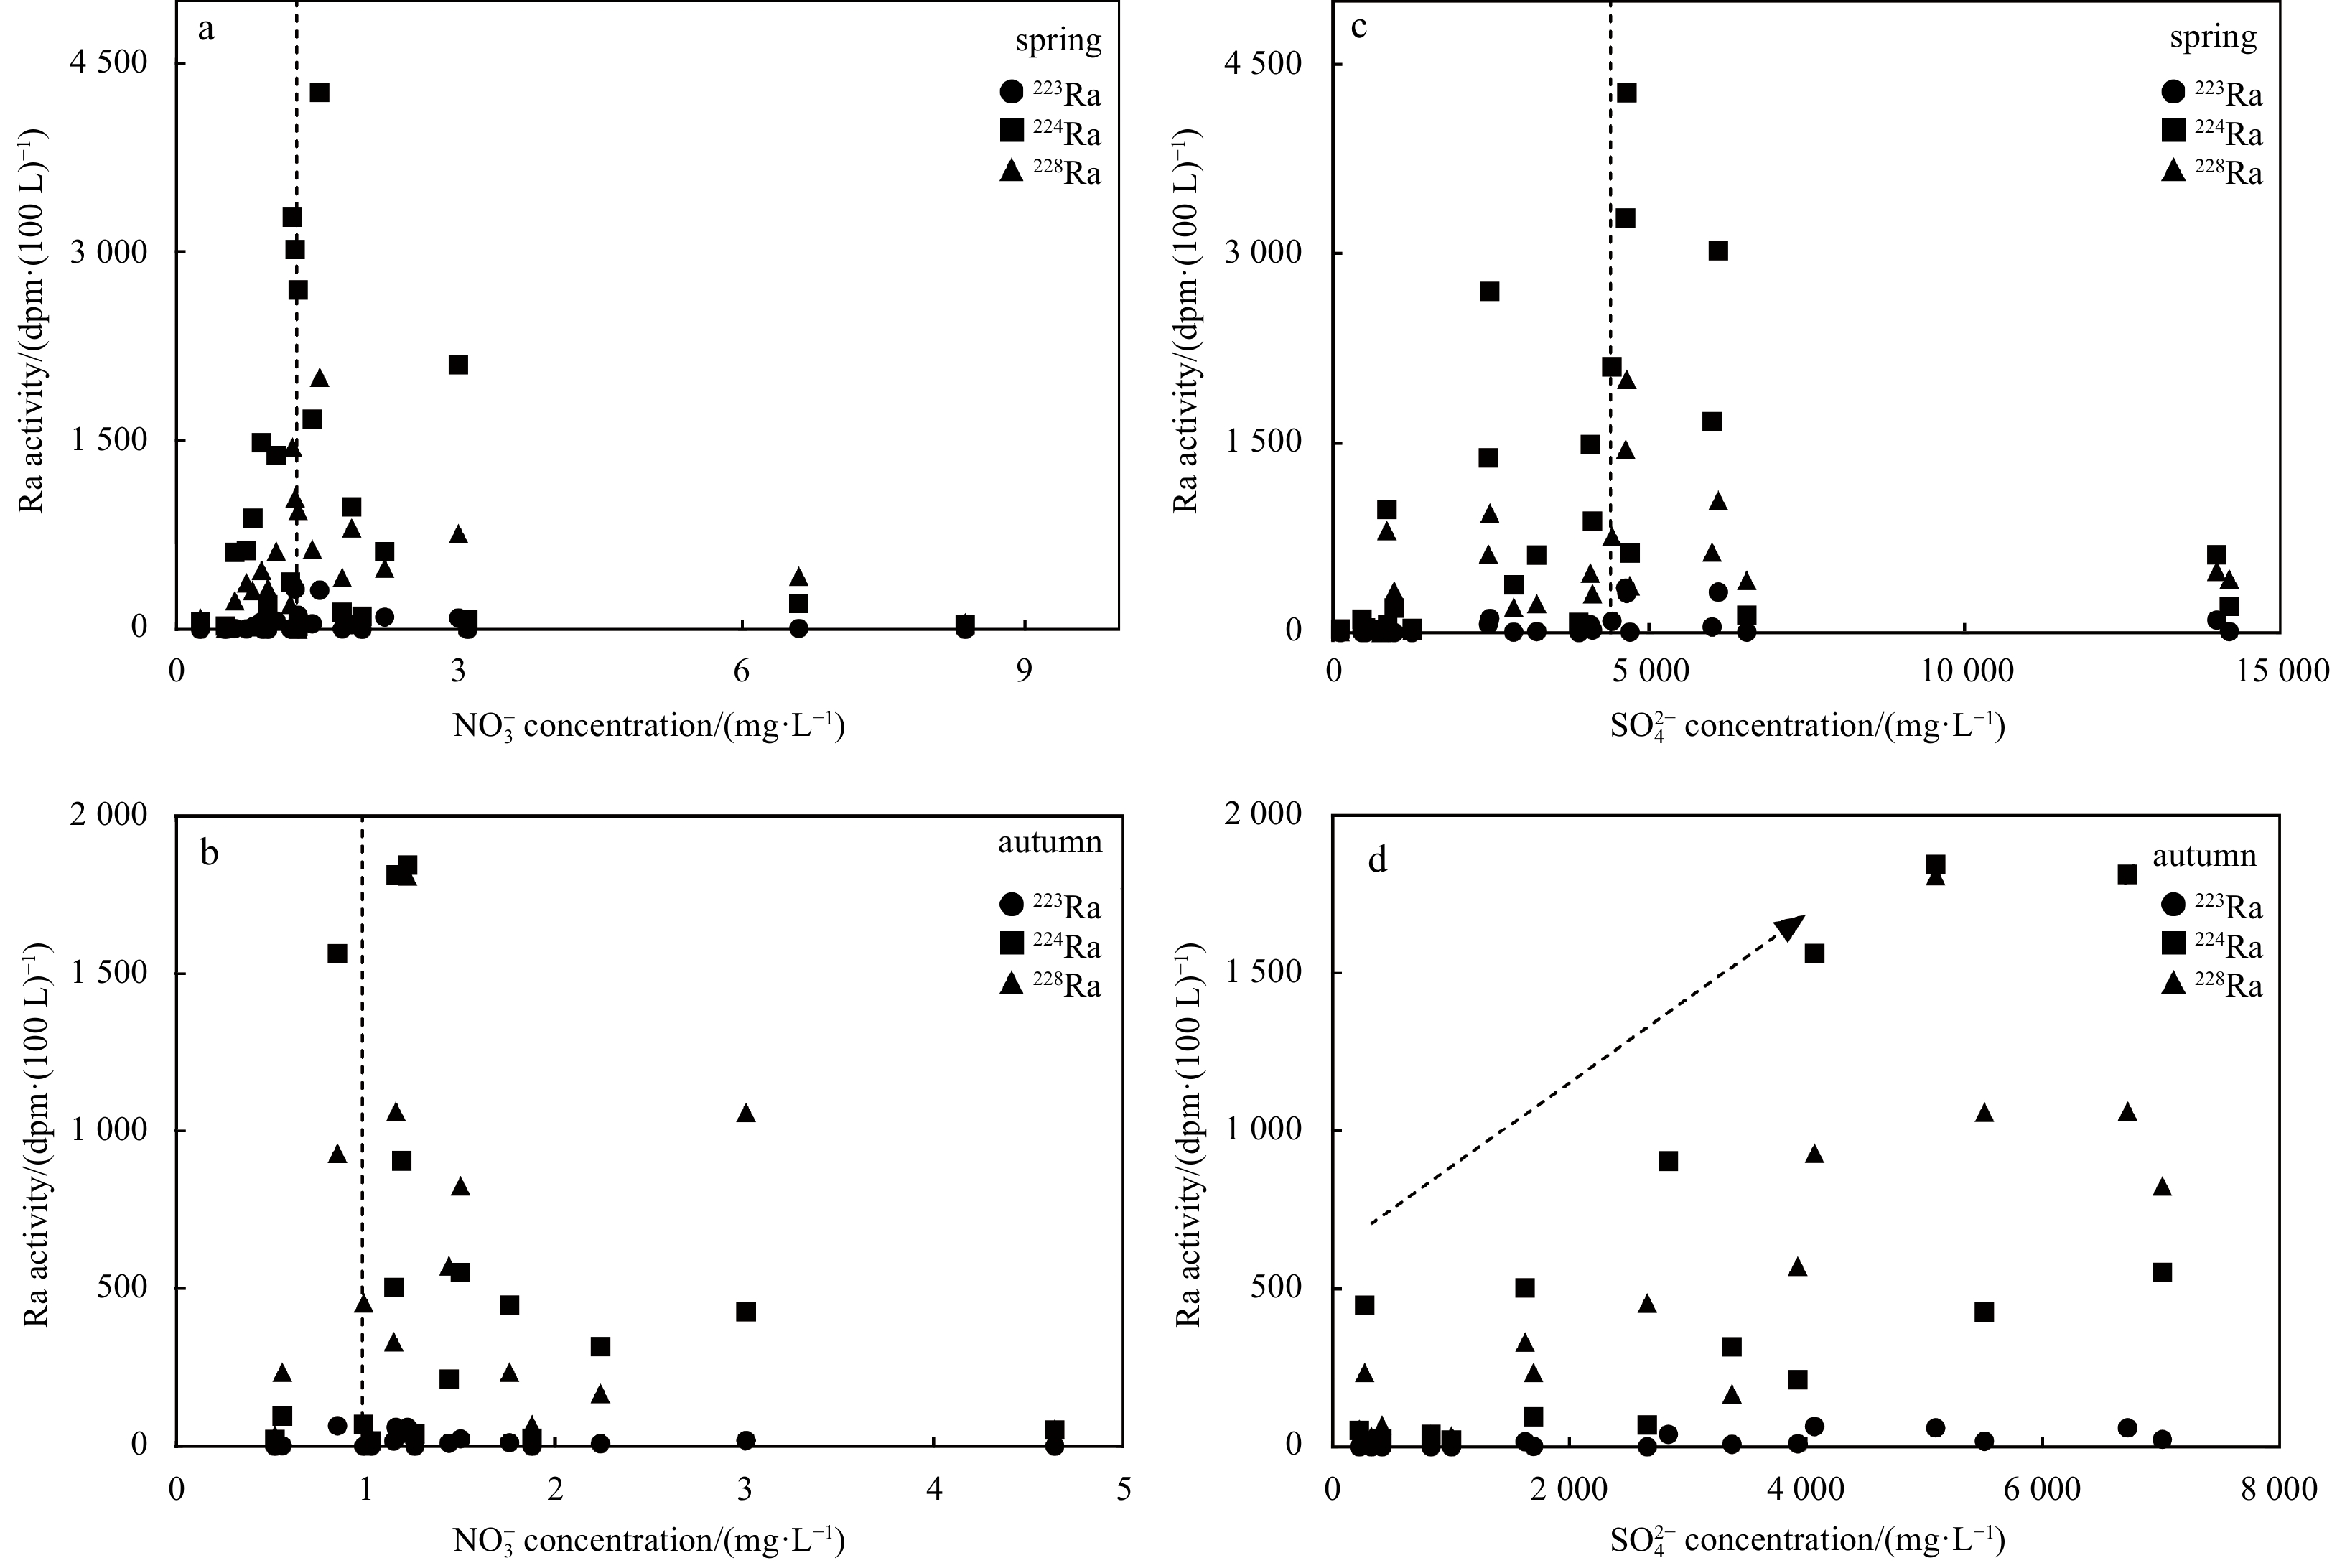
Figure 8. Different kinds of plots depicting 223Ra, 224Ra and 228Ra activities in relationship with
${{\rm {NO}}_3^{-}} $ (a, b) and${{\rm {SO}}_4^{2-}} $ (c, d) in spring and autumn.
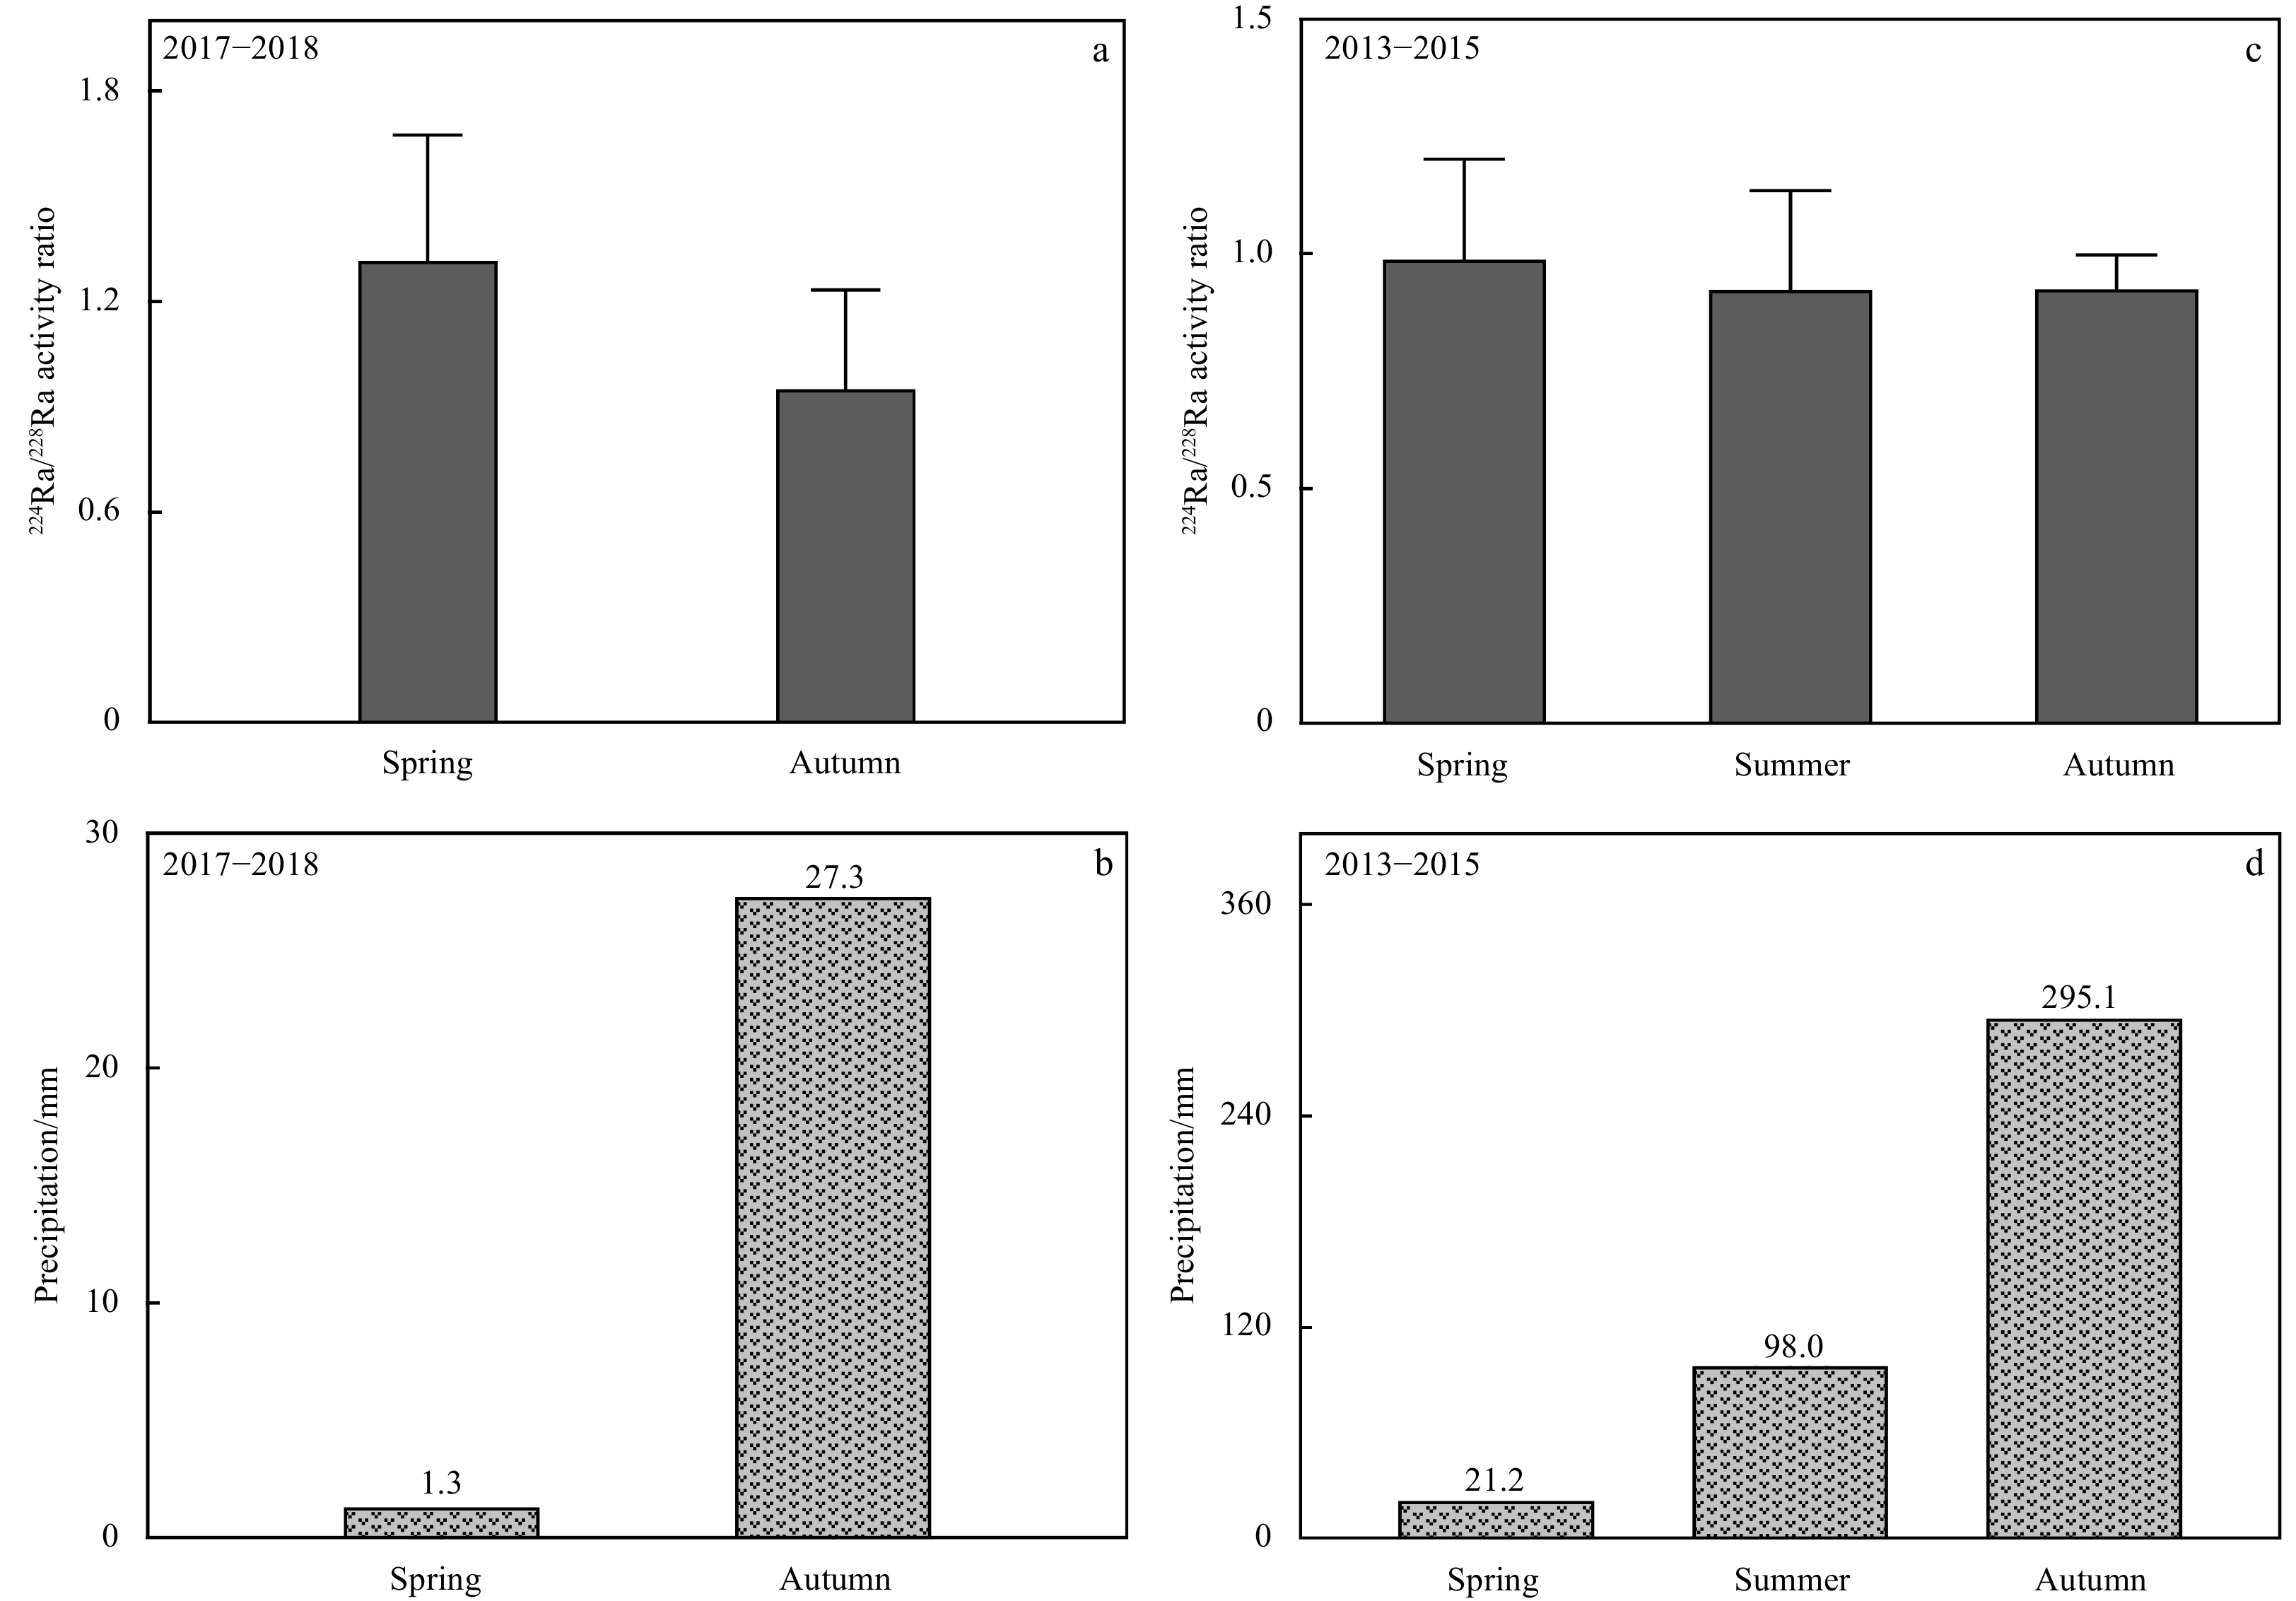
Figure 9. Relationship between 224Ra/228Ra isotope activity ratio and precipitation (mm) under different seasonal variations in groundwater (a, b) and surface water (c, d).
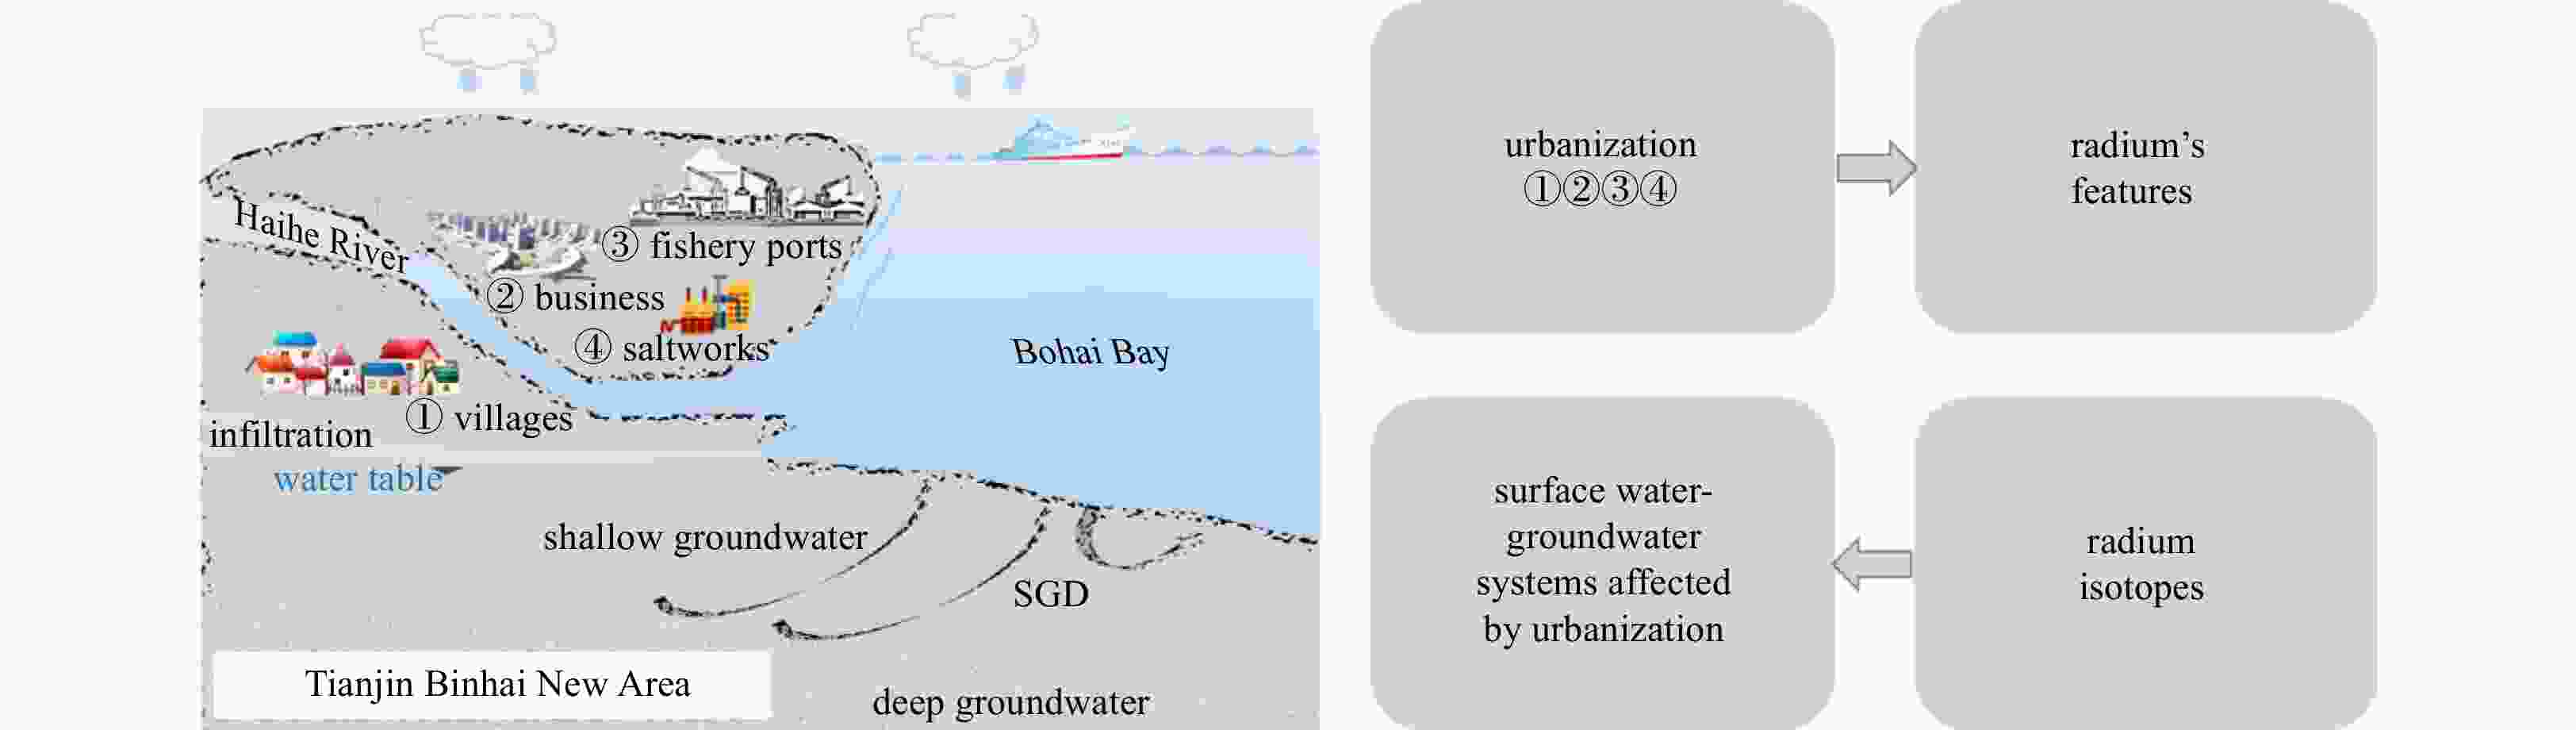
Figure 10. Relationship between rapid urbanization and radium isotopes in Tianjin Binhai New Area. SGD: submarine groundwater discharge.
Table 1. Measurements of 223Ra, 224Ra and 228Ra in groundwater
Sample Depth/m Latitude Longitude 223Ra/(dpm·(100 L)−1) 224Ra/(dpm·(100 L)−1) 228Ra/(dpm·(100 L)−1) Spring Autumn Spring Autumn Spring Autumn HG1 15 39.21°N 117.63°E 3.18 1.07 35.22 21.92 23.61 35.97 HG3 15 39.18°N 117.66°E 0.28 0.57 26.97 41.07 3.61 40.31 HG4 15 39.17°N 117.67°E 0.13 − 31.30 − 11.12 − HG4 30 39.17°N 117.67°E 0.26 − 9.03 − 6.71 − HG5 15 39.16°N 117.67°E 5.61 17.78 383.21 503.87 201.48 332.40 HG6 15 39.15°N 117.69°E 5.68 − 631.97 − 374.02 − HG6 30 39.15°N 117.69°E 0.24 − 56.28 − 64.14 − HG7 15 39.15°N 117.70°E 9.93 2.44 612.76 95.93 231.90 236.06 TG1 15 38.93°N 117.67°E 10.53 − 209.42 − 425.16 − TG2 15 38.94°N 117.66°E 5.87 − 138.73 − 416.04 − TG3 15 38.95°N 117.65°E 102.94 − 618.67 − 488.19 − TG3 30 38.95°N 117.65°E 1.49 24.74 65.34 1936.98 36.57 32.61 TG4 15 38.95°N 117.63°E 22.99 − 885.81 − 310.46 − TG5 15 38.95°N 117.61°E 1.34 9.94 80.45 317.81 72.22 169.45 TG5 30 38.95°N 117.61°E 2.31 0.89 3384.80 104.72 1099.93 23.24 TG7 15 38.97°N 117.56°E 0.66 0.52 63.47 17.42 93.21 33.73 TG8 15 38.99°N 117.53°E 1.20 1.49 40.92 52.20 55.61 55.11 TG8 30 38.99°N 117.53°E 7.49 − 289.43 − 340.15 − TG9 15 39.00°N 117.47°E 1.68 0.11 104.48 25.38 66.16 69.78 DG1 15 38.64°N 117.38°E 38.41 12.80 976.90 448.77 809.54 236.07 DG1 30 38.64°N 117.38°E 3.51 0.01 132.69 11.68 100.23 13.61 DG2 15 38.64°N 117.40°E 113.35 40.24 2702.10 906.58 949.95 904.35 DG3 15 38.65°N 117.44°E 70.22 1.06 1383.59 71.15 623.95 456.40 DG4 15 38.66°N 117.47°E 64.15 66.05 1489.13 1563.82 471.53 928.50 DG4 30 38.66°N 117.47°E 3.12 2.79 86.04 111.23 65.22 318.54 DG5 15 38.66°N 117.49°E 321.64 61.40 3022.17 1814.50 1047.14 1063.86 DG5 30 38.66°N 117.49°E 2.74 4.45 58.27 126.65 63.36 573.35 DG6 15 38.66°N 117.51°E 356.12 61.55 3281.96 1846.62 1452.83 1810.29 DG7 30 38.66°N 117.52°E 357.64 1.59 3026.60 182.59 1100.73 198.41 DG7 15 38.66°N 117.52°E 2.48 15.92 198.73 947.32 332.17 1035.72 DG8 15 38.66°N 117.56°E 314.88 11.17 4276.96 214.62 2004.84 572.41 DG9 15 38.66°N 117.55°E 47.34 24.28 1671.79 552.71 639.33 825.89 DG9 30 38.66°N 117.55°E 10.32 4.51 314.65 173.82 415.58 495.18 DG10 15 38.67°N 117.54°E 91.89 18.79 2105.74 426.99 766.39 1060.53 Note: HG: Hangu; TG: Tanggu; DG: Dagang. − represents no data.  下载: 导出CSV
Table 2. Measurements of 223Ra, 224Ra and 228Ra in surface water
Station Latitude Longitude 223Ra/(dpm·(100 L)−1) 224Ra/(dpm·(100 L)−1) 228Ra/(dpm·(100 L)−1) Spring Summer Autumn Spring Summer Autumn Spring Summer Autumn HH1 39.13°N 117.20°E 0.24 0.31 0.39 7.06 10.16 7.64 11.39 15.15 7.41 HH2 39.10°N 117.24°E 0.34 0.36 0.38 4.55 8.76 6.25 8.95 13.56 7.53 HH3 39.08°N 117.29°E 0.38 0.29 0.43 6.92 9.04 8.57 10.75 24.95 9.59 HH4 39.05°N 117.51°E 0.11 0.29 0.41 5.20 10.43 8.04 14.07 10.45 9.12 HH5 38.99°N 117.51°E 0.46 0.73 0.70 17.05 17.35 12.20 50.68 35.65 34.67 HH6 38.98°N 117.58°E 0.79 0.54 0.84 17.10 18.30 14.56 59.69 58.07 37.85 HH7 38.99°N 117.71°E 2.13 2.34 2.03 40.43 50.07 45.02 193.13 156.77 188.08 DLJ1 38.84°N 117.30°E 2.02 2.49 1.13 51.75 50.62 23.09 52.11 53.61 41.17 DLJ2 38.88°N 117.21°E 2.79 1.95 1.35 56.38 46.00 31.80 53.48 41.84 39.58 DLJ3 38.91°N 117.18°E 2.08 2.14 1.34 60.20 49.91 25.85 50.85 51.42 37.98 DLJ4 38.99°N 117.09°E 1.59 1.46 1.22 42.58 30.92 27.64 32.28 20.32 27.61 DLJ5 39.00°N 117.06°E 1.95 0.93 0.98 43.54 45.48 22.39 33.34 38.84 22.57 DLJ6 39.03°N 116.98°E 2.25 1.54 0.72 56.04 42.10 20.46 44.32 31.06 19.46 DLJ7 39.05°N 116.92°E 1.08 1.55 0.66 33.07 31.75 15.81 33.85 29.92 18.99 Note: HH: Haihe River; DLJ: Duliujian River.
下载: 导出CSV
Table 3. Measurements of chemical concentration parameters in groundwater in spring
Sample Depth/
mTDS/
(mg·L−1)K+/
(mg·L−1)Ca2+/
(mg·L−1)Na+/
(mg·L−1)Mg2+/
(mg·L−1)${{\rm {HCO}_3^-}} $/
(mg·L−1)${{\rm {SO}}_4^{2-}} $/
(mg·L−1)$ {{\rm {NO}}_3^-} $/
(mg·L−1)${\rm{Cl}}^- $/
(mg·L−1)HG1 15 15678 67 60 11613 197 1360 1250 0.92 1130 HG3 15 8824 82 43 4305 133 930 760 1.29 2570 HG4 15 6731 116 103 5434 284 553 118 0.52 123 HG4 30 4257 21 26 2998 62 558 232 0.25 360 HG5 15 34702 232 187 7602 357 362 2860 1.21 23100 HG6 15 23180 267 199 3057 343 412 4700 0.74 14200 HG6 30 14994 161 70 6949 254 89 740 0.67 6730 HG7 15 19313 205 113 2166 314 585 3230 0.62 12700 TG1 15 79654 481 370 9682 382 533 14200 6.60 54000 TG2 15 52203 354 351 8791 399 56 6550 1.76 35700 TG3 15 104833 490 303 5048 397 293 14000 2.21 84300 TG3 30 121341 532 299 15089 398 322 13700 2.36 91000 TG4 15 22963 351 69 2017 354 661 4110 0.81 15400 TG5 15 58255 249 339 12475 389 − 3900 3.09 40900 TG5 30 46801 254 279 10395 382 10 2580 1.40 32900 TG7 15 10776 35 46 8523 103 484 870 0.25 714 TG8 15 4665 19 44 2849 68 723 520 8.37 433 TG8 30 22007 141 105 15683 232 551 412 3.50 4880 TG9 15 6103 35 48 3978 75 755 462 1.97 748 DG1 15 26912 192 97 6682 343 841 855 1.86 17900 DG1 30 16949 117 21 3116 339 300 855 0.93 12200 DG2 15 44082 299 181 8850 386 474 2490 1.29 31400 DG3 15 28403 254 112 4691 376 508 2460 1.06 20000 DG4 15 43380 274 213 8939 355 218 4080 0.90 29300 DG4 30 17297 65 53 4542 334 181 1420 1.00 10700 DG5 15 70040 343 313 14673 379 231 6100 1.26 48000 DG5 30 20207 75 134 6355 310 72 1460 0.87 11800 DG6 15 57951 344 311 12980 373 303 4640 1.23 39000 DG7 30 59115 314 301 13010 377 273 3340 1.30 41500 DG7 15 23947 156 92 10128 318 82 970 0.97 12200 DG8 15 80300 395 264 16159 374 456 4650 1.52 58000 DG9 15 72836 395 234 14911 373 122 6000 1.44 50800 DG9 30 20547 239 116 3800 320 62 1410 0.83 14600 DG10 15 43826 324 198 10930 367 384 4420 2.99 27200 Note: − represents no data. TDS: total dissolved solids.
下载: 导出CSV
Table 4. Measurements of chemical concentration parameters in groundwater in autumn
Sample Depth/
mTDS/
(mg·L−1)K+/
(mg·L−1)Ca2+/
(mg·L−1)Na+/
(mg·L−1)Mg2+/
(mg·L−1)${{\rm {HCO}_3^-}} $/
(mg·L−1)${{\rm {SO}}_4^{2-}} $/
(mg·L−1)$ {{\rm {NO}}_3^-} $/
(mg·L−1)${\rm{Cl} }^- $/
(mg·L−1)HG1 15 4691 47 26 1274 228 837 1005 0.52 1274 HG3 15 6997 66 46 2103 172 645 834 1.26 3130 HG5 15 9657 76 6 2848 267 231 1627 1.15 4600 HG7 15 26654 181 50 7687 909 249 1698 0.56 15880 TG3 15 73568 1699 847 41400 8015 31 1814 2.36 19760 TG3 30 164712 1721 832 44220 8546 176 12034 2.46 97180 TG5 15 70196 268 670 19520 3749 70 3376 2.24 42540 TG5 30 80081 280 757 20710 4257 66 4870 1.40 49140 TG7 15 1935 24 27 549 80 308 333 1.03 612 TG8 15 2015 11 43 645 41 506 231 4.64 533 TG9 15 2470 24 26 730 82 376 422 1.88 808 DG1 15 8701 50 63 2378 365 181 272 1.76 5391 DG1 30 1512 39 32 376 30 37 431 0.83 568 DG2 15 64348 337 211 17110 2960 113 2836 1.19 40780 DG3 15 46939 256 67 12490 2066 149 2660 0.99 29250 DG4 15 57208 75 196 16340 1661 61 4074 0.85 34800 DG4 30 53374 173 49 14480 1848 42 2541 1.00 34240 DG5 15 86353 380 423 22250 3193 59 6718 1.16 53330 DG5 30 67421 309 371 17490 2447 40 4004 0.85 42760 DG6 15 84240 402 583 22260 2173 77 5094 1.22 53650 DG7 30 84254 430 553 22060 2996 74 3700 1.29 54440 DG7 15 30442 205 45 8433 1055 353 − 0.87 20350 DG8 15 33488 281 475 8621 818 48 3933 1.44 19310 DG9 15 94240 680 8 25690 3030 49 7012 1.50 57770 DG9 30 38044 232 145 10350 1107 29 1890 0.93 24290 DG10 15 66001 446 220 17170 2350 141 5510 3.01 40160 Note: − represents no data. TDS: total dissolved solids.
下载: 导出CSV
Table 5. Stratigraphic division of groundwater (Hangu (HG), Tanggu (TG) and Dagang (DG)) profiles
Study
areaLayer bottom
elevation/mComposition of sediments HG −9.6 sand silty sand layer HG −18.0 silt layer HG −19.0 silt layer HG −21.0 clay silty sand layer TG −18.6 clay silty sand layer TG −19.2 shell sand layer TG −20.3 clay silty sand layer TG −23.0 silt layer DG −10.0 clay silty sand layer and fine sand layer DG −16.7 clay silty sand layer DG −30.2 clay silty sand layer
下载: 导出CSV
-
Abboud I A. 2018. Geochemistry and quality of groundwater of the Yarmouk basin aquifer, north Jordan. Environmental Geochemistry and Health, 40(4): 1405–1435. doi: 10.1007/s10653-017-0064-x Adelana S M, Heaven M W, Dresel P E, et al. 2020. Controls on species distribution and biogeochemical cycling in nitrate-contaminated groundwater and surface water, southeastern Australia. Science of the Total Environment, 726: 138426. doi: 10.1016/j.scitotenv.2020.138426 Baskaran S, Ransley T, Brodie R S, et al. 2009. Investigating groundwater–river interactions using environmental tracers. Australian Journal of Earth Sciences, 56(1): 13–19. doi: 10.1080/08120090802541887 Beck A J, Cochran M A. 2013. Controls on solid-solution partitioning of radium in saturated marine sands. Marine Chemistry, 156: 38–48. doi: 10.1016/j.marchem.2013.01.008 Beck A J, Rapaglia J P, Cochran J K, et al. 2007. Radium mass-balance in Jamaica Bay, NY: evidence for a substantial flux of submarine groundwater. Marine Chemistry, 106(3–4): 419–441, Cao Xuliang, Corriveau J. 2008. Migration of bisphenol A from polycarbonate baby and water bottles into water under severe conditions. Journal of Agricultural and Food Chemistry, 56(15): 6378–6381. doi: 10.1021/jf800870b Charette M A, Morris P J, Henderson P B, et al. 2015. Radium isotope distributions during the US GEOTRACES North Atlantic cruises. Marine Chemistry, 177: 184–195. doi: 10.1016/j.marchem.2015.01.001 Charette M A, Sholkovitz E R. 2002. Oxidative precipitation of groundwater-derived ferrous iron in the subterranean estuary of a coastal bay. Geophysical Research Letters, 29(10): 1444. doi: 10.1029/2001g104512 Charette M A, Sholkovitz E R. 2006. Trace element cycling in a subterranean estuary: Part 2. Geochemistry of the pore water. Geochimica et Cosmochimica Acta, 70(4): 811–826. doi: 10.1016/j.gca.2005.10.019 Chen Guangquan, Xu Bochao, Zhao Shibin, et al. 2022. Submarine groundwater discharge and benthic biogeochemical zonation in the Huanghe River Estuary. Acta Oceanologica Sinica, 41(1): 11–20. doi: 10.1007/s13131-021-1882-3 Elsinger R J, Moore W S. 1980. 226Ra behavior in the Pee Dee River-Winyah Bay estuary. Earth and Planetary Science Letters, 48(2): 239–249. doi: 10.1016/0012-821X(80)90187-9 Garcia-Orellana J, Rodellas V, Tamborski J, et al. 2021. Radium isotopes as submarine groundwater discharge (SGD) tracers: review and recommendations. Earth-Science Reviews, 220: 103681. doi: 10.1016/j.earscirev.2021.103681 Giggenbach W F. 1988. Geothermal solute equilibria. Derivation of Na-K-Mg-Ca geoindicators. Geochimica et Cosmochimica Acta, 52(12): 2749–2765. doi: 10.1016/0016-7037(88)90143-3 Gonneea M E, Morris P J, Dulaiova H, et al. 2008. New perspectives on radium behavior within a subterranean estuary. Marine Chemistry, 109(3–4): 250–267, Grundl T, Cape M. 2006. Geochemical factors controlling radium activity in a sandstone aquifer. Groundwater, 44(4): 518–527. doi: 10.1111/j.1745-6584.2006.00162.x IAEA. 2014. The environmental behaviour of radium: revised edition. Vienna: International Atomic Energy Agency, 33–51 Jiao Jiu-jimmy, Leung Chi-man, Ding Guoping. 2008. Changes to the groundwater system, from 1888 to present, in a highly-urbanized coastal area in Hong Kong, China. Hydrogeology Journal, 16(8): 1527–1539. doi: 10.1007/s10040-008-0332-z Kelly R P, Moran S B. 2002. Seasonal changes in groundwater input to a well-mixed estuary estimated using radium isotopes and implications for coastal nutrient budgets. Limnology and Oceanography, 47(6): 1796–1807. doi: 10.4319/lo.2002.47.6.1796 Kiro Y, Yechieli Y, Voss C I, et al. 2012. Modeling radium distribution in coastal aquifers during sea level changes: the Dead Sea case. Geochimica et Cosmochimica Acta, 88: 237–254. doi: 10.1016/j.gca.2012.03.022 Krest J M, Harvey J W. 2003. Using natural distributions of short-lived radium isotopes to quantify groundwater discharge and recharge. Limnology and Oceanography, 48(1): 290–298. doi: 10.4319/lo.2003.48.1.0290 Ku T L, Huh C A, Chen P S. 1980. Meridional distribution of 226Ra in the eastern Pacific along GEOSECS cruise tracks. Earth and Planetary Science Letters, 49(2): 293–308. doi: 10.1016/0012-821X(80)90073-4 Langmuir D, Melchior D. 1985. The geochemistry of Ca, Sr, Ba and Ra sulfates in some deep brines from the Palo Duro Basin, Texas. Geochimica et Cosmochimica Acta, 49(11): 2423–2432. doi: 10.1016/0016-7037(85)90242-X Lei Kun, Meng Wei, Zheng Binghui, et al. 2007. Variations of water and sediment discharges to the western coast of Bohai Bay and the environmental impacts. Acta Scientiae Circumstantiae (in Chinese), 27(12): 2052–2059 Liao Fu, Wang Guangcai, Yi Lixin, et al. 2020. Applying radium isotopes to estimate groundwater discharge into Poyang Lake, the largest freshwater lake in China. Journal of Hydrology, 585: 124782. doi: 10.1016/j.jhydrol.2020.124782 Liu Rongfang, Chen Honghan, Wang Yanliang, et al. 2007. Analysis on characteristics of groundwater pollution in the oilfield. Ground Water (in Chinese), 29(3): 62–66 Liu Huatai, Guo Zhanrong, Gao Aiguo, et al. 2013. Distribution characteristics of radium and determination of transport rate in the Min River Estuary Mixing Zone. Journal of Jilin University: Earth Science Edition (in Chinese), 43(6): 1966–1971 Liu Yi, Jiao Jiu-jimmy, Mao Rong, et al. 2019. Spatial characteristics reveal the reactive transport of radium isotopes (224Ra, 223Ra, and 228Ra) in an intertidal aquifer. Water Resources Research, 55(12): 10282–10302. doi: 10.1029/2019WR024849 Liu Lingling, Yi Lixin, Cheng Xiaoqing, et al. 2015. Distribution of 223Ra and 224Ra in the Bo Sea embayment in Tianjin and its implication of submarine groundwater discharge. Journal of Environmental Radioactivity, 150: 111–120. doi: 10.1016/j.jenvrad.2015.08.008 Lu Xinyan, Yi Lixin, Pu Tao, et al. 2022. Quantifying the groundwater seepage along a glacier originated river by integrated use of radium isotopes and hydrochemistry. Journal of Environmental Radioactivity, 251–252: 106959, Luo Xin, Jiao Jiu-jimmy, Moore W S, et al. 2014. Submarine groundwater discharge estimation in an urbanized embayment in Hong Kong via short-lived radium isotopes and its implication of nutrient loadings and primary production. Marine Pollution Bulletin, 82(1–2): 144–154, Moore W S. 1996. Large groundwater inputs to coastal waters revealed by 226Ra enrichments. Nature, 380(6575): 612–614. doi: 10.1038/380612a0 Moore W S. 2000a. Determining coastal mixing rates using radium isotopes. Continental Shelf Research, 20(15): 1993–2007. doi: 10.1016/S0278-4343(00)00054-6 Moore W S. 2000b. Ages of continental shelf waters determined from 223Ra and 224Ra. Journal of Geophysical Research: Oceans, 105(C9): 22117–22122. doi: 10.1029/1999JC000289 Moore W S. 2008. Fifteen years experience in measuring 224Ra and 223Ra by delayed-coincidence counting. Marine Chemistry, 109(3–4): 188–197, Moore W S. 2010. The effect of submarine groundwater discharge on the ocean. Annual Review of Marine Science, 2: 59–88. doi: 10.1146/annurev-marine-120308-081019 Moore W S, Arnold R. 1996. Measurement of 223Ra and 224Ra in coastal waters using a delayed coincidence counter. Journal of Geophysical Research: Oceans, 101(C1): 1321–1329. doi: 10.1029/95JC03139 Moore W S, Astwood H, Lindstrom C. 1995. Radium isotopes in coastal waters on the Amazon shelf. Geochimica et Cosmochimica Acta, 59(20): 4285–4298. doi: 10.1016/0016-7037(95)00242-R Moore W S, Blanton J O, Joye S B. 2006. Estimates of flushing times, submarine groundwater discharge, and nutrient fluxes to Okatee Estuary, South Carolina. Journal of Geophysical Research, 111(C9): C09006. doi: 10.1029/2005jc003041 Moore W S, Key R M, Sarmiento J L. 1985. Techniques for precise mapping of 226Ra and 228Ra in the ocean. Journal of Geophysical Research: Oceans, 90(C4): 6983–6994. doi: 10.1029/JC090iC04p06983 Nie Hongtao, Tao Jianhua. 2009. Eco-environment status of the Bohai Bay and the impact of coastal exploitation. Marine Science Bulletin, 11(2): 81–96 Parmaksız A, Ağuş Y, Bulgurlu F, et al. 2015. Measurement of enhanced radium isotopes in oil production wastes in Turkey. Journal of Environmental Radioactivity, 141: 82–89. doi: 10.1016/j.jenvrad.2014.12.011 Pei Yandong, Wang Guoming. 2016. Engineering geological characteristics of Late Quaternary sediments in the southern coastal area of Tianjin Binhai New Area. Geological Survey and Research (in Chinese), 39(3): 215–220 Plater A J, Ivanovich M, Dugdale R E. 1995. 226Ra contents and 228Ra/226Ra activity ratios of the Fenland rivers and the Wash, eastern England: spatial and seasonal trends. Chemical Geology, 119(1–4): 275–292, Pulido-Bosch A, Rigol-Sanchez J P, Vallejos A, et al. 2018. Impacts of agricultural irrigation on groundwater salinity. Environmental Earth Sciences, 77(5): 197. doi: 10.1007/s12665-018-7386-6 Shao Haibing, Kulik D A, Berner U, et al. 2009. Modeling the competition between solid solution formation and cation exchange on the retardation of aqueous radium in an idealized bentonite column. Geochemical Journal, 43(6): e37–e42. doi: 10.2343/geochemj.1.0069 Sherif M I, Lin Jiajia, Poghosyan A, et al. 2018. Geological and hydrogeochemical controls on radium isotopes in groundwater of the Sinai Peninsula, Egypt. Science of The Total Environment, 613–614: 877–885, Silva K B, Mattos J B. 2020. A spatial approach for the management of groundwater quality in tourist destinations. Tourism Management, 79: 104079. doi: 10.1016/j.tourman.2020.104079 Stefánsson A, Arnórsson S, Sveinbjörnsdóttir Á E. 2005. Redox reactions and potentials in natural waters at disequilibrium. Chemical Geology, 221(3–4): 289–311, Su Ni, Du Jinzhou, Liu Sumei, et al. 2013. Nutrient fluxes via radium isotopes from the coast to offshore and from the seafloor to upper waters after the 2009 spring bloom in the Yellow Sea. Deep-Sea Research Part II: Topical Studies in Oceanography, 97: 33–42. doi: 10.1016/j.dsr2.2013.05.003 Sun Congjian, Chen Ruoxia, Zhang Ziyu, et al. 2018. Temporal and spatial variation of hydrochemical characteristics of shallow groundwater in Shanxi Province. Arid Land Geography (in Chinese), 41(2): 314–324 Tang Guoqiang, Yi Lixin, Liu Lingling, et al. 2015. Factors influencing the distribution of 223Ra and 224Ra in the coastal waters off Tanggu and Qikou in Bohai Bay. Continental Shelf Research, 109: 177–187. doi: 10.1016/j.csr.2015.09.003 Trainer F W, Heath R C. 1976. Bicarbonate content of groundwater in carbonate rock in eastern North America. Journal of Hydrology, 31(1–2): 37–55, Underwood E C, Ferguson G A, Betcher R, et al. 2009. Elevated Ba concentrations in a sandstone aquifer. Journal of Hydrology, 376(1–2): 126–131, van der Loeff M R, Kühne S, Wahsner M, et al. 2003. 228Ra and 226Ra in the Kara and Laptev seas. Continental Shelf Research, 23(1): 113–124. doi: 10.1016/S0278-4343(02)00169-3 Vinson D S, Tagma T, Bouchaou L, et al. 2013. Occurrence and mobilization of radium in fresh to saline coastal groundwater inferred from geochemical and isotopic tracers (Sr, S, O, H, Ra, Rn). Applied Geochemistry, 38: 161–175. doi: 10.1016/j.apgeochem.2013.09.004 Waska H, Kim S, Kim G, et al. 2008. An efficient and simple method for measuring 226Ra using the scintillation cell in a delayed coincidence counting system (RaDeCC). Journal of Environmental Radioactivity, 99(12): 1859–1862. doi: 10.1016/j.jenvrad.2008.08.008 Wu Yinghai, Zhu Weibin, Chen Xiaohua, et al. 2005. Effects of enclosing-bank and hydraulic fill projects on water environment. Water Resources Protection (in Chinese), 21(2): 53–56 Xiao Qingcong, Wei Yuansong, Wang Yawei, et al. 2012. Driving factors of coastal wetland degradation in Binhai New Area of Tianjin. Acta Scientiae Circumstantiae (in Chinese), 32(2): 480–488 Yi Lixin, Dong Na, Zhang L, et al. 2019. Radium isotopes distribution and submarine groundwater discharge in the Bohai Sea. Groundwater for Sustainable Development, 9: 100242. doi: 10.1016/j.gsd.2019.100242 Yi Lixin, Zhang Fang, Xu He, et al. 2011. Land subsidence in Tianjin, China. Environmental Earth Sciences, 62(6): 1151–1161. doi: 10.1007/s12665-010-0604-5 -


 点击查看大图
计量
- 文章访问数: 333
- HTML全文浏览量: 136
- PDF下载量: 27
- 被引次数: 0

