

-
Abstract: The Agulhas system is the strongest western boundary current system in the Southern Hemisphere and plays an important role in modulating the Indian-to-Atlantic Ocean water exchange by the Agulhas leakage. It is difficult to measure in situ transport of the Agulhas leakage as well as the Agulhas retroflection position due to their intermittent nature. In this study, an innovative kinematic algorithm is designed and applied to the gridded altimeter observational data, to ascertain the longitudinal position of Agulhas retroflection, the stability of Agulhas jet stream, as well as its strength. The results show that the east-west shift of retroflection is related neither to the strength of Agulhas current nor to its stability. Further analysis uncovers the connection between the westward extension of Agulhas jet stream and an anomalous cyclonic circulation at its northern side, which is likely attributed to the local wind stress curl anomaly. To confirm the effect of local wind forcing on the east-west shift of retroflection, numerical sensitivity experiments are conducted. The results show that the local wind stress can induce a similar longitudinal shift of the retroflection as altimetry observations. Further statistical and case study indicates that whether an Agulhas ring can continuously migrate westward to the Atlantic Ocean or re-merge into the main flow depends on the retroflection position. Therefore, the westward retroflection may contribute to a stronger Agulhas leakage than the eastward retroflection.
-
Key words:
- Agulhas system /
- Agulhas leakage /
- retroflection position /
- local wind stress curl
-
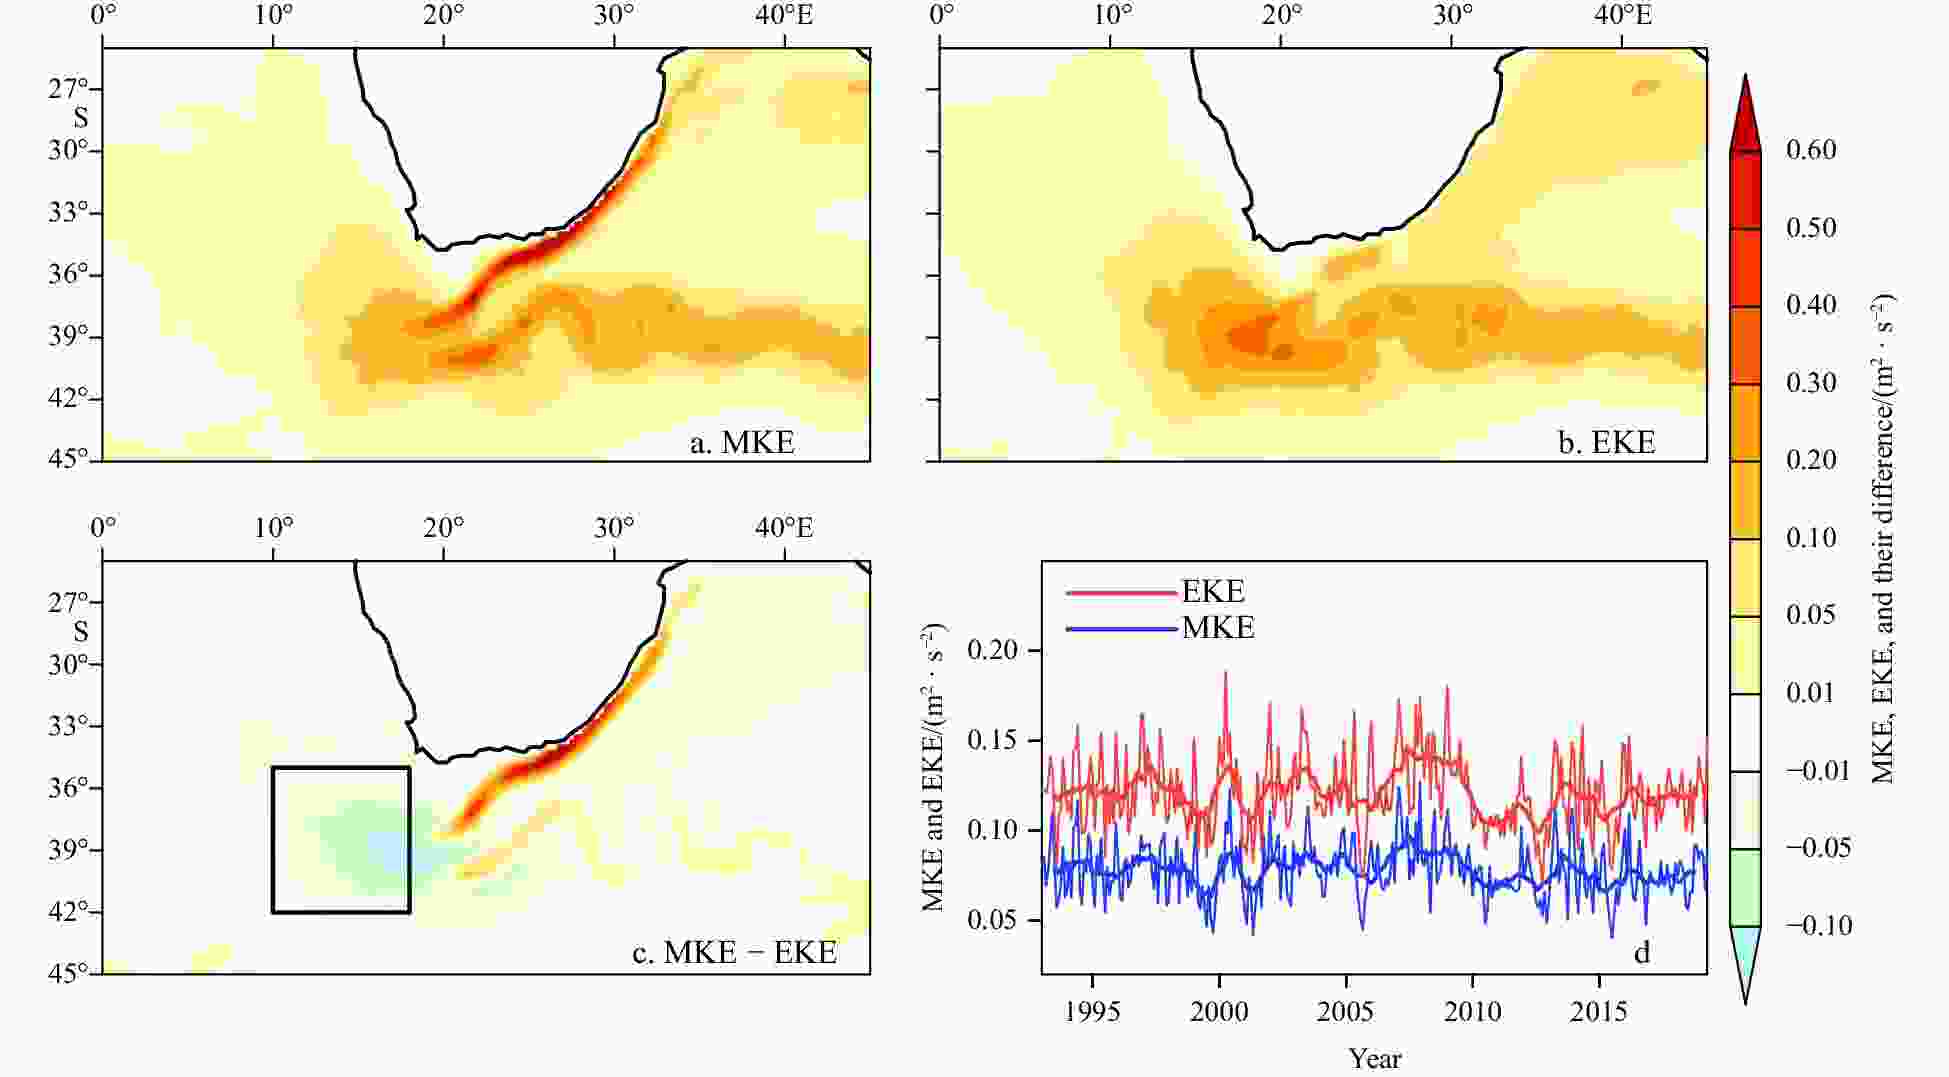
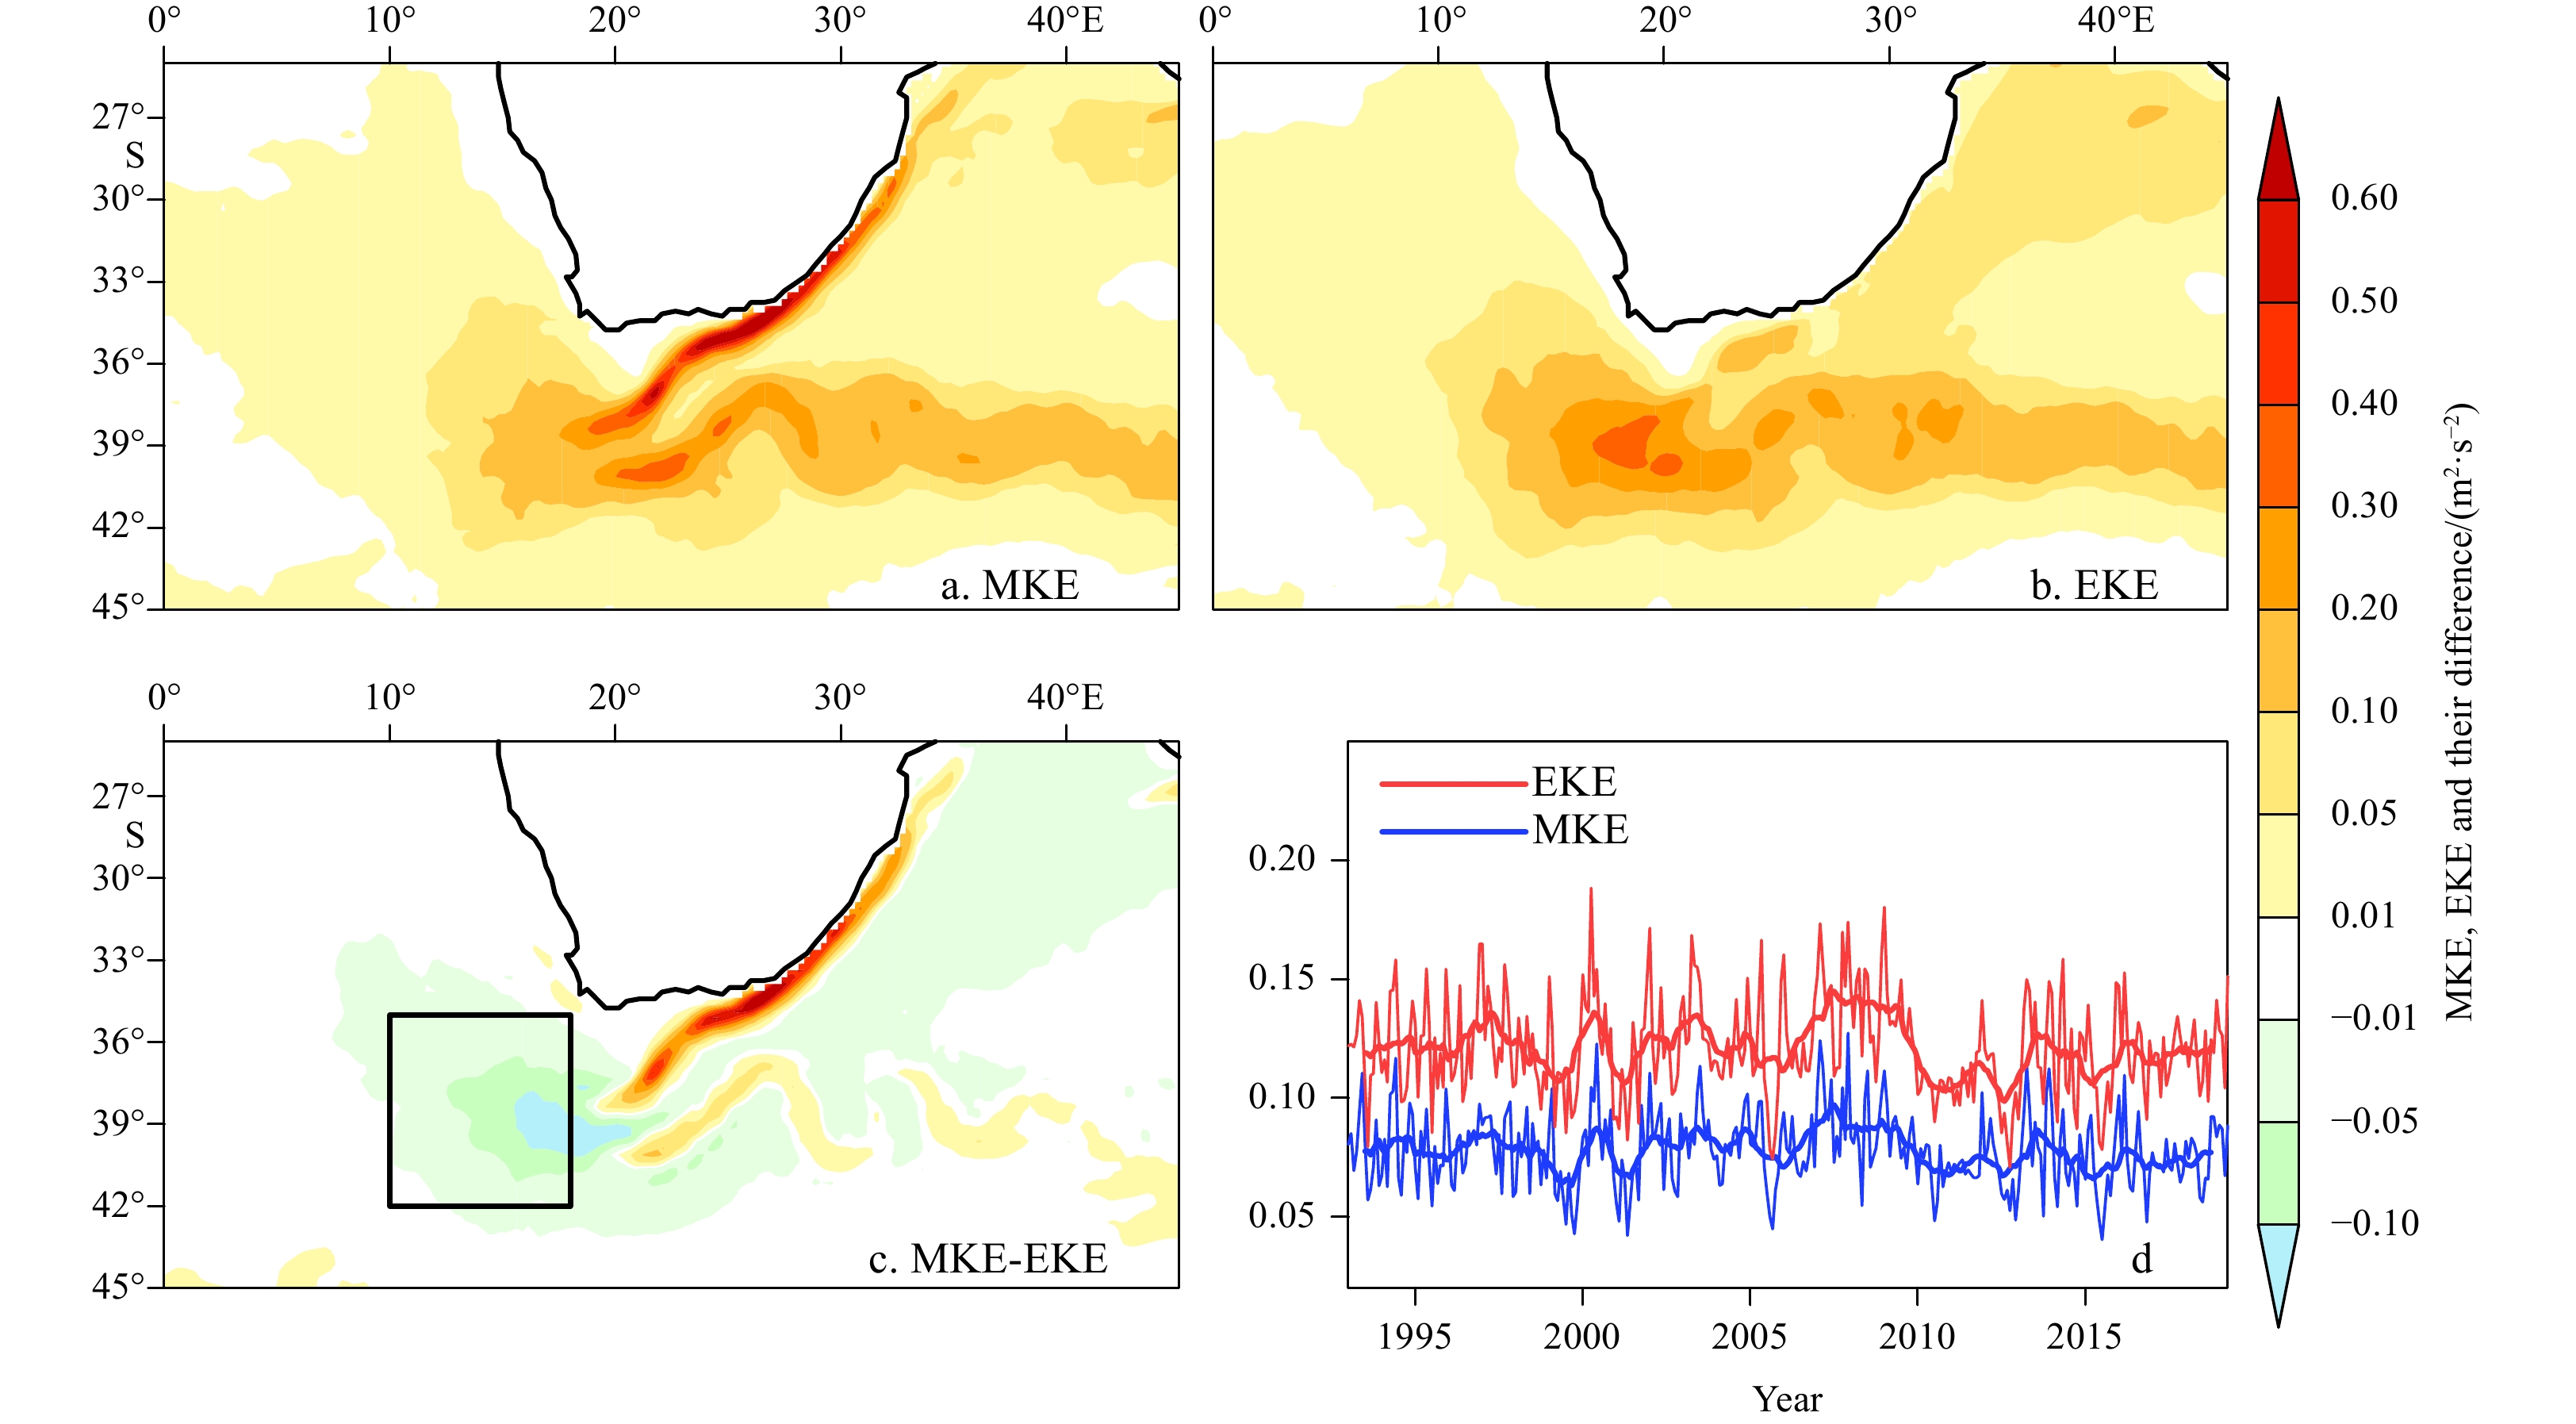
Figure 1. The climatology of mean kinetic energy (MKE) (a) and eddy kinetic energy (EKE) (b) in the Agulhas system during 1993 to 2018, which is computed using the geostrophic velocity from the gridded L4 satellite altimetry product, the difference between MKE and EKE (c) and the time series of EKE and MKE in the black rectangular box (10°-18°E,35°-42°S) in c, which denotes the region where MKE is much less than EKE and is roughly the origin of Agulhas leakage as well (d). The unit for EKE, MKE and their difference is m2/s2.
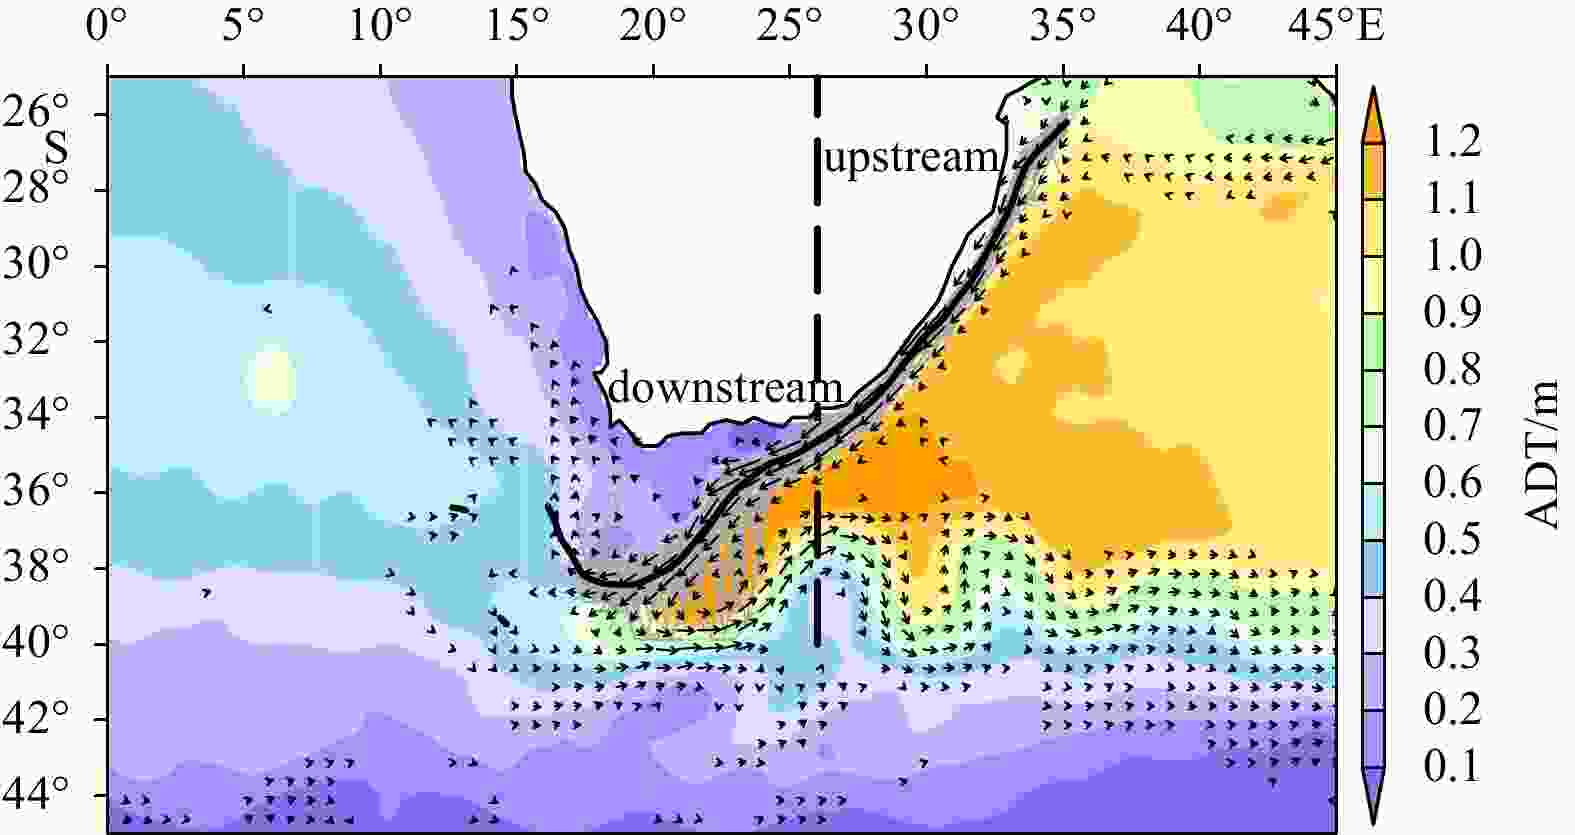
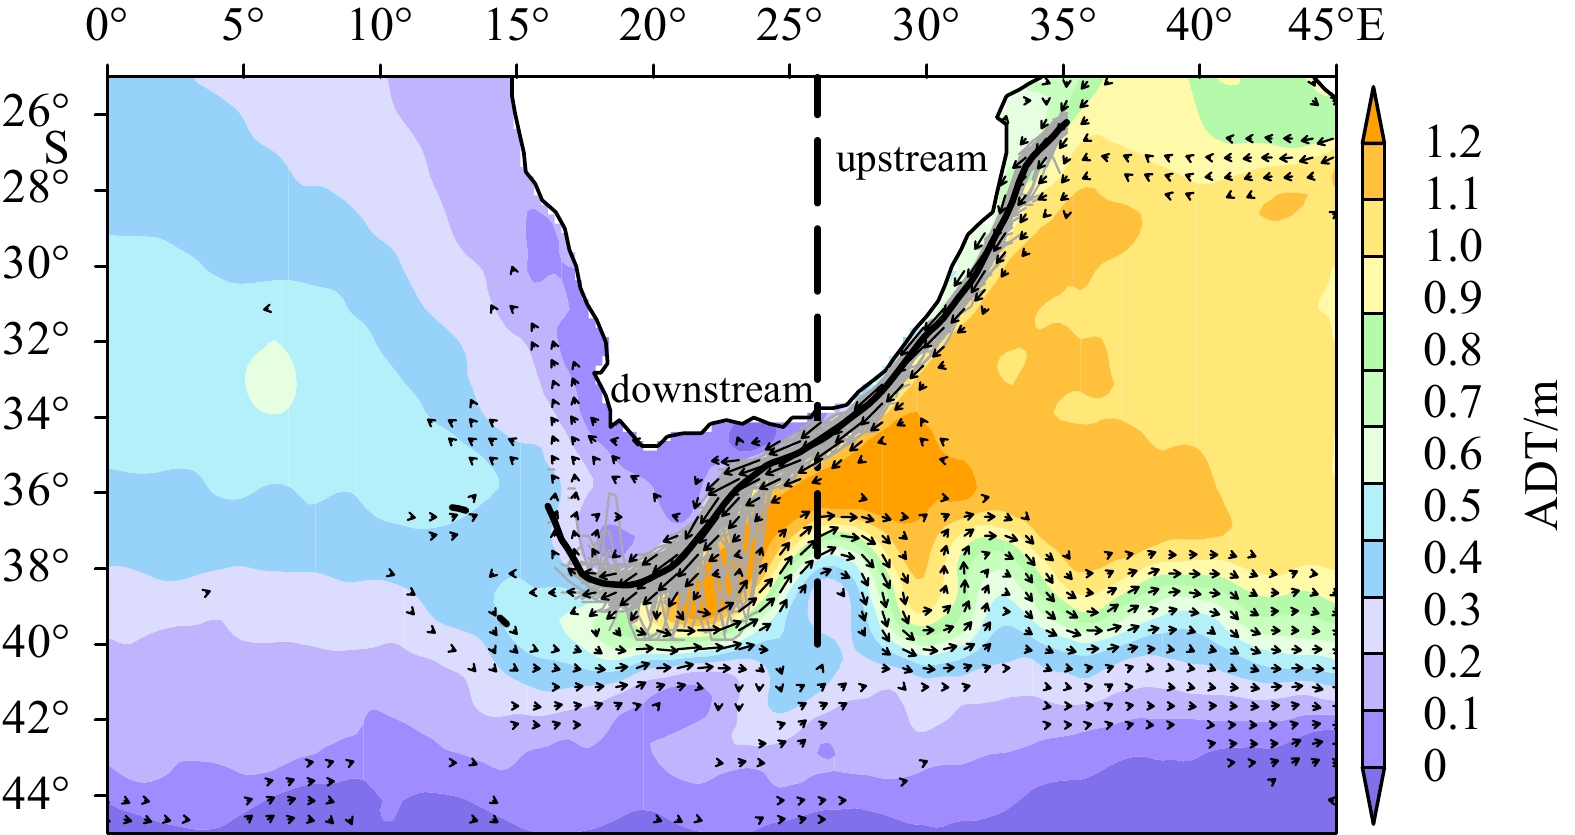
Figure 2. The climatology of absolute dynamic topography (ADT) (colored shading, unit: m), and the corresponding geostrophic velocity (black vectors) during the period of January 1993–December 2018. The thick black line is the mean location of the Agulhas current jet path derived for each available longitudinal grid (with (1/4)° increment). The grey lines are all the identified Agulhas current jet path. The dashed black line at 26°E approximately divides the Agulhas current jet path into upstream and downstream sections. It is noted that the variation of the paths gets much higher downstream.
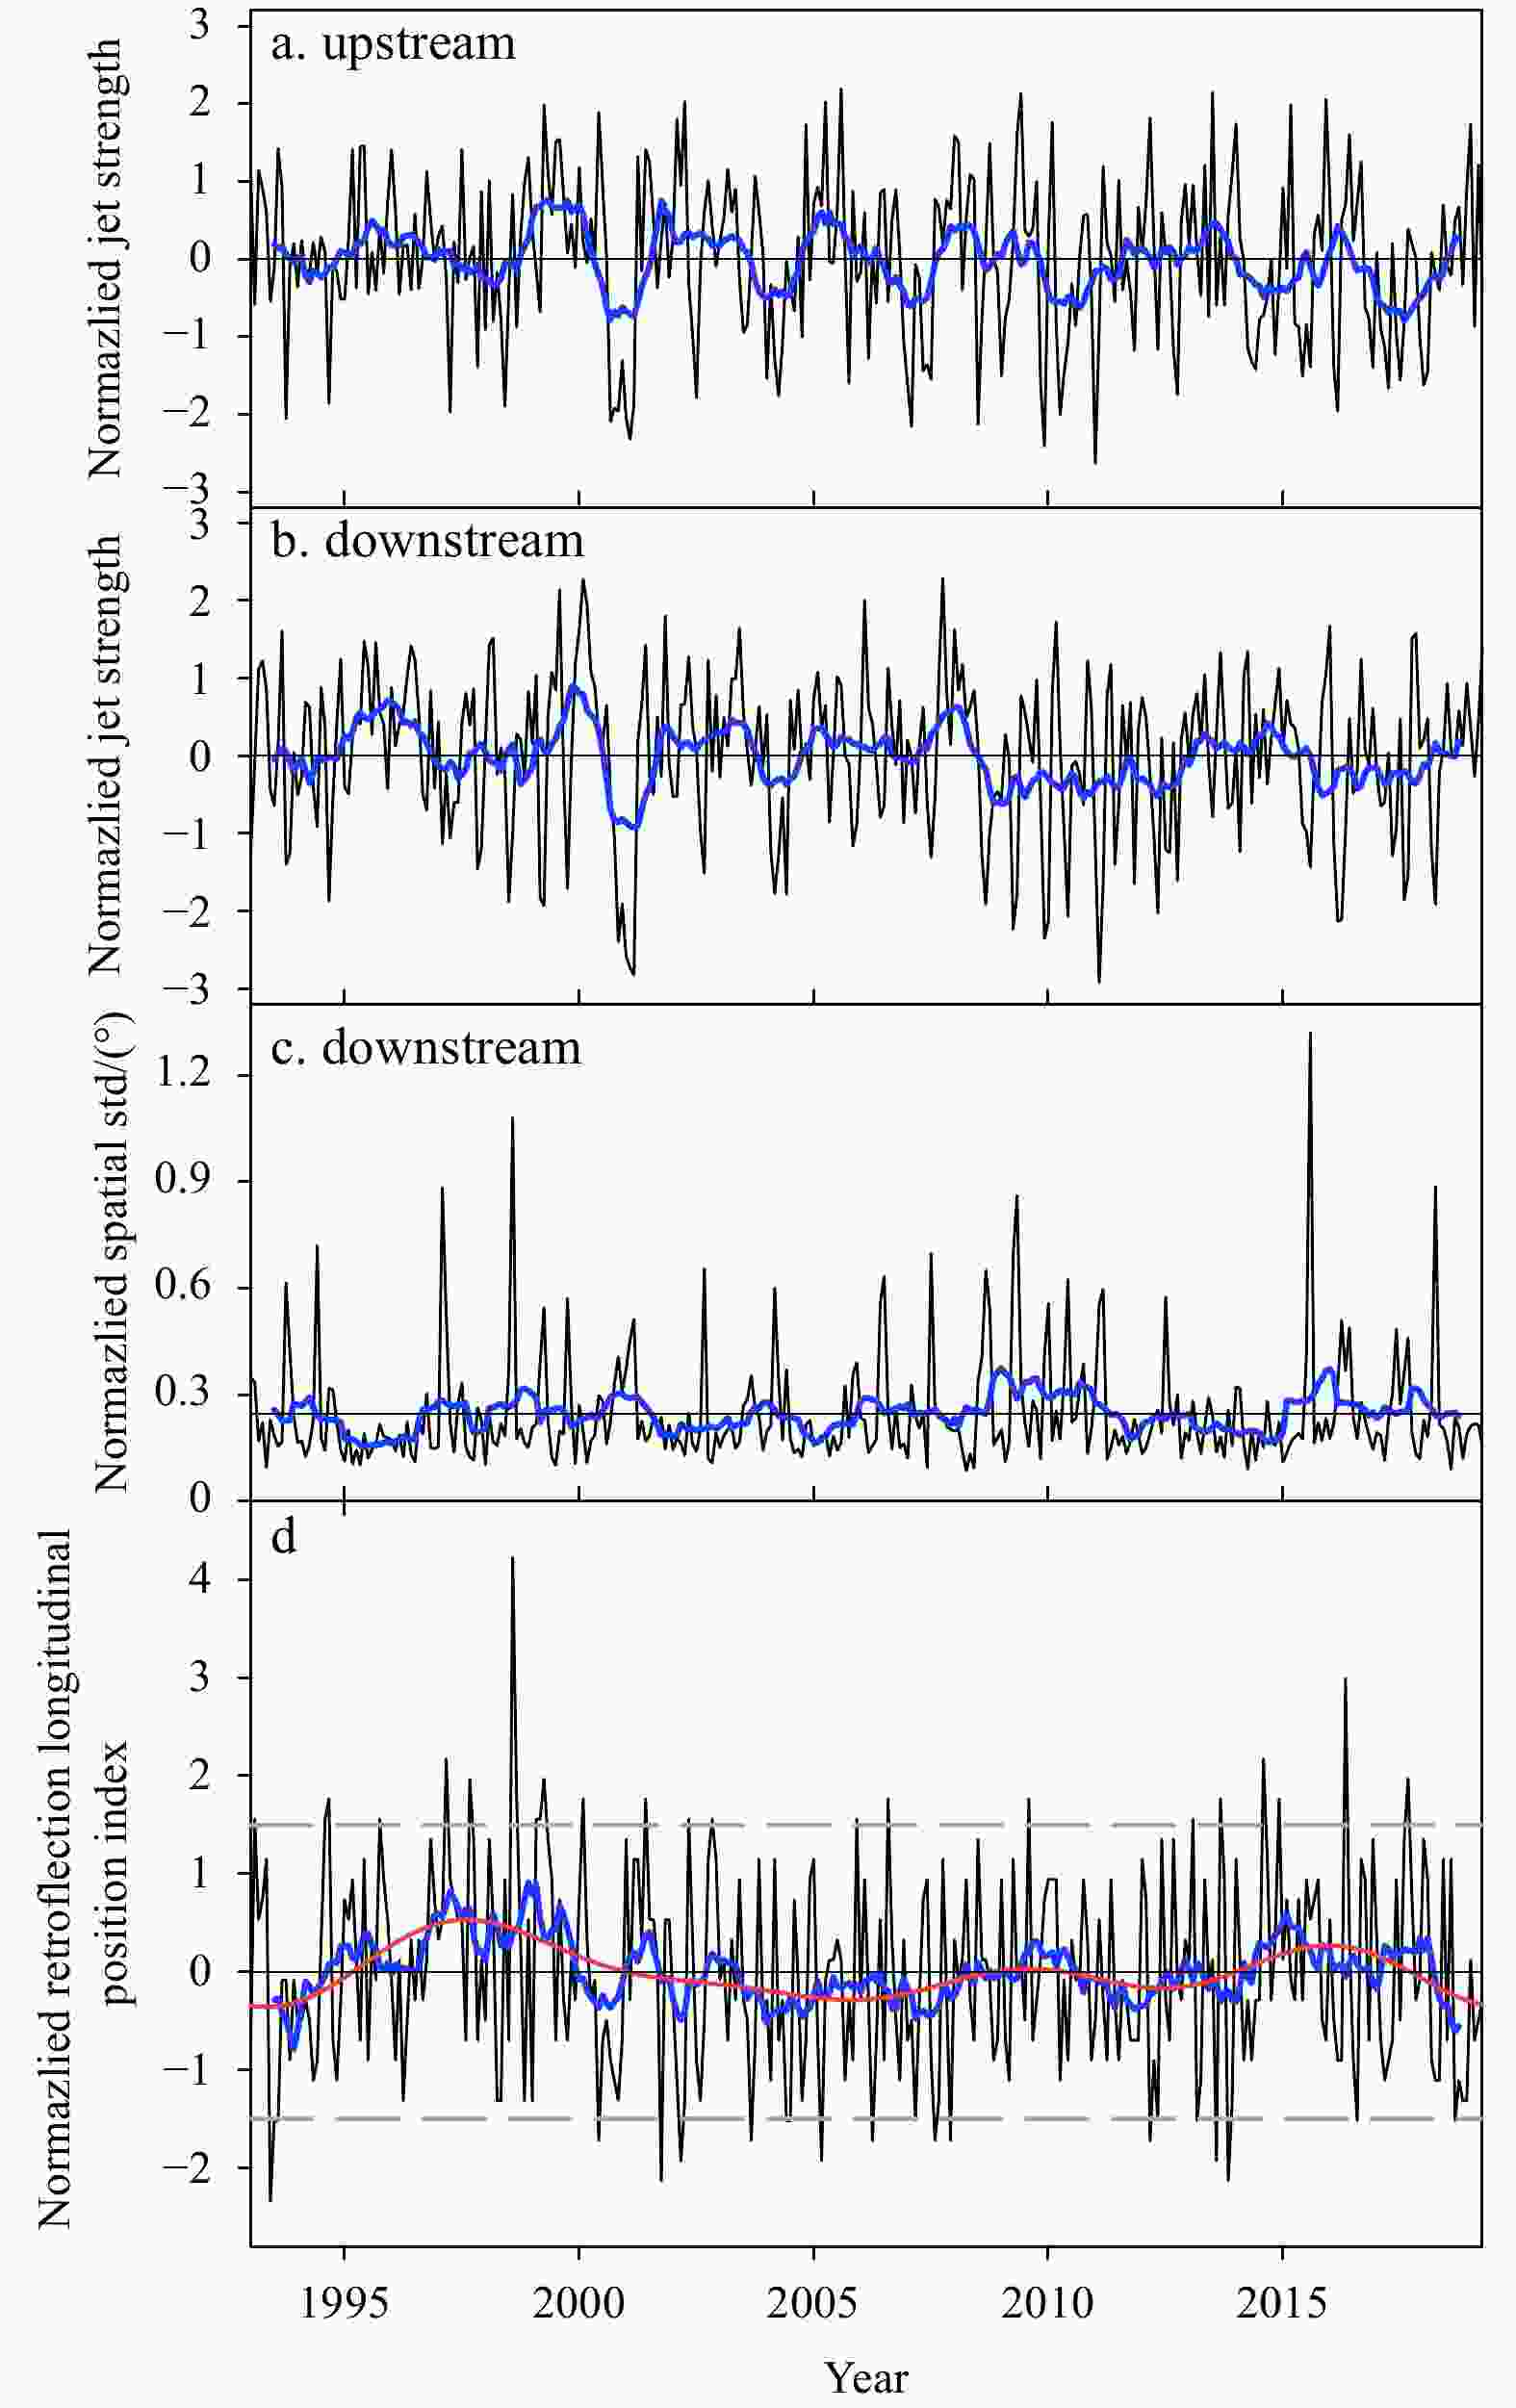
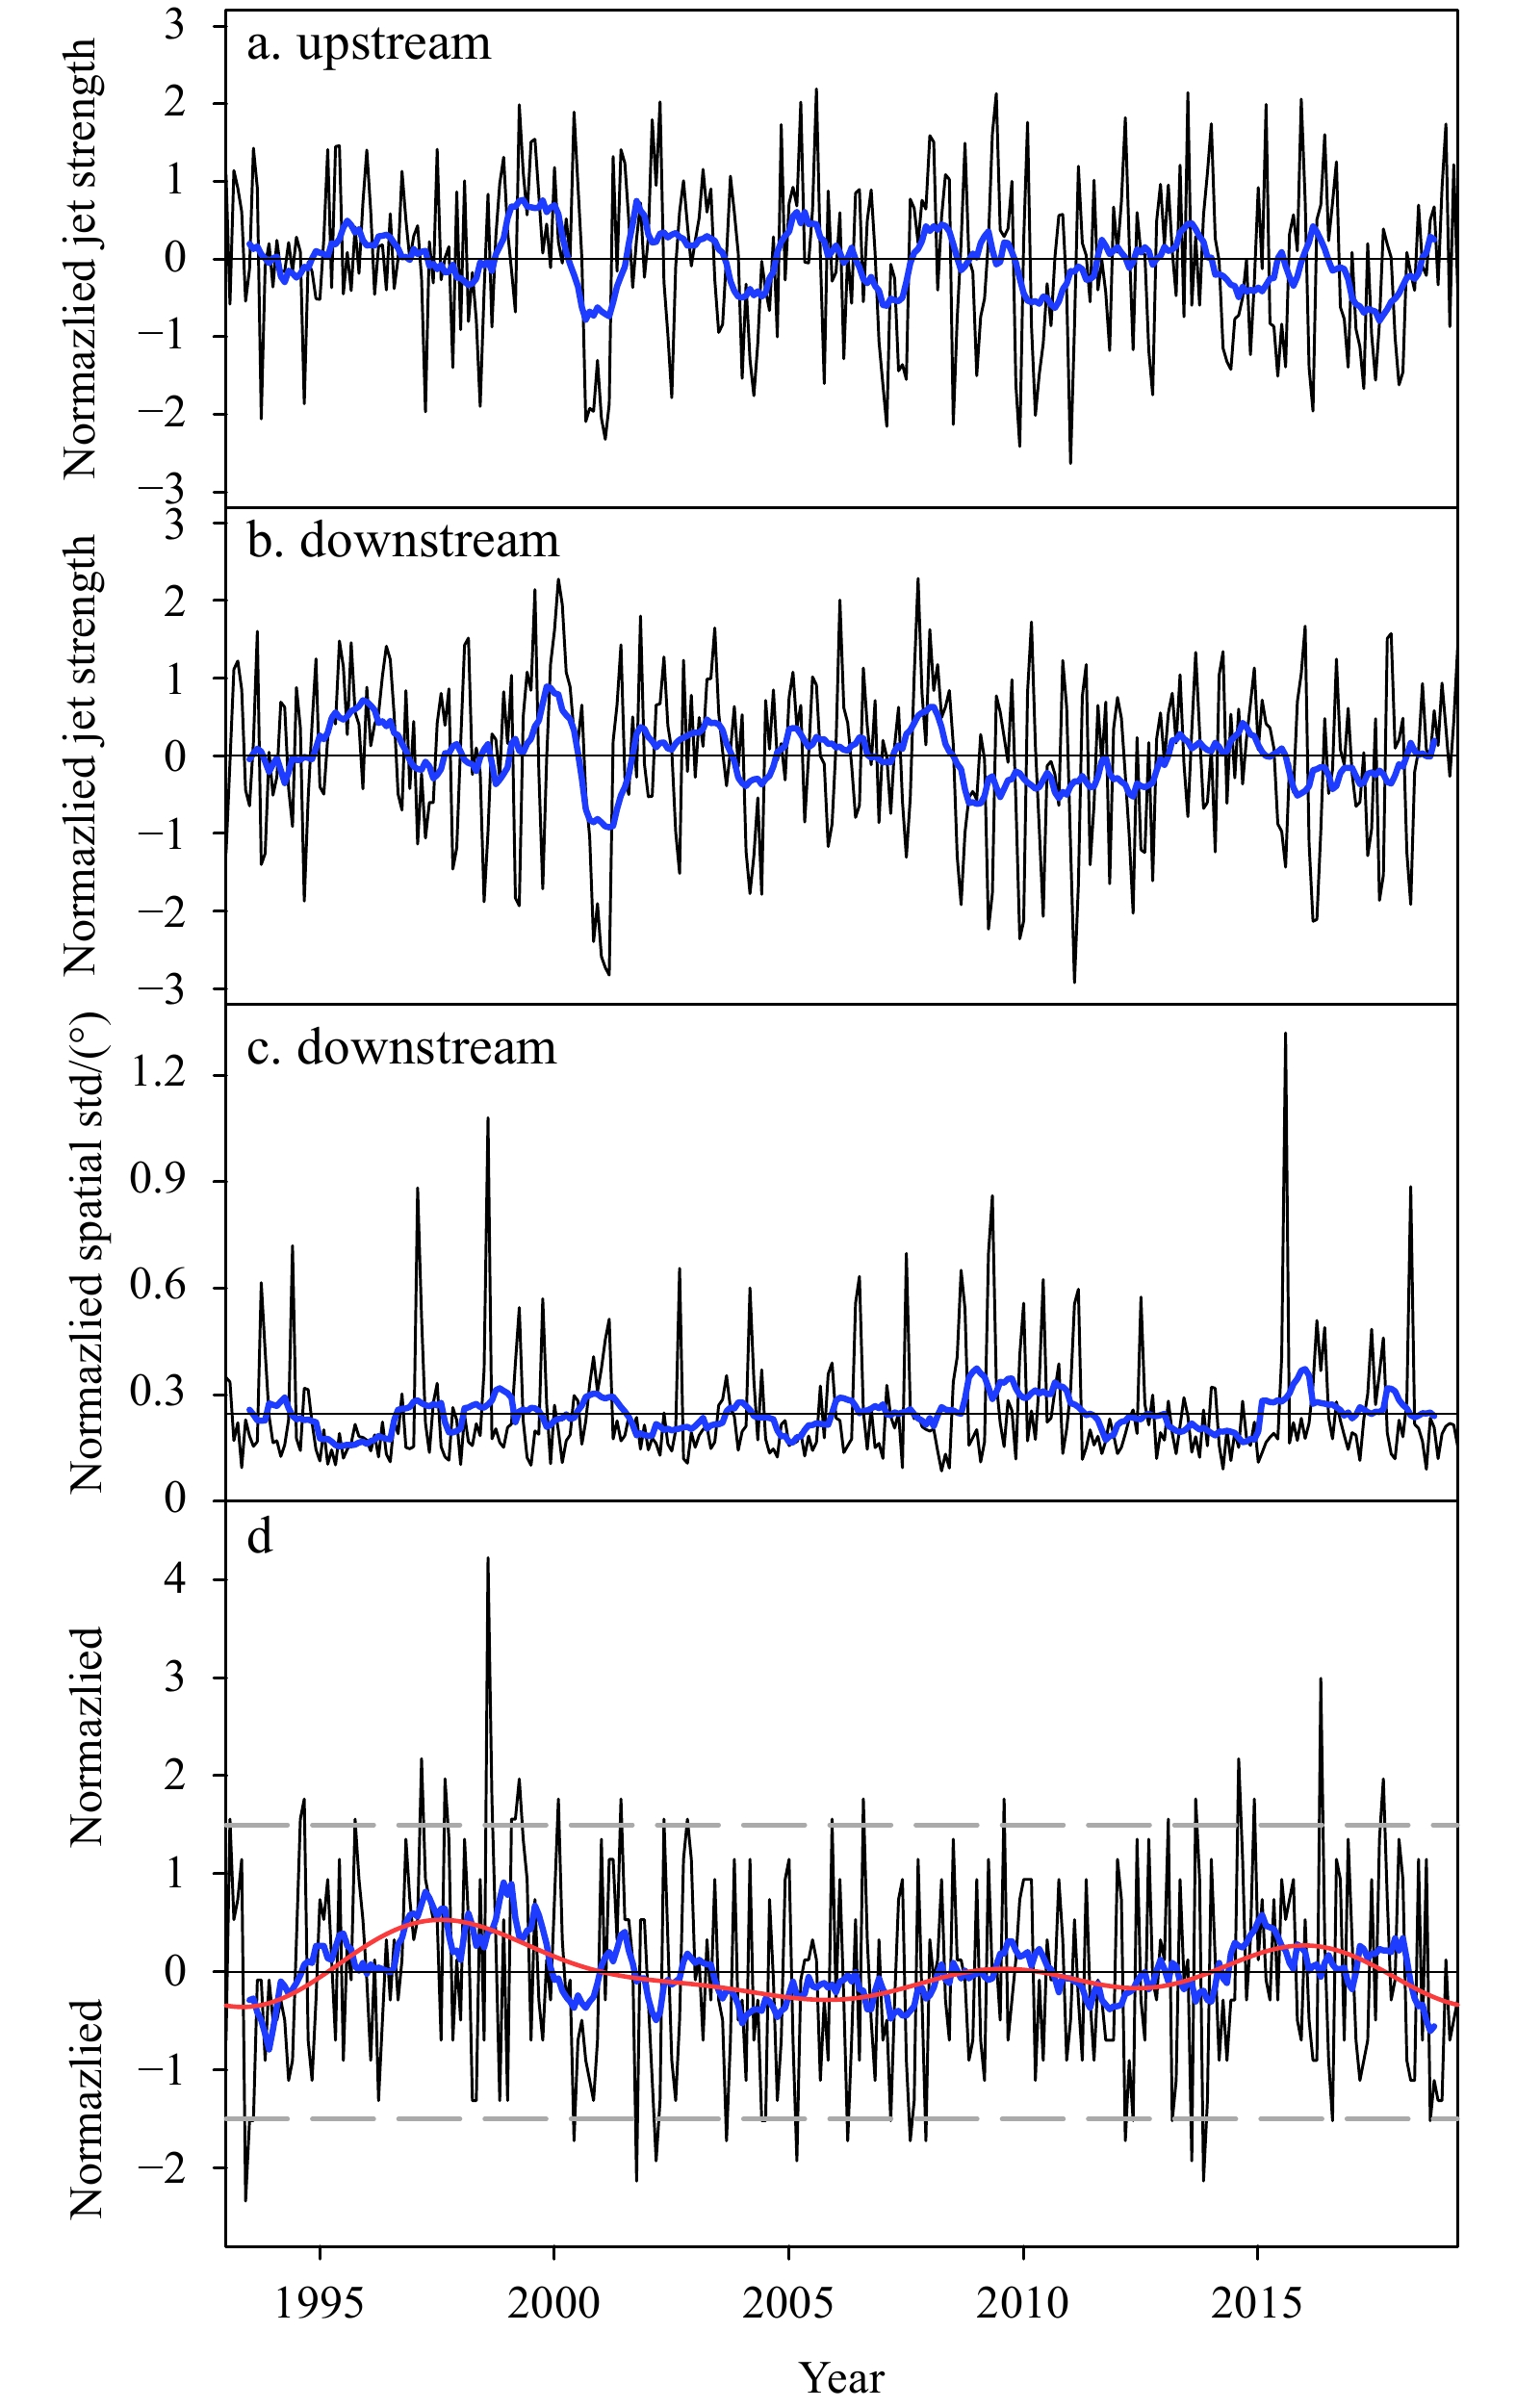
Figure 3. Normazlied monthly time series for various physical factors. a. AC strength integrated along the upstream AC jet path (black line) and its 13-month moving average (blue line). b. Same as a, but integrated along the downstream AC jet path. c. Spatial standard deviation along the downstream jet path, the black and the blue lines represent monthly and 13-month running mean respectively. d Longitudinal displacement of the retroflection point, which is defined as the westernmost longitude of the AC jet path. The black , blue and red lines denote the monthly, the 13-month running mean, and the 5-year low-pass filtered displacements, respectively. The grey dashed lines indicate ±1.5 standard deviations from the mean displacements, which is the thresholds for composite analyses. The normalization of the time series is achieved following the formula
$ i=\dfrac{x-\mu }{\sigma } $ , where$ \mu $ is the climatological mean and$ \sigma $ the standard deviation of$ x $ .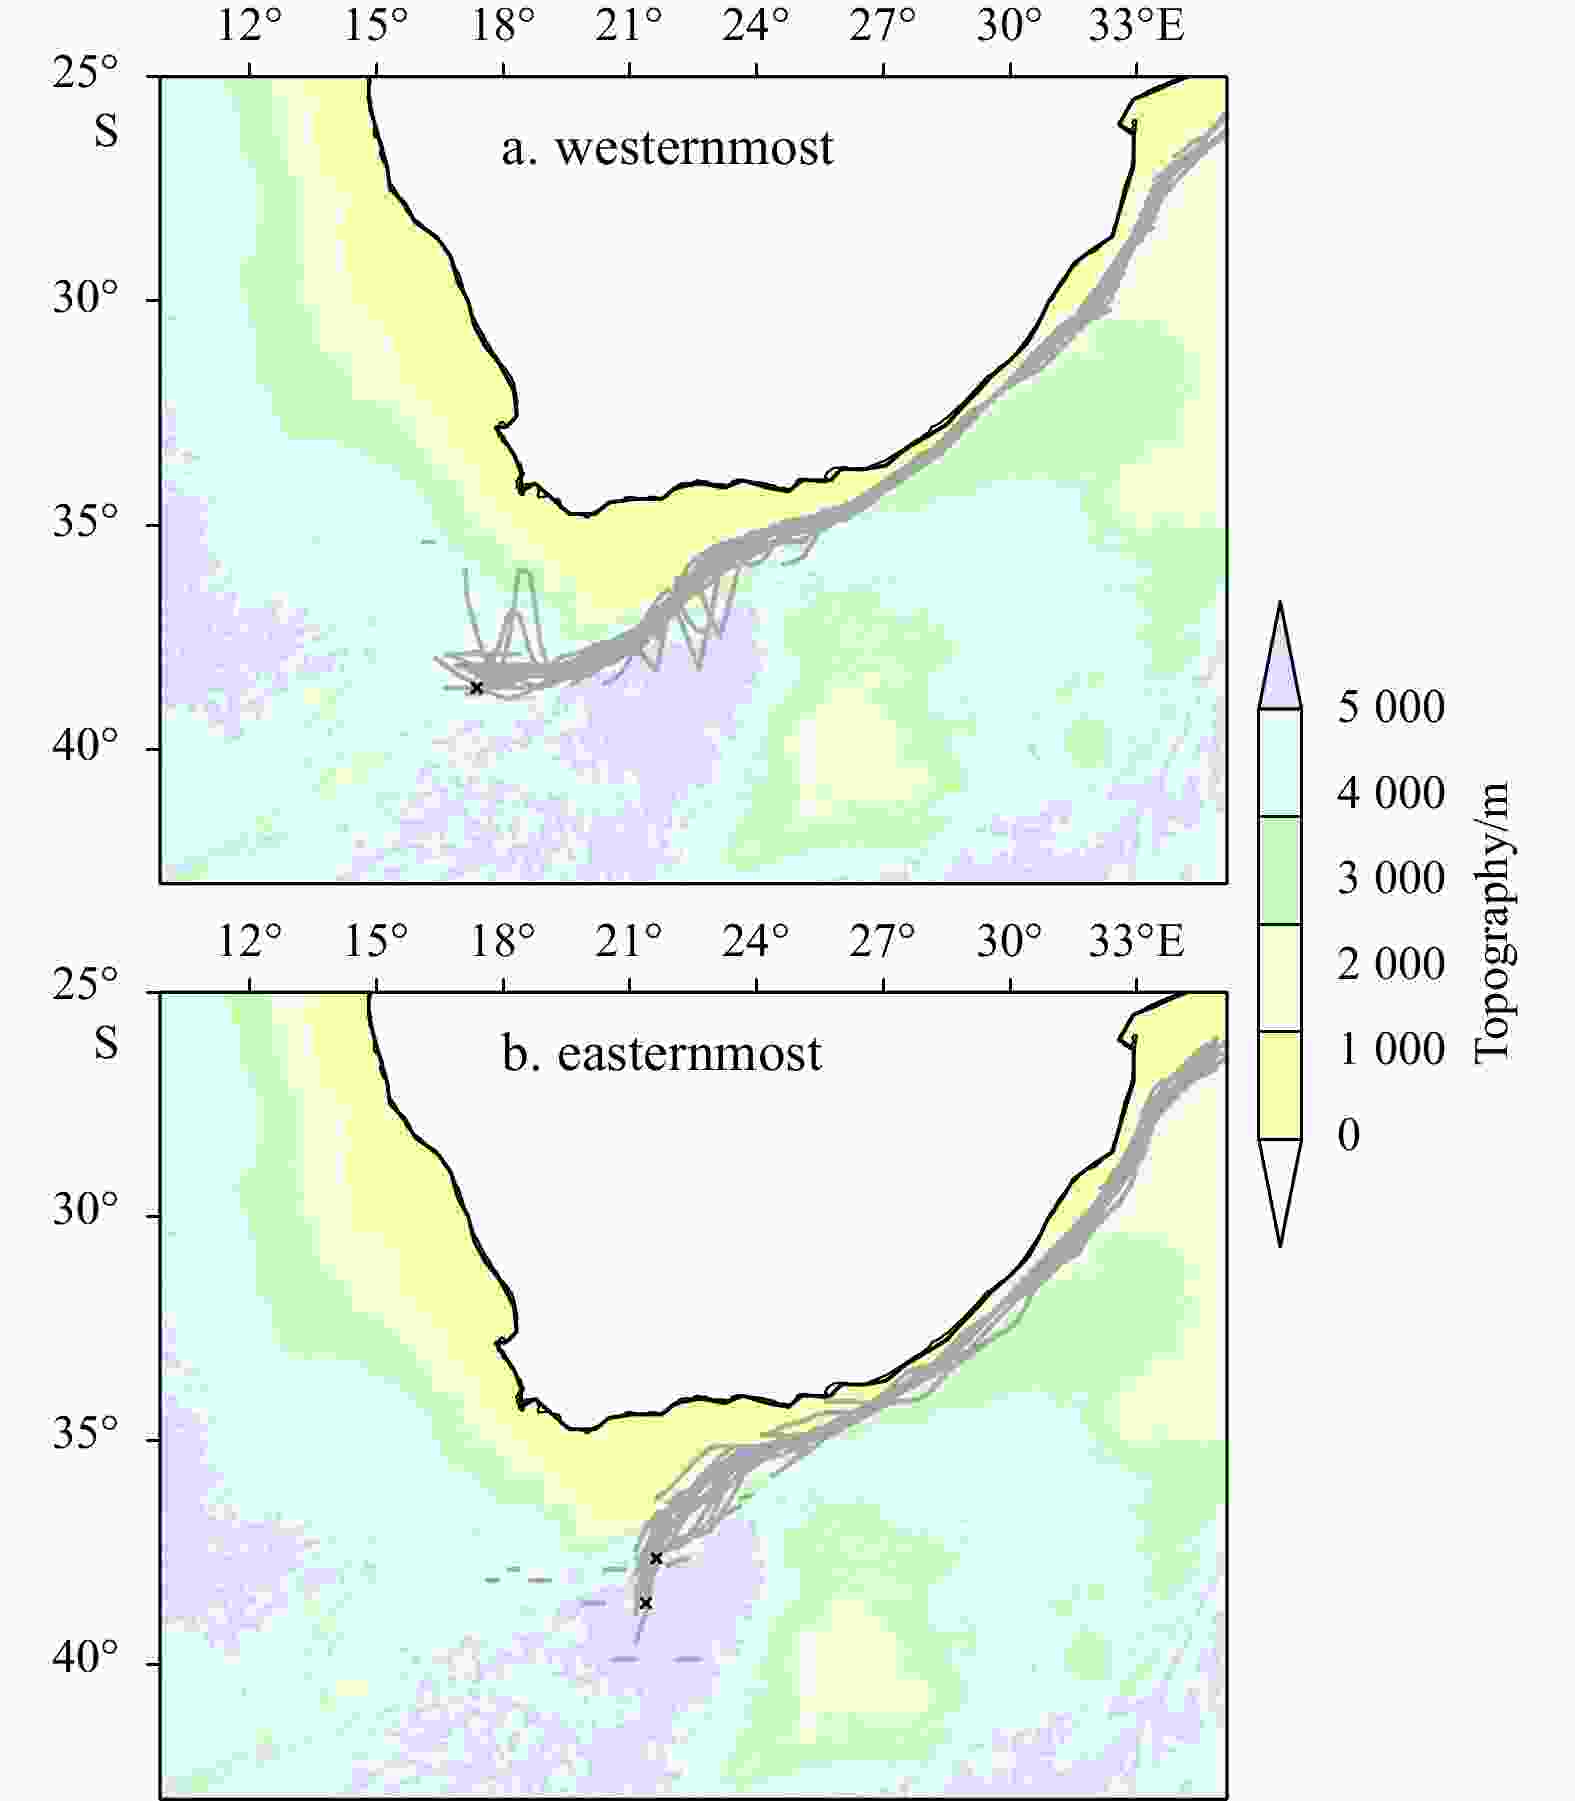
Figure 4. The ETOPO1 bottom topography in colored shadings (unit: m) overlapped with the 21 westernmost jet paths (a) and the 24 easternmost jet paths (b), with ±1.5 standard deviation of the retroflection longitudes as selecting criteria, respectively. The black crosses denote the final retroflection points for each path according to our algorithm.

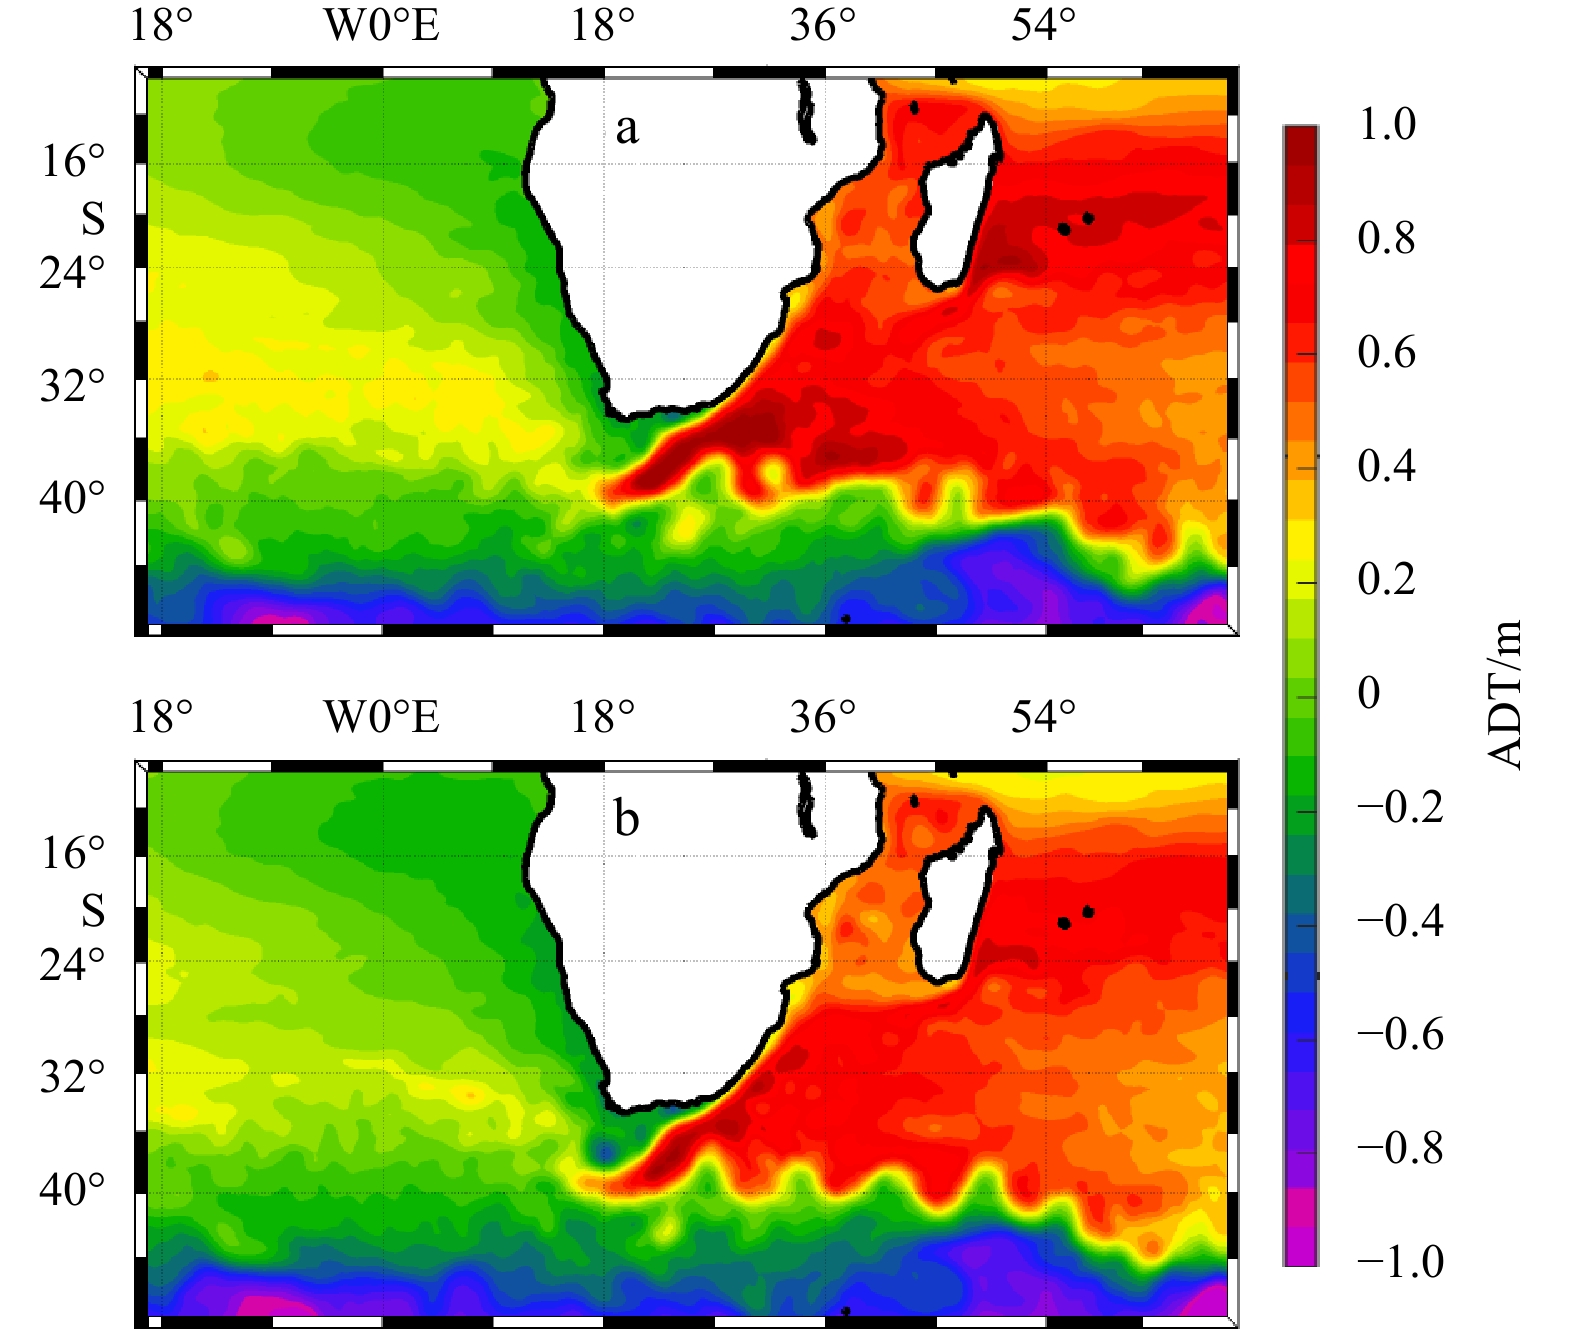
Figure 5. ADT anomalies on the north side are associated with the retroflection position.The composites of the ADT (unit: m) for the 24 most eastward (a) and the 21 most westward (b) retroflection months, and the black vectors denote the corresponding surface velocity. The black rectangular box is approximately where a cyclonic feature coincides with the westward elongation of the AC jet path in the westward composite. c. The blue curve is the 15-d running average of the spatial mean ADT (unit: m) within the black box in a, 45 d before the most eastward retroflection events until 105 d afterwards; and the red curve is the same but referenced to the most westward retroflection events. The grey shading indicates the composited differences between the westward and the eastward retroflection events are significant at the 95% confidence level of t-test.
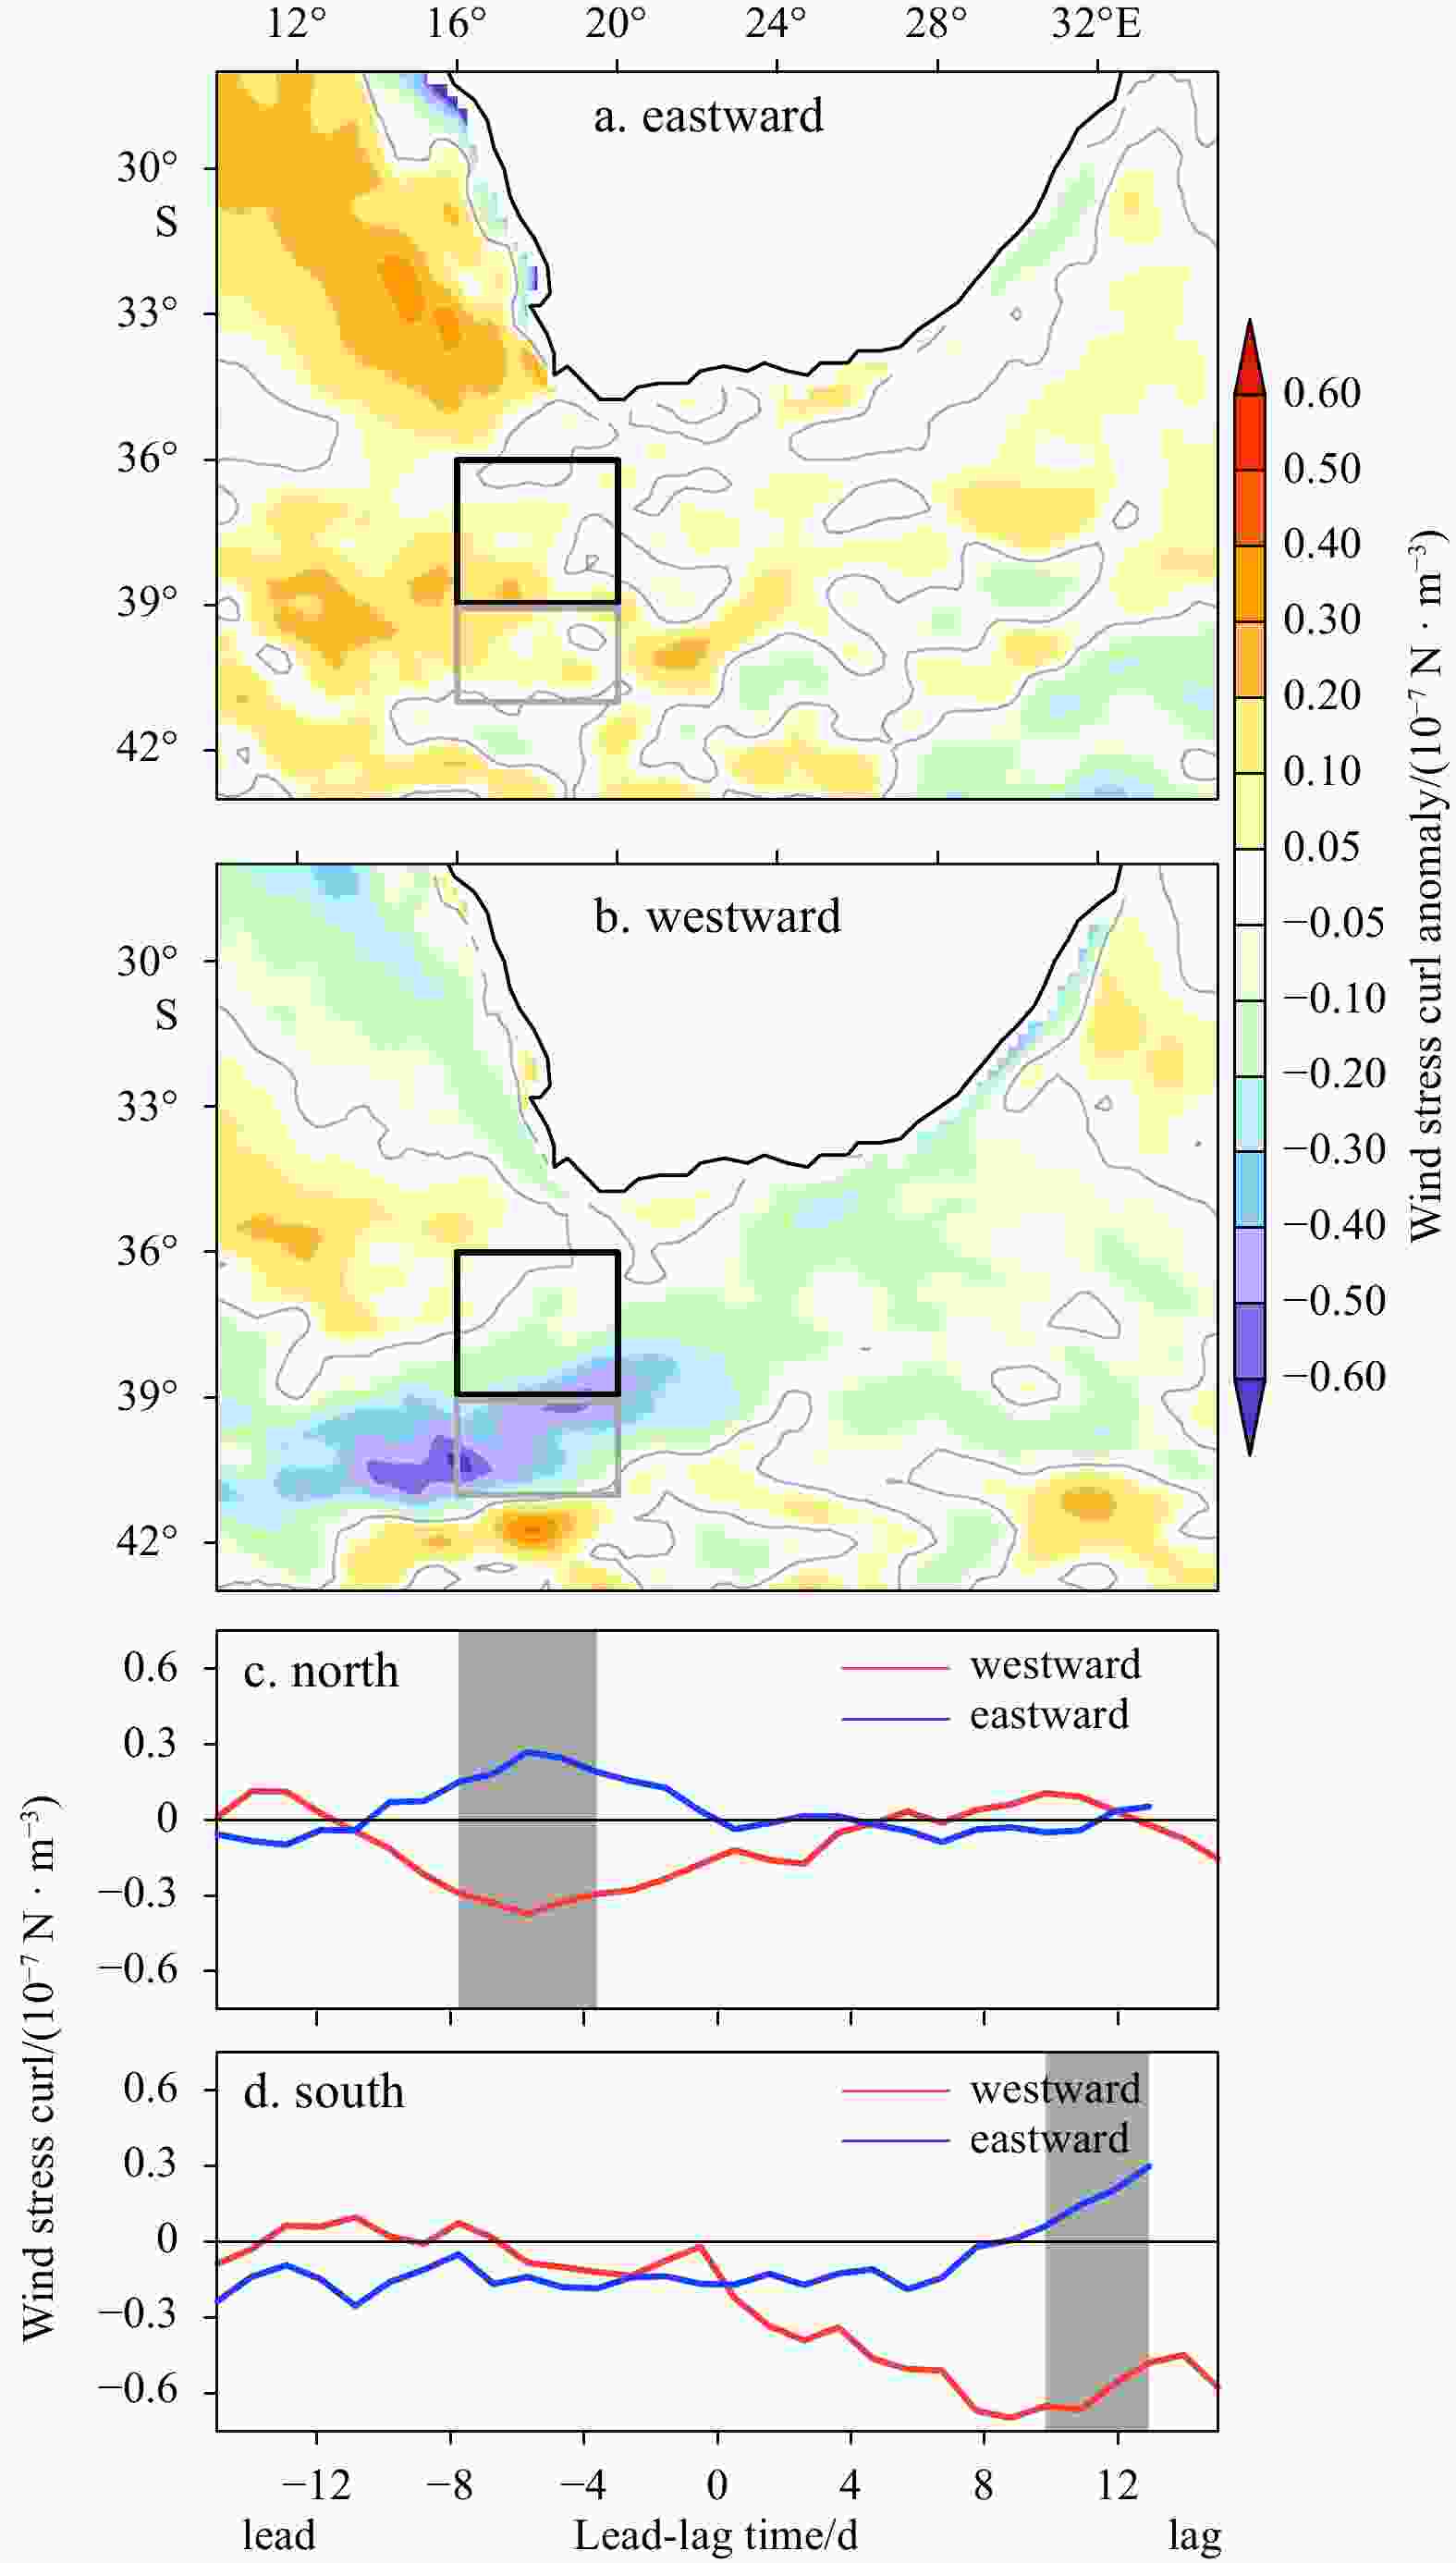
Figure 6. Wind stress curl anomalies at the north flank lead to the retroflection position shift. a. The wind stress curl anomalies (unit: 10-7 N/m3) corresponding to the composite of the 24 most eastward retroflection events. b.Same as (a) but composite of the 21 most westward retroflection events. The black rectangular is the same as in Fig. 5b, and the grey box is chosen to represent an area of maximal negative wind stress curl anomaly. c. 15-d moving average of the spatial mean wind stress curl in the black rectangular box to the north, from 15 d before the event till 15 d afterwards. d. Same as c but for the mean wind stress curl in the grey box to the south. The grey shading indicates the composited differences between the westward and the eastward retroflection events are significant at the 95% confidence level of t-test.
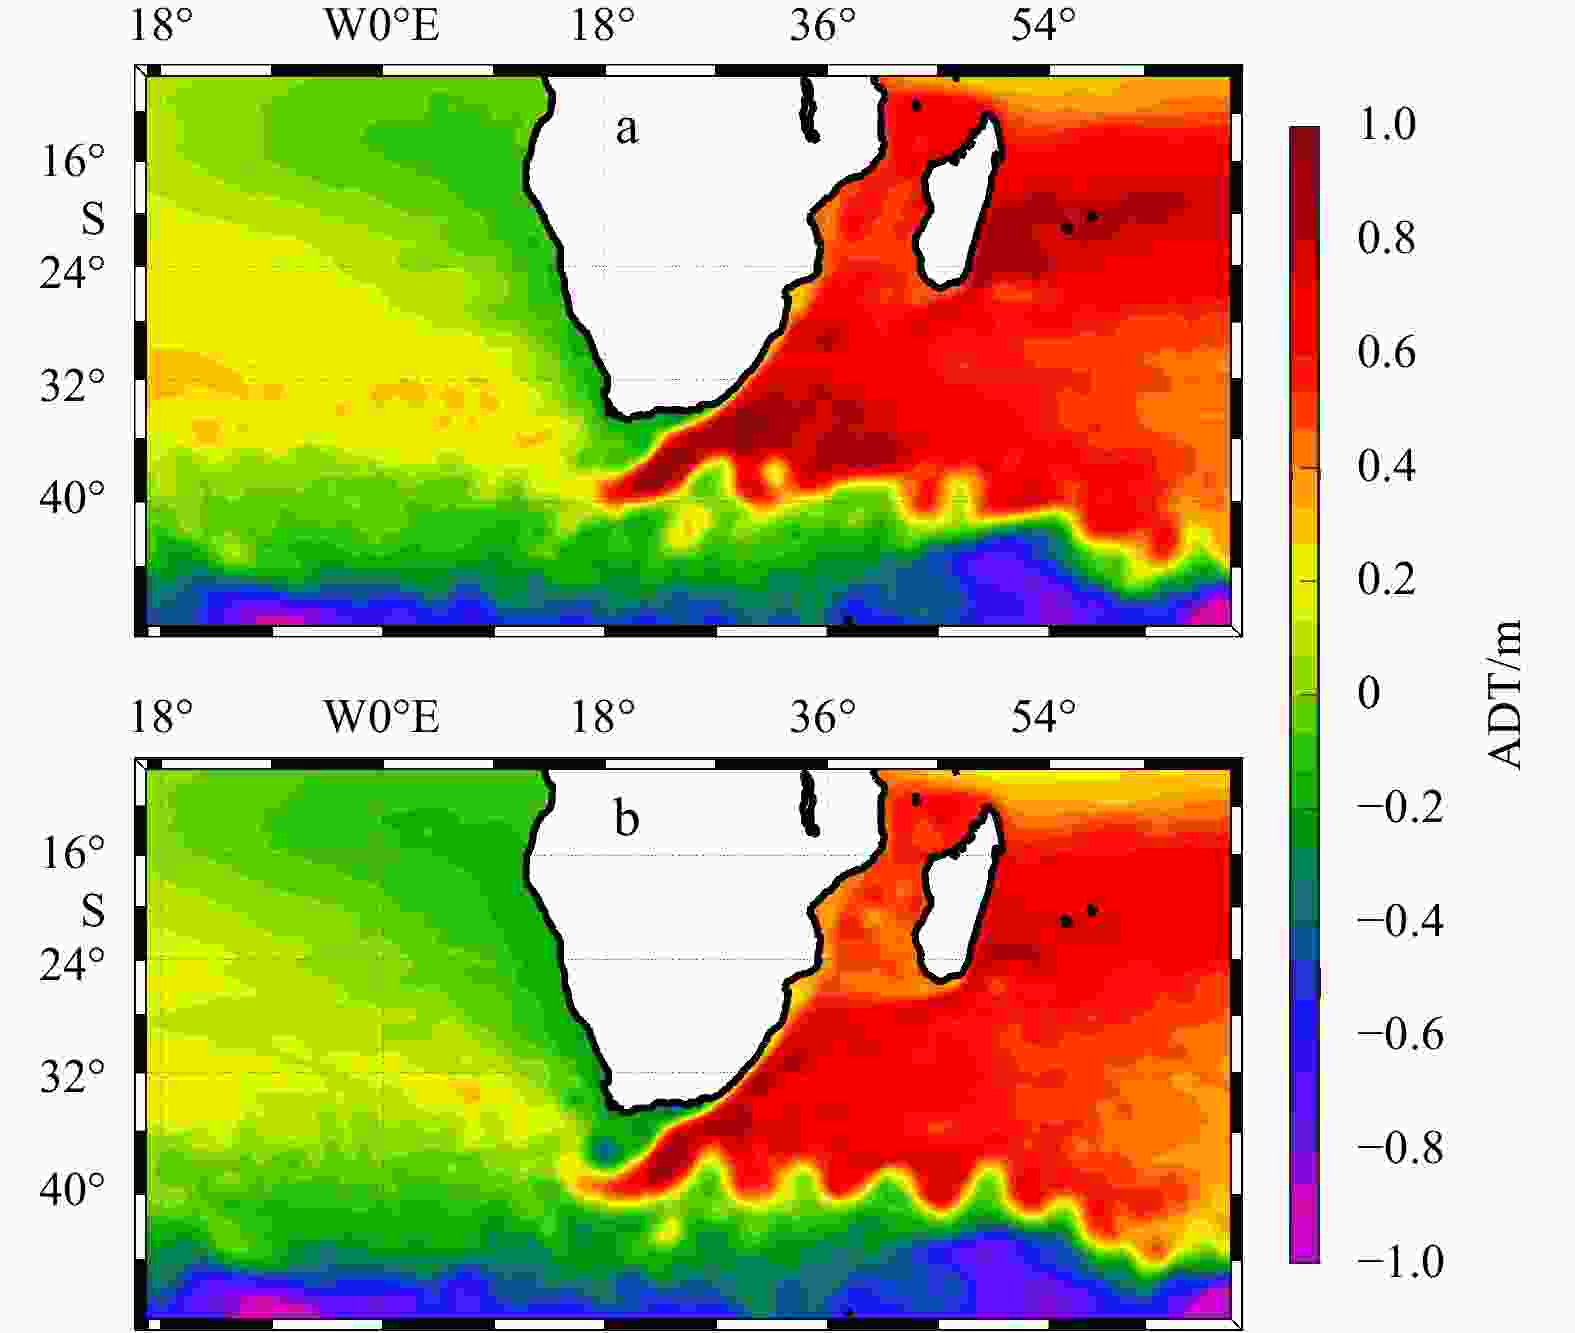
Figure 7. The mean ADT derived from altimetry data (unit: m) in 2017 (a) and 2002 (b). Notice the cyclone to the north of the retroflection point in 2002.

Figure 8. Configurations of the wind forcing for numerical experiments. The anomaly of the ERA5 wind stress curl and 10 m wind stress vector in 2017 (a) and 2002 (b), referenced to the 1979 to 2019 climatology. The difference between a and b is shown in c. d. Non-dimensional weighting function, which will be multiplied to the wind stress difference (2002–2017) and then added to the case1 forcing to produce the perturbed run (Case 2). The cyan box is the same as the black box in Fig. 6a and 6b, and the dark and light green contours represent the mean SSH to indicate the retroflection position for the year of 2017 and 2002 respectively.
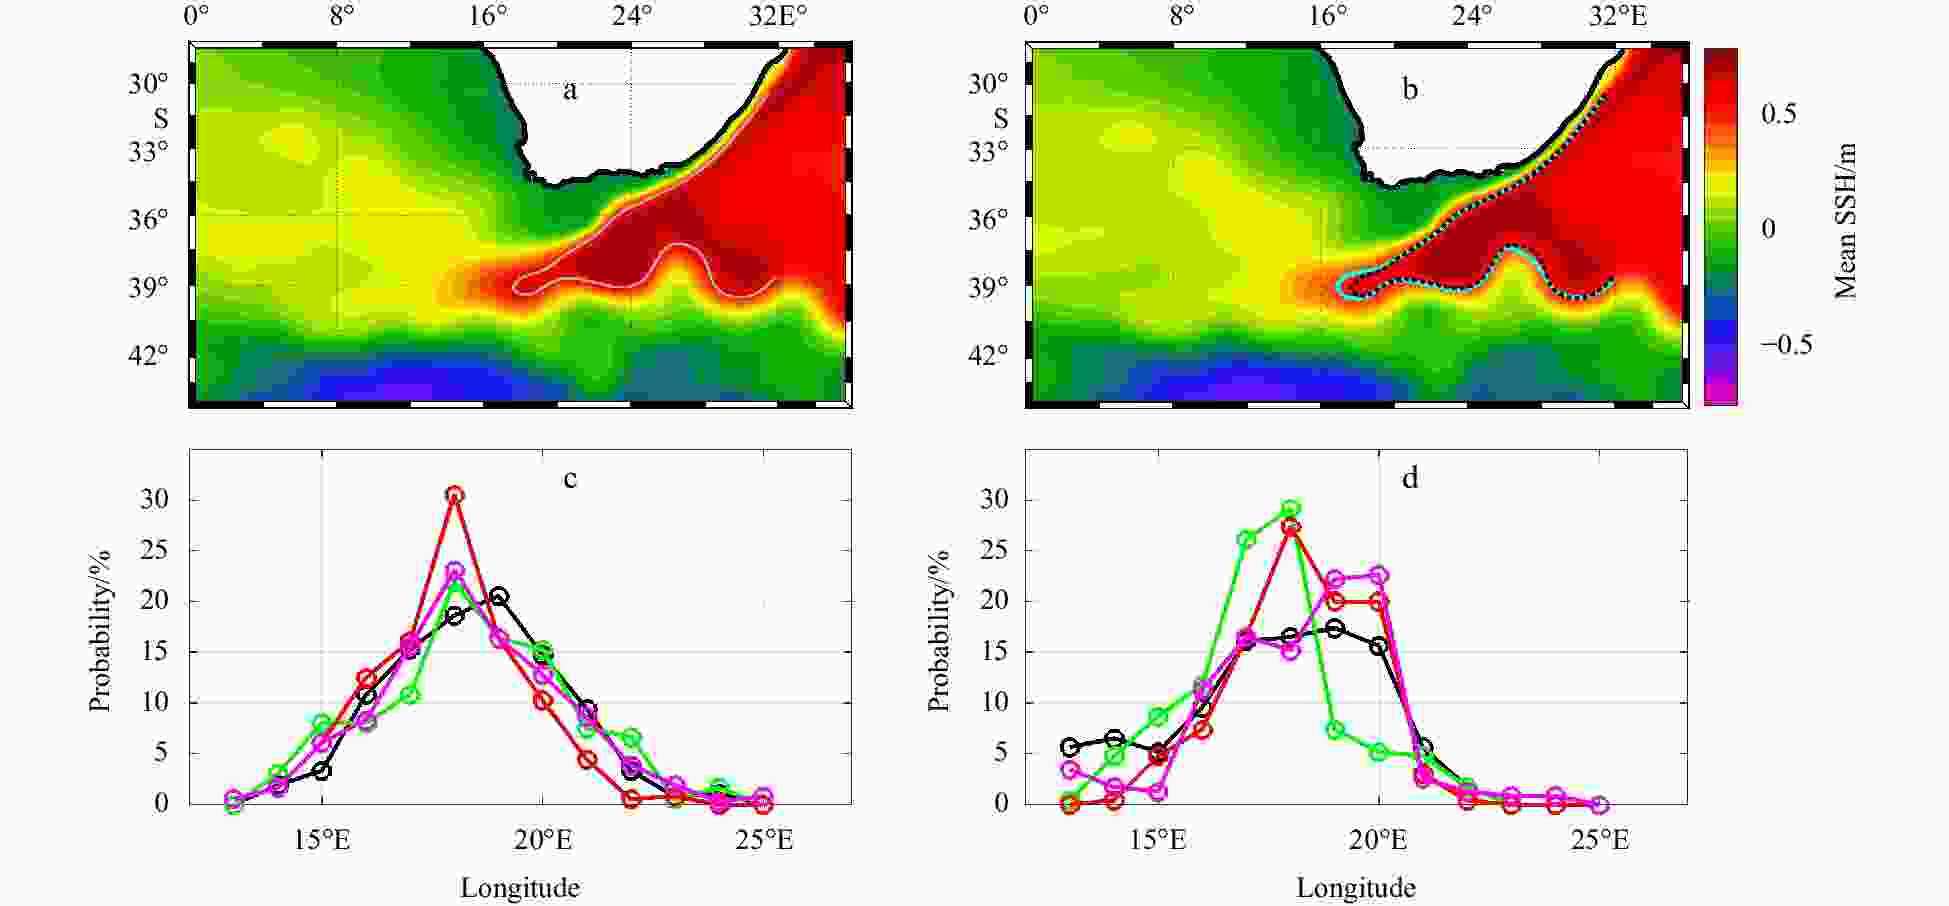
Figure 9. Modeled longitudinal position of the retroflection. Mean SSH (unit: m) in the retroflection area from control run forced by 2017 mean wind stress (a) and the ensemble of the 3 perturbed runs forced by 2017 wind stress (b) plus a local 2002 anomaly around the retroflection area.The black dashed curve represents the 0.5 m SSH isoline for the control run, and the cyan curve represents the 0.5 m SSH isoline for the ensembled perturbed runs. c. the probability distribution of the retroflection longitudes for the first 3 model years, the black curve and circles represent the control run, while the magenta, the green and the red represent the 3 perturbed runs. d. Same as c, but the result from the latter 2 model years.

Figure 10. Time evolution of Agulhas ring shedding process for the westward retroflection events. The composite of 15-d mean ADT leading to extreme westward retroflection events (unit: m). a. Mean ADT over the period 30 d to 15 d before the extreme eastward retroflection events. b and c. Same as a, but from 22 d to 7 d, and 15 d to 0 d before the extreme westward retroflection events respectively. d. Mean ADT from 8 d before the event to 7 d after the event. e and f. Same as d, but for the mean ADT from the day of the event to 15 d afterwards, and from 16 d to 23 d after the event respectively. Red solid contours include areas of negative ADT value. Black dashed lines indicate the 0.7 m ADT value, which has been usually used to estimate the retroflection position.
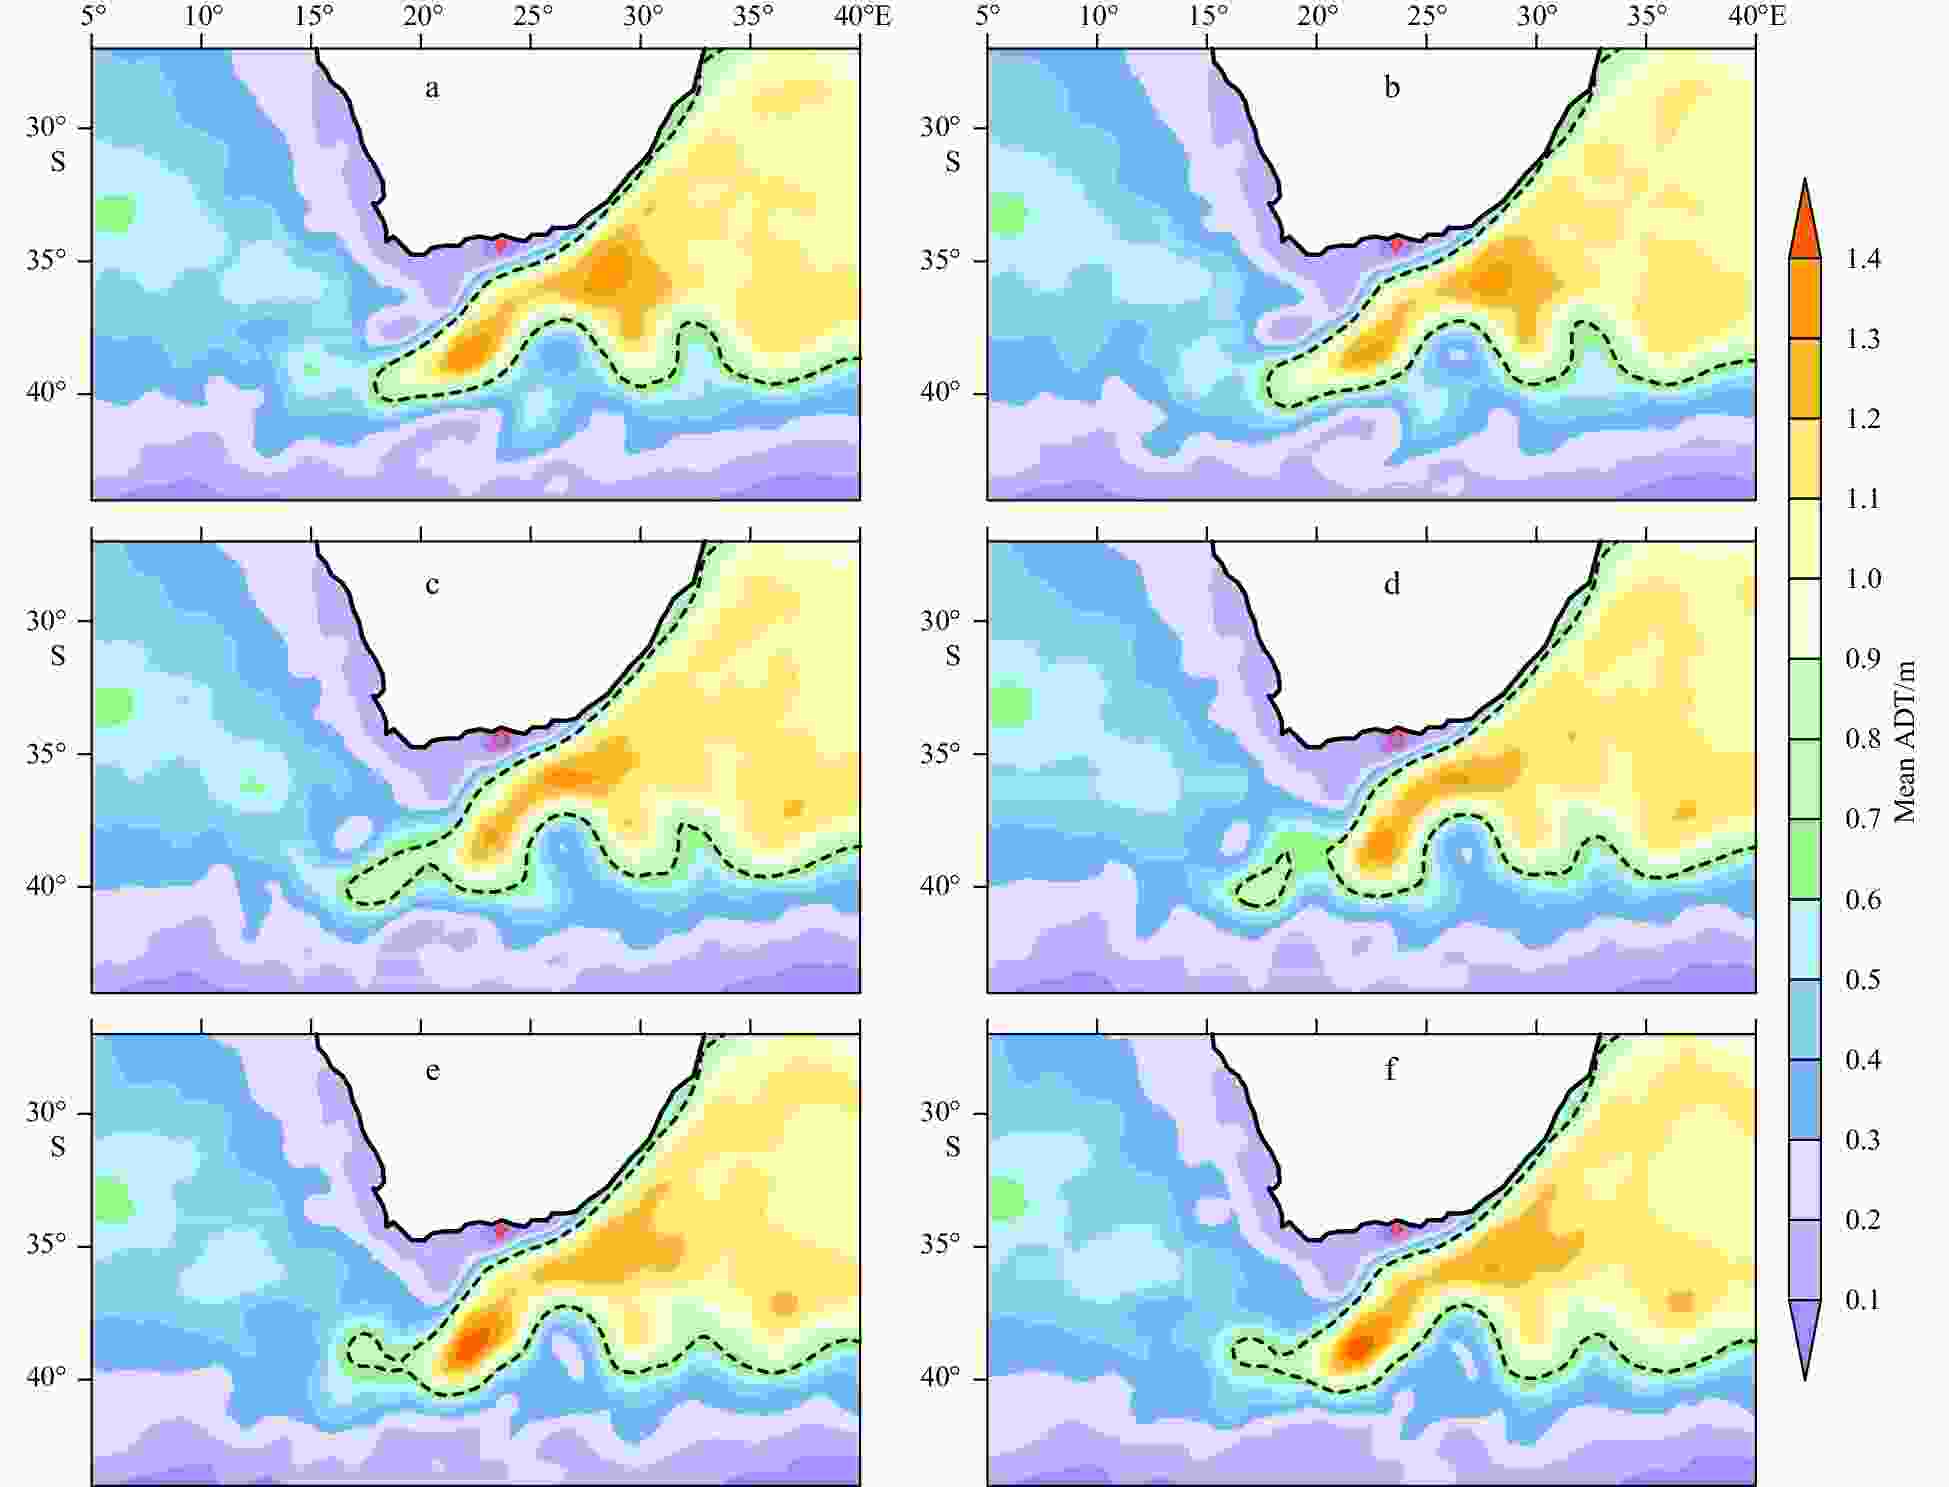
Figure 11. Time evolution of Agulhas ring shedding process for the eastward retroflection events. The composite of 15-d mean ADT leading to extreme eastward retroflection events (unit: m). a. Mean ADT over the period 30 to 15 d before the extreme eastward retroflection events. b and c. Same as a, but from 22 to 7 d, and 15 to 0 d before the extreme westward retroflection events respectively. d. Mean ADT from 8 d before the event to 7 d after the event. e and f. Same as d, but for the mean ADT from the day of the event to 15 d afterwards, and from 16 d to 23 d after the event respectively. Red solid contours include areas of negative ADT value. Black dashed lines indicate the 0.7 m ADT value, which has been usually used to estimate the retroflection position.
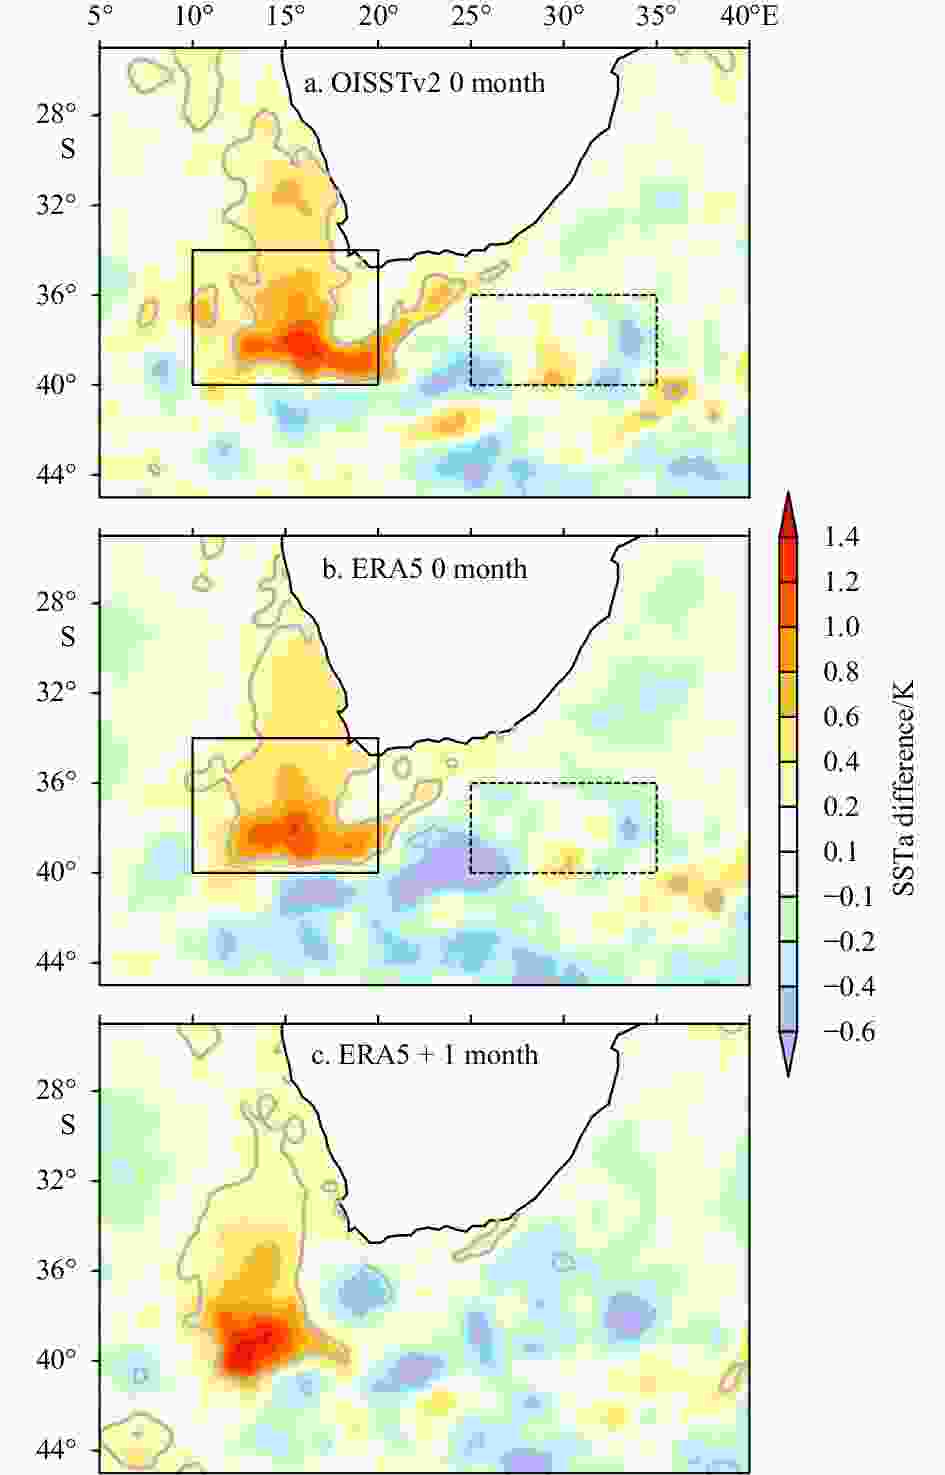
Figure 12. Westward retroflection leads to warming in the South Atlantic (SA) and cooling in the Indian Ocean (OI), corresponding to the enhanced Agulhas leakage. Composited monthly SSTa differences between the westward and the eastward retroflection events from OISST dataset (a) and EAR5 dataset (b). c. Same as b, but with SSTa lag retroflection events for one month. The grey contours include the areas where the differences are significant at 95% confidence level of t-test. The black solid and dashed rectangular boxes denote the South Atlantic region and the Indian Ocean region, respectively.
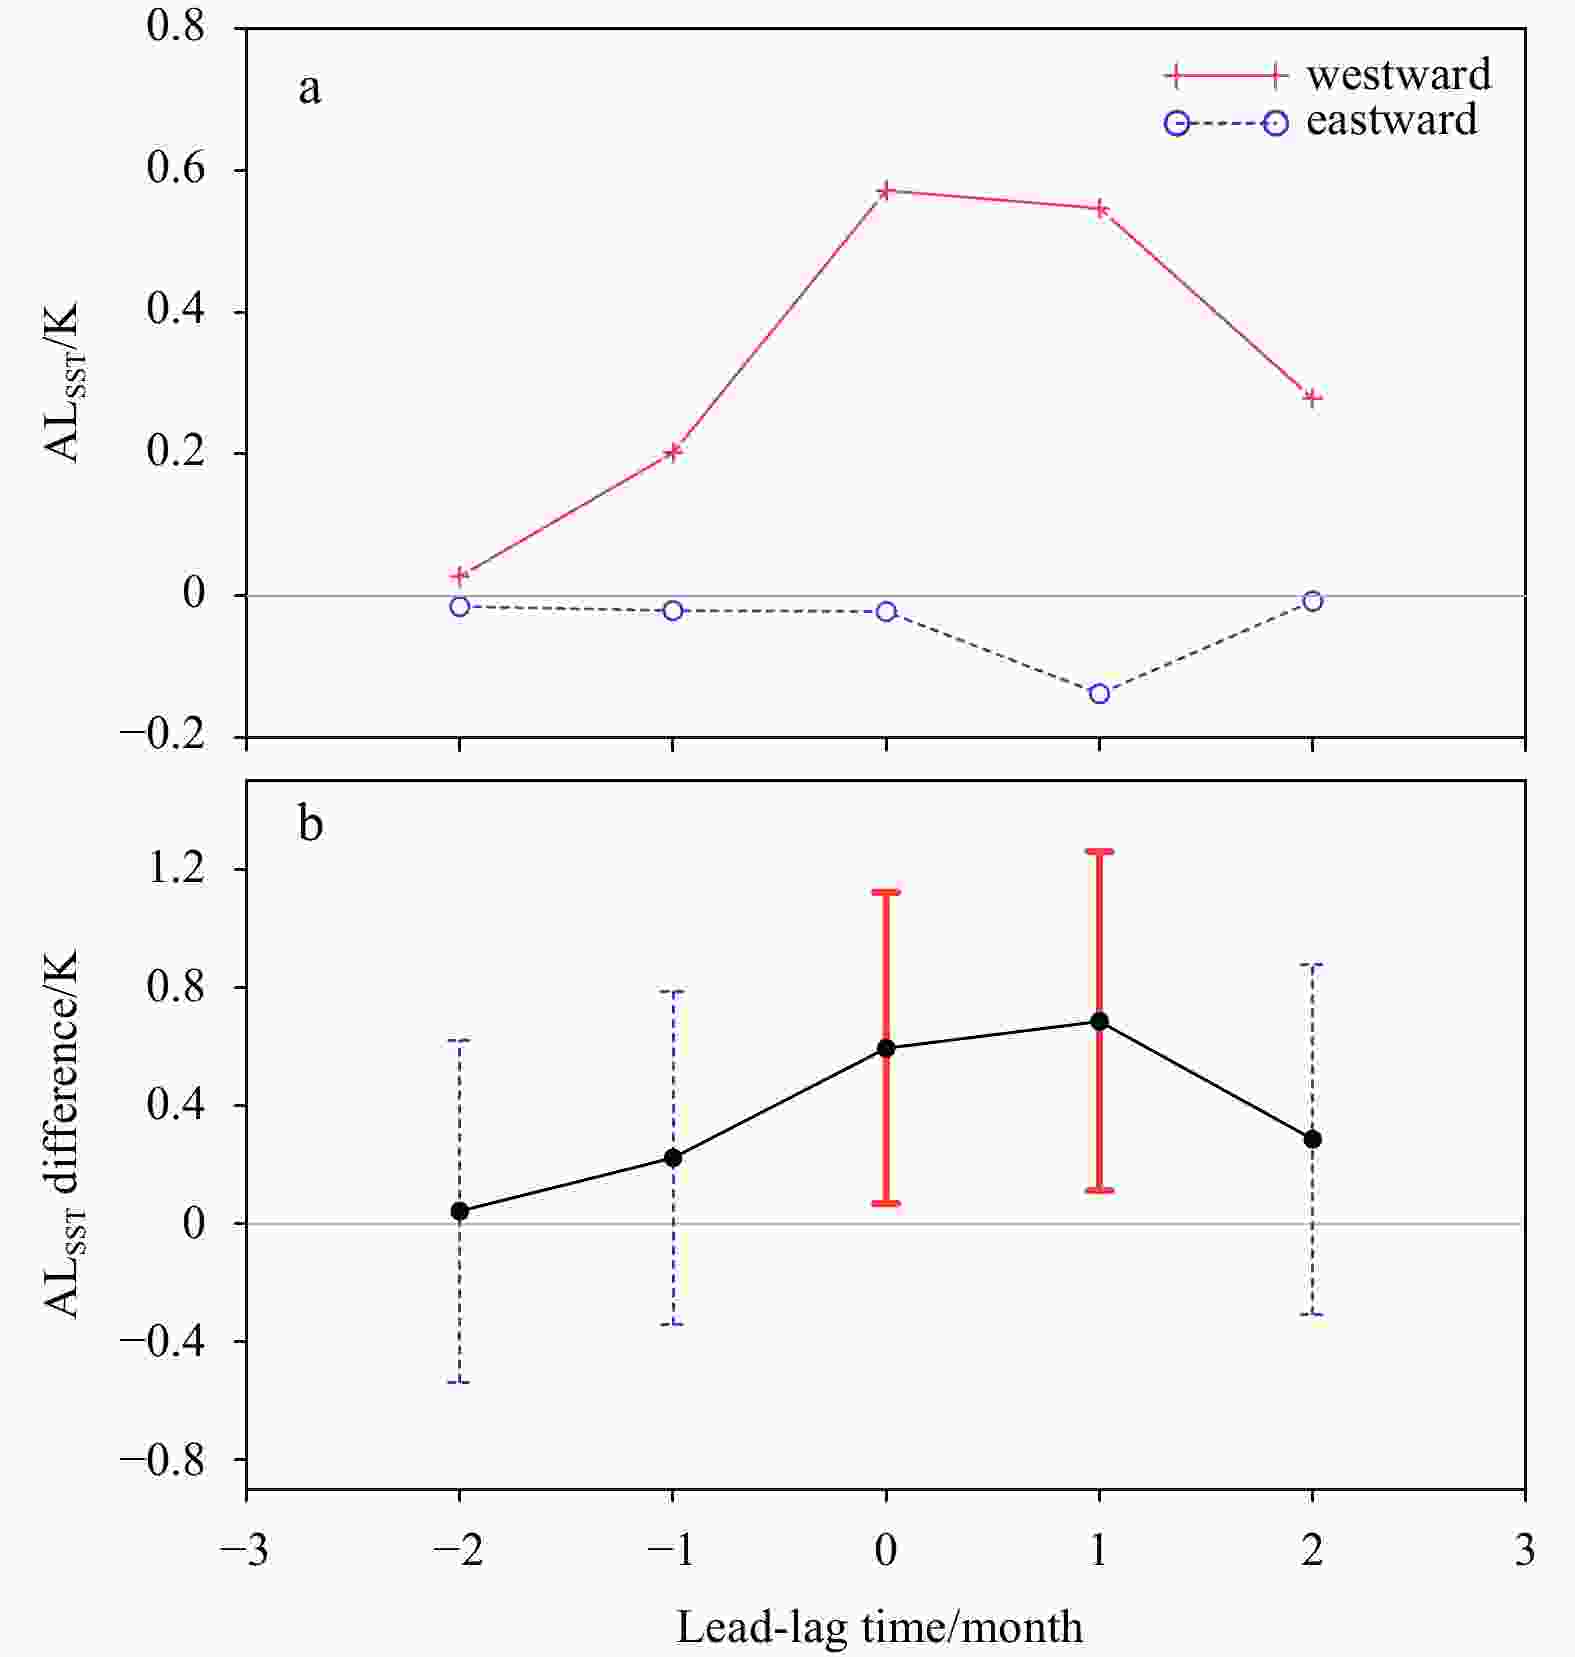
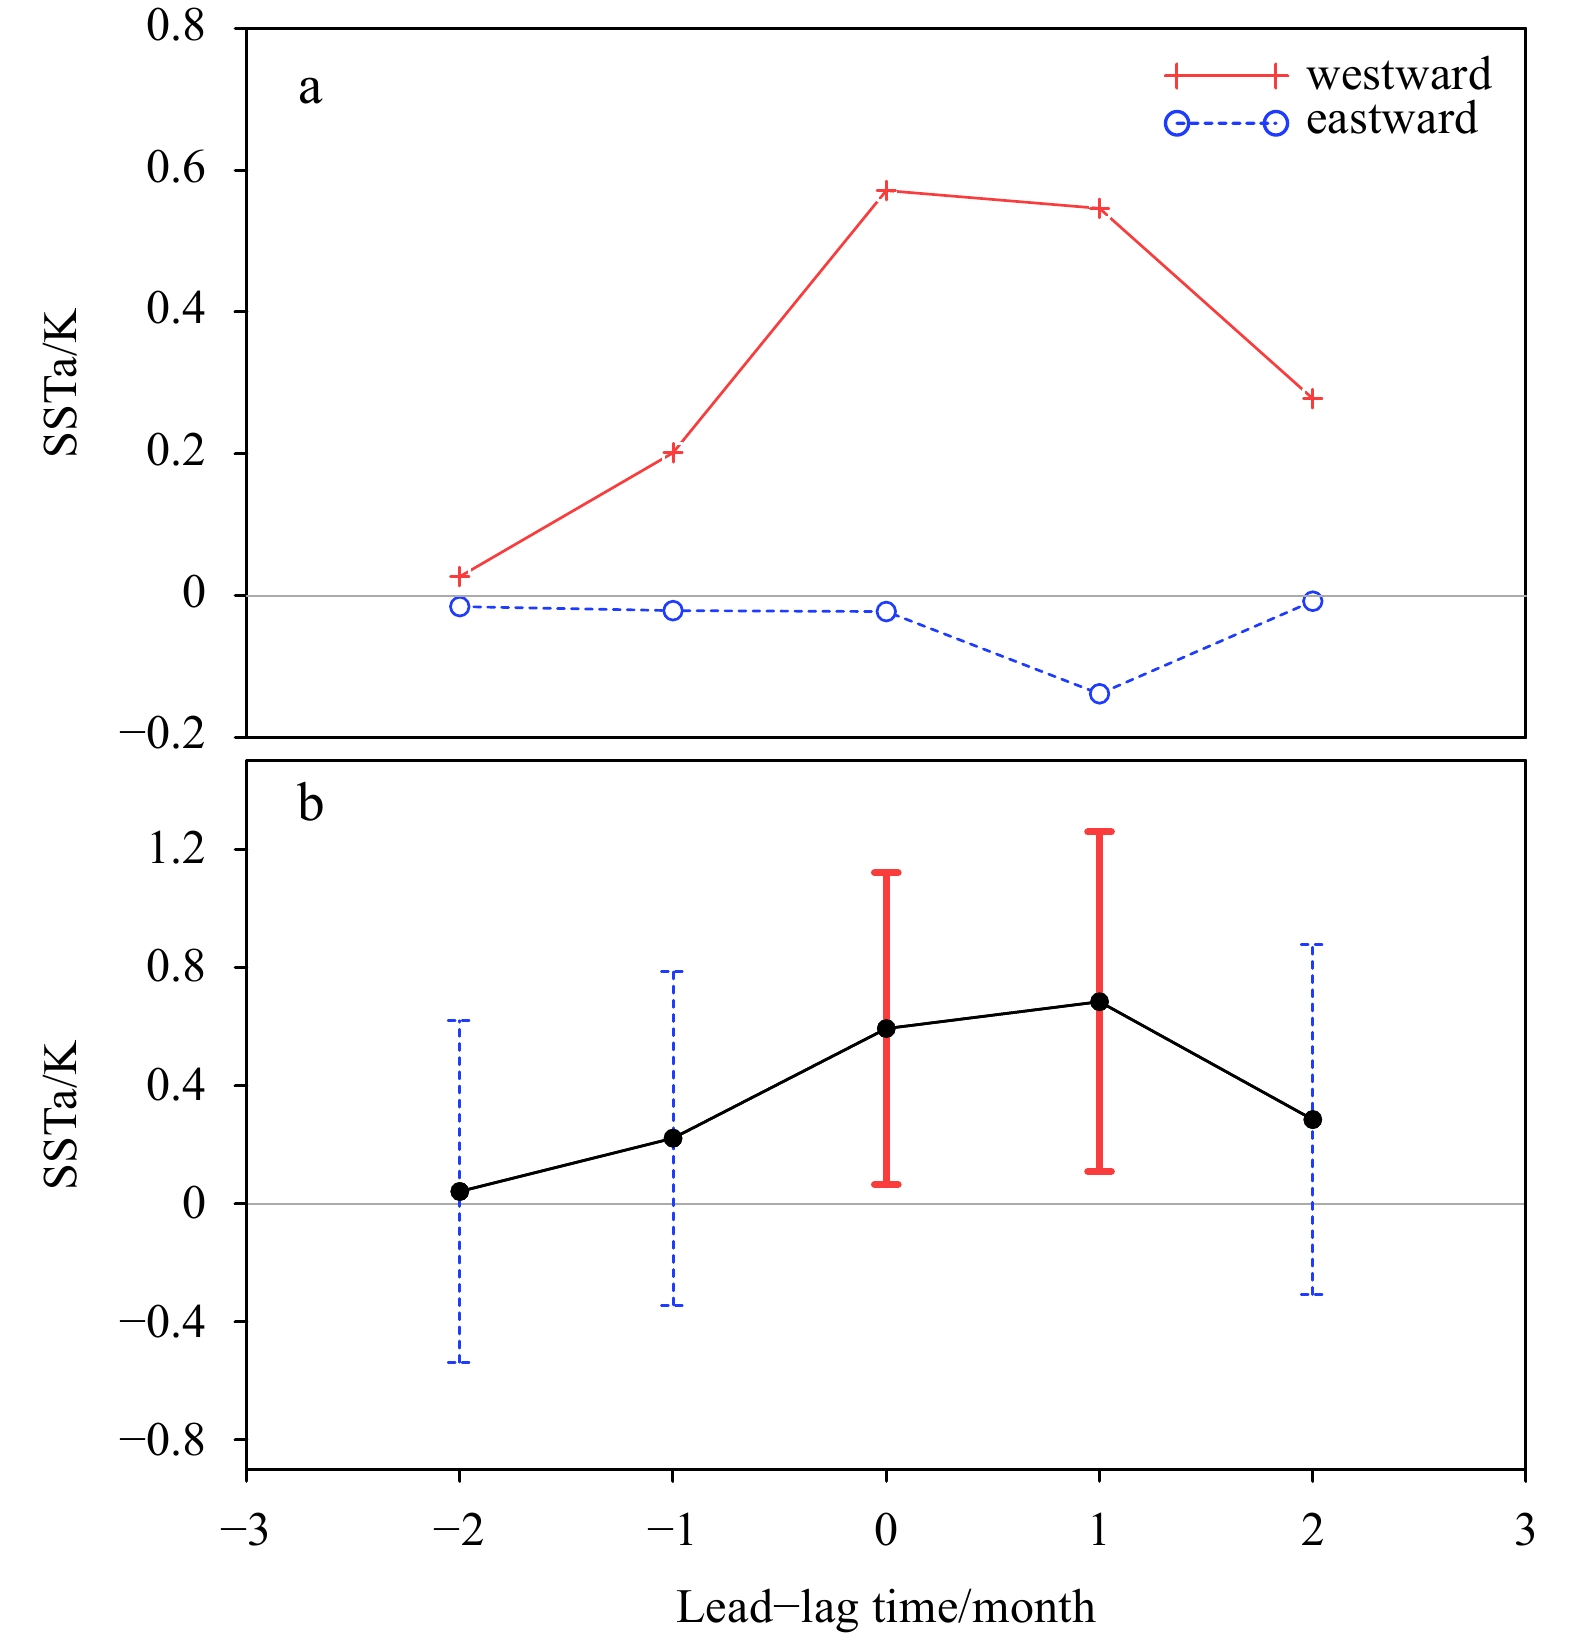
Figure 13. Significant differences between the westward and eastward retroflection events in ALSST. (a) Lead-lag compositions of ERA5 ALSST for the westward retroflection events (red crosses) and for the eastward retroflection events (blue circles). The ALSST is computed from the difference between the SA (solid box in Fig. 12) mean SST anomalies and the IO (dashed box in Fig. 12) mean SST anomalies. (b) The ALSST differences between the westward and the eastward retroflection differences are statistically significant at 95% confidence level of t-test, whereas the values overlapped by the blue dashed bars are insignificant.
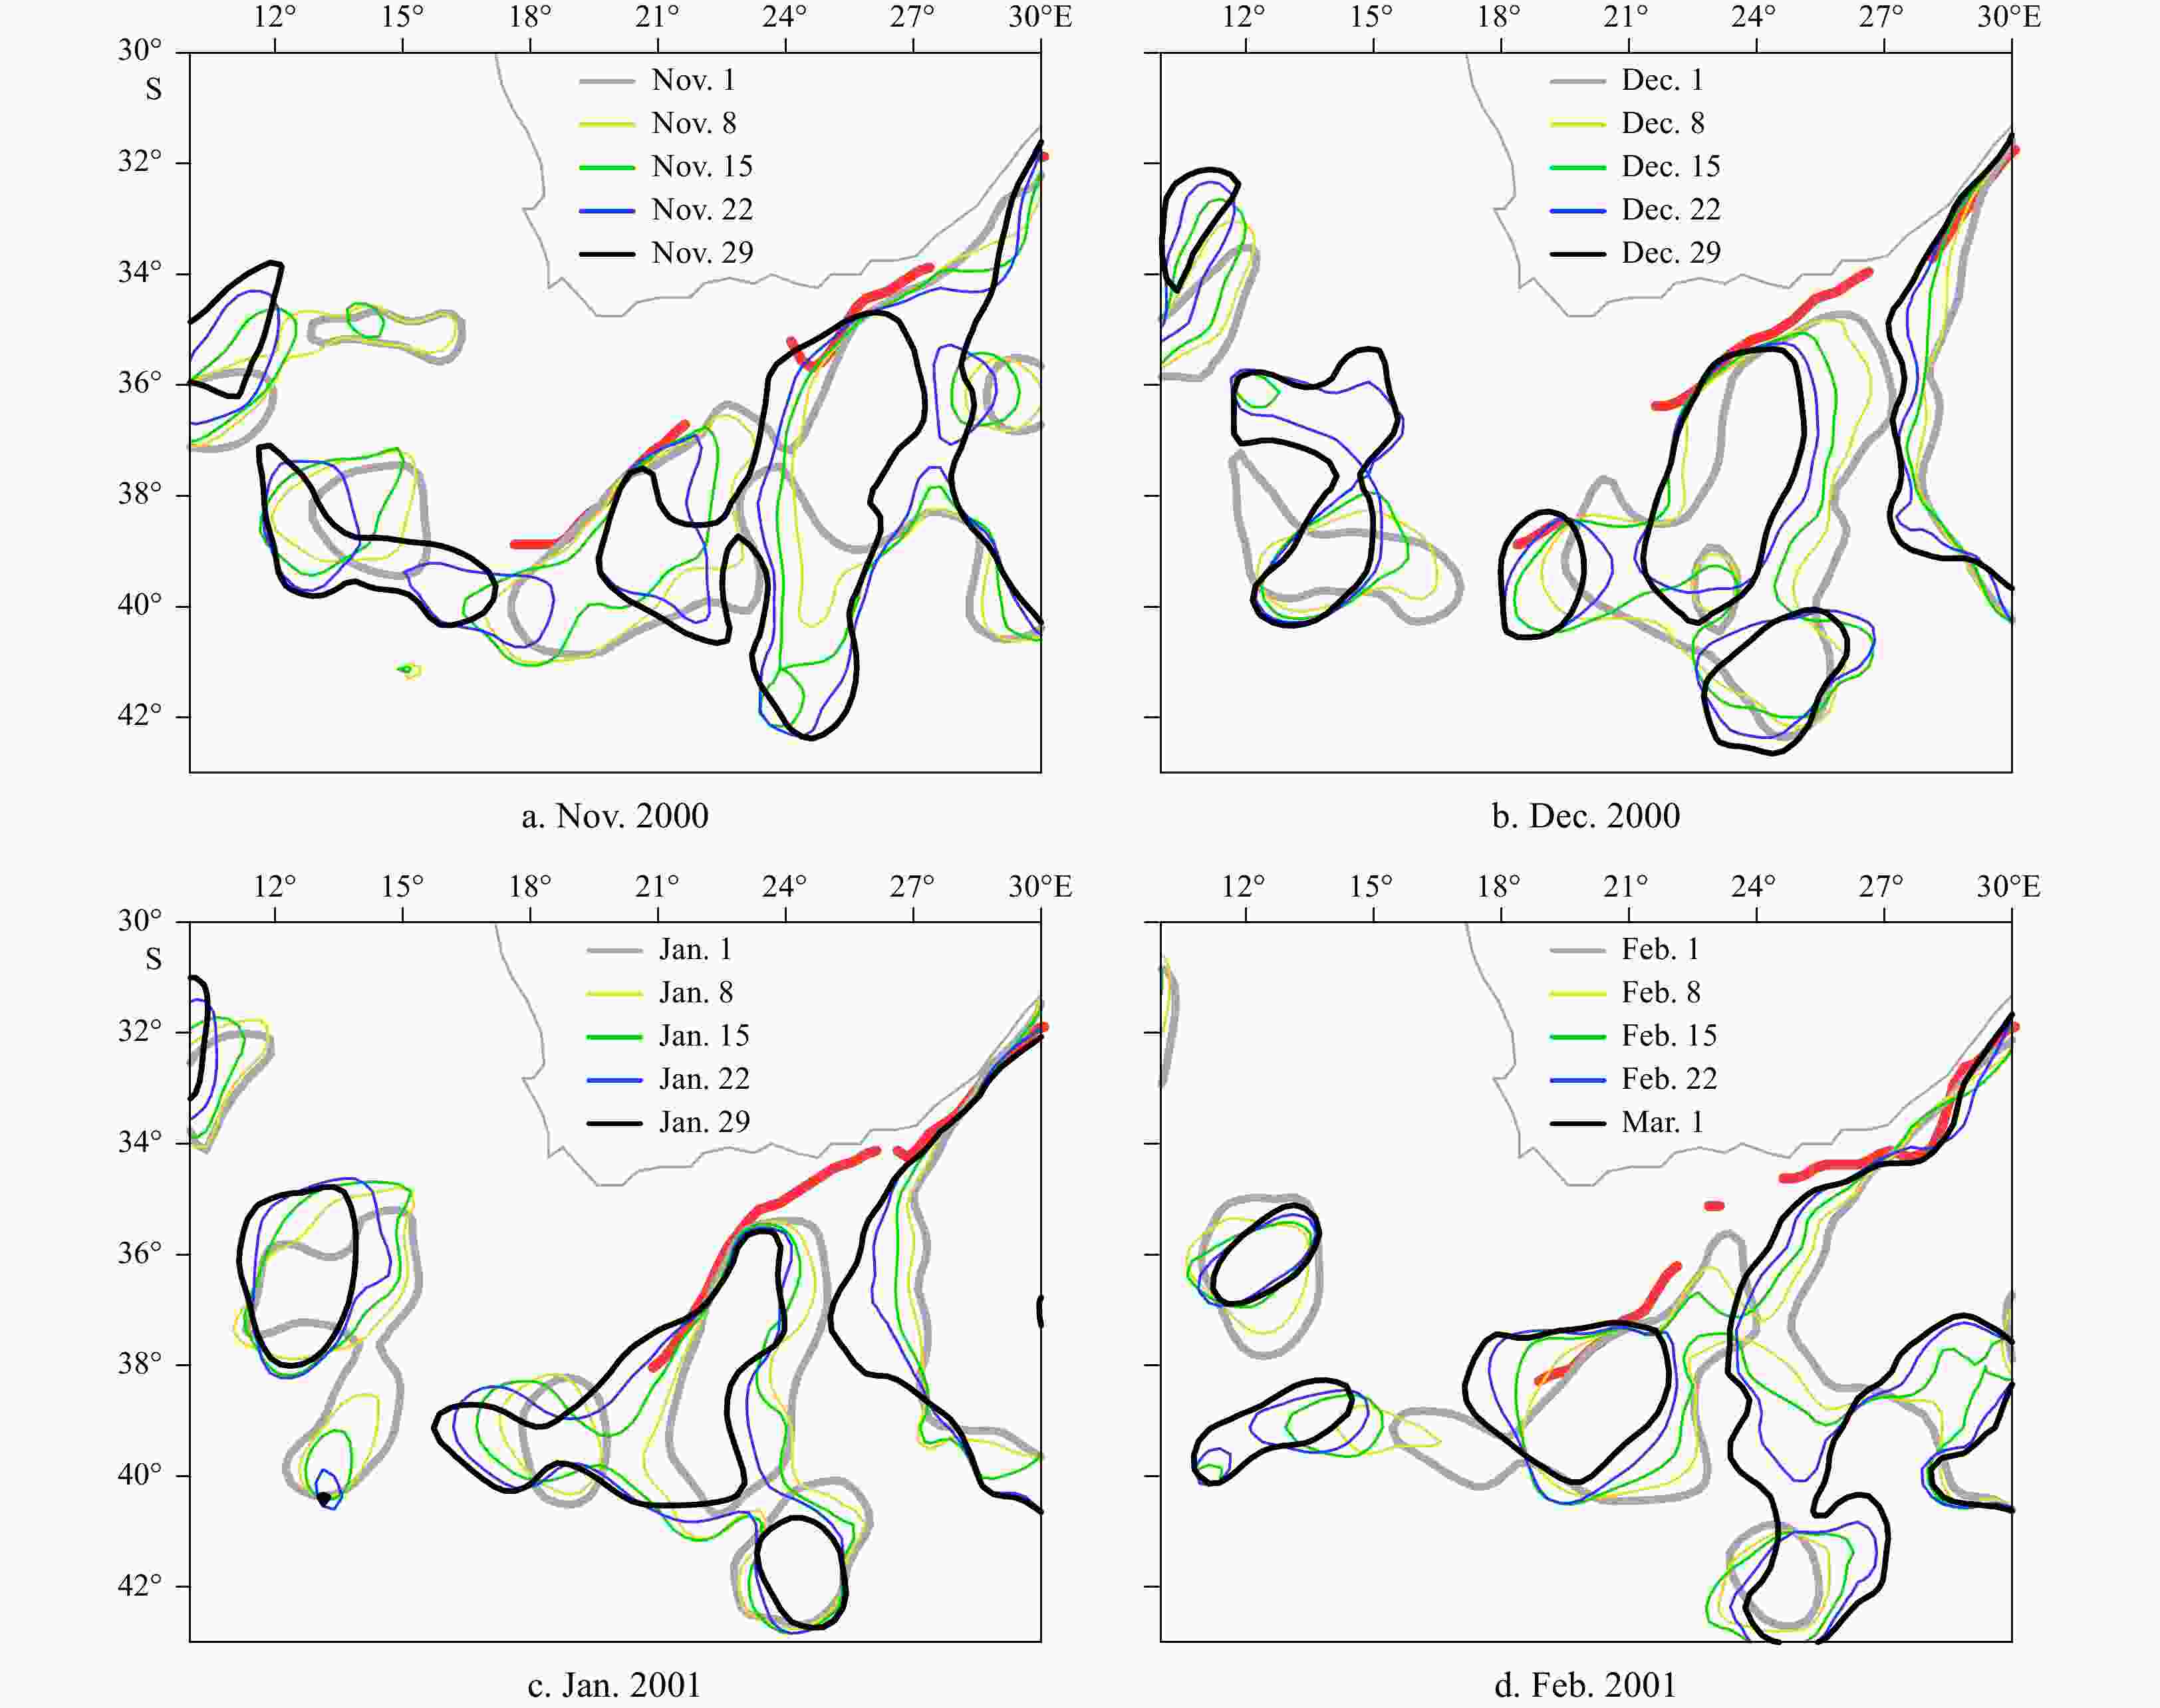
Figure 15. Time evolution of Agulhas Ring shedding processes for the extreme early (eastward) retroflection during November 2000 to February 2001 recorded by Dencausse et al. (2010a). a. November 2000; b. December 2000; c. January 2001; d. February 2001.
-
Backeberg B C, Penven P, Rouault M. 2012. Impact of intensified Indian Ocean winds on mesoscale variability in the Agulhas system. Nature Climate Change, 2(8): 608–612. doi: 10.1038/nclimate1587 Beal L M, Bryden H L. 1999. The velocity and vorticity structure of the Agulhas Current at 32°S. Journal of Geophysical Research: Oceans, 104(C3): 5151–5176. doi: 10.1029/1998JC900056 Beal L M, Elipot S. 2016. Broadening not strengthening of the Agulhas Current since the early 1990s. Nature, 540(7634): 570–573. doi: 10.1038/nature19853 Biastoch A, Böning C W, Lutjeharms J R E. 2008. Agulhas leakage dynamics affects decadal variability in Atlantic overturning circulation. Nature, 456(7221): 489–492. doi: 10.1038/nature07426 Biastoch A, Böning C W, Schwarzkopf F U, et al. 2009. Increase in Agulhas leakage due to poleward shift of Southern Hemisphere westerlies. Nature, 462(7272): 495–498. doi: 10.1038/nature08519 Biastoch A, Durgadoo J V, Morrison A K, et al. 2015. Atlantic multi-decadal oscillation covaries with Agulhas leakage. Nature Communications, 6(1): 10082. doi: 10.1038/ncomms10082 Bryden H L, Beal L M, Duncan L M. 2005. Structure and transport of the Agulhas Current and its temporal variability. Journal of Oceanography, 61(3): 479–492. doi: 10.1007/s10872-005-0057-8 Byrne D A, Gordon A L, Haxby W F. 1995. Agulhas eddies: a synoptic view using Geosat ERM data. Journal of Physical Oceanography, 25(5): 902–917. doi: 10.1175/1520-0485(1995)025<0902:AEASVU>2.0.CO;2 Cheng Y, Putrasahan D, Beal L, et al. 2016. Quantifying Agulhas leakage in a high-resolution climate model. Journal of Climate, 29(19): 6881–6892. doi: 10.1175/JCLI-D-15-0568.1 Daher H, Beal L M, Schwarzkopf F U. 2020. A new improved estimation of Agulhas leakage using observations and simulations of lagrangian floats and drifters. Journal of Geophysical Research: Oceans, 125(4): e2019JC015753. doi: 10.1029/2019JC015753 de Ruijter W P M, Biastoch A, Drijfhout S S, et al. 1999. Indian-Atlantic interocean exchange: dynamics, estimation and impact. Journal of Geophysical Research: Oceans, 104(C9): 20885–20910. doi: 10.1029/1998JC900099 de Ruijter W P M, van Aken H M, Beier E J, et al. 2004. Eddies and dipoles around South Madagascar: formation, pathways and large-scale impact. Deep Sea Research Part I: Oceanographic Research Papers, 51(3): 383–400. doi: 10.1016/j.dsr.2003.10.011 Dencausse G, Arhan M, Speich S. 2010a. Spatio-temporal characteristics of the Agulhas Current retroflection. Deep Sea Research Part I:Oceanographic Research Papers, 57(11): 1392–1405. doi: 10.1016/j.dsr.2010.07.004 Dencausse G, Arhan M, Speich S. 2010b. Routes of Agulhas rings in the southeastern Cape Basin. Deep Sea Research Part I: Oceanographic Research Papers, 57(11): 1406–1421. doi: 10.1016/j.dsr.2010.07.008 Dijkstra H A, de Ruijter W P M. 2001. On the physics of the Agulhas Current: steady retroflection regimes. Journal of Physical Oceanography, 31(10): 2971–2985. doi: 10.1175/1520-0485(2001)031<2971:OTPOTA>2.0.CO;2 Durgadoo J V, Loveday B R, Reason C J C, et al. 2013. Agulhas leakage predominantly responds to the Southern Hemisphere westerlies. Journal of Physical Oceanography, 43(10): 2113–2131. doi: 10.1175/JPO-D-13-047.1 Feron R C V, de Ruijter W P M, Oskam D. 1992. Ring shedding in the Agulhas Current system. Journal of Geophysical Research: Oceans, 97(C6): 9467–9477. doi: 10.1029/92JC00736 Gunn K L, Beal L M, Elipot S, et al. 2020. Mixing of subtropical, central, and intermediate waters driven by shifting and pulsing of the Agulhas Current. Journal of Physical Oceanography, 50(12): 3545–3560. doi: 10.1175/JPO-D-20-0093.1 Haidvogel D B, Arango H G, Hedstrom K, et al. 2000. Model evaluation experiments in the North Atlantic Basin: simulations in nonlinear terrain-following coordinates. Dynamics of Atmospheres and Oceans, 32(3-4): 239–281. doi: 10.1016/S0377-0265(00)00049-X Hersbach H, Bell B, Berrisford P, et al. 2020. The ERA5 global reanalysis. Quarterly Journal of the Royal Meteorological Society, 146(730): 1999–2049. doi: 10.1002/qj.3803 Le Bars D, de Ruijter W P M, Dijkstra H A. 2012. A new regime of the Agulhas Current retroflection: turbulent choking of Indian-Atlantic leakage. Journal of Physical Oceanography, 42(7): 1158–1172. doi: 10.1175/JPO-D-11-0119.1 Loveday B R, Durgadoo J V, Reason C J C, et al. 2014. Decoupling of the Agulhas leakage from the Agulhas Current. Journal of Physical Oceanography, 44(7): 1776–1797. doi: 10.1175/JPO-D-13-093.1 Loveday B R, Penven P, Reason C J C. 2015. Southern annular mode and westerly-wind-driven changes in Indian-Atlantic exchange mechanisms. Geophysical Research Letters, 42(12): 4912–4921. doi: 10.1002/2015GL064256 Lutjeharms J R E, Boebel O, Rossby H T. 2003. Agulhas cyclones. Deep Sea Research Part II: Topical Studies in Oceanography, 50(1): 13–34. doi: 10.1016/S0967-0645(02)00378-8 Lutjeharms J R E, van Ballegooyen R C. 1988. The retroflection of the Agulhas Current. Journal of Physical Oceanography, 18(11): 1570–1583. doi: 10.1175/1520-0485(1988)018<1570:TROTAC>2.0.CO;2 Marchesiello P, McWilliams J C, Shchepetkin A. 2003. Equilibrium structure and dynamics of the California Current System. Journal of Physical Oceanography, 33(4): 753–783. doi: 10.1175/1520-0485(2003)33<753:ESADOT>2.0.CO;2 McMonigal K, Beal L M, Elipot S, et al. 2020. The impact of meanders, deepening and broadening, and seasonality on Agulhas Current temperature variability. Journal of Physical Oceanography, 50(12): 3529–3544. doi: 10.1175/JPO-D-20-0018.1 Mulet S, Rio M H, Etienne H, et al. 2021. The new CNES-CLS18 global mean dynamic topography. Ocean Science, 17(3): 789–808. doi: 10.5194/os-17-789-2021 Ou H W, de Ruijter W P M. 1986. Separation of an inertial boundary current from a curved coastline. Journal of Physical Oceanography, 16(2): 280–289. doi: 10.1175/1520-0485(1986)016<0280:SOAIBC>2.0.CO;2 Reynolds R W, Smith T M, Liu C Y, et al. 2007. Daily high-resolution-blended analyses for sea surface temperature. Journal of Climate, 20(22): 5473–5496. doi: 10.1175/2007JCLI1824.1 Rio M H, Santoleri R. 2018. Improved global surface currents from the merging of altimetry and Sea Surface Temperature data. Remote Sensing of Environment, 216: 770–785. doi: 10.1016/j.rse.2018.06.003 Rouault M, Penven P, Pohl B. 2009. Warming in the Agulhas Current system since the 1980's. Geophysical Research Letters, 36(12): L12602 Russo C S, Lamont T, Krug M. 2021. Spatial and temporal variability of the Agulhas retroflection: Observations from a new objective detection method. Remote Sensing of Environment, 253: 112239. doi: 10.1016/j.rse.2020.112239 Rühs S, Schmidt C, Schubert R, et al. 2022. Robust estimates for the decadal evolution of Agulhas leakage from the 1960s to the 2010s. Communications Earth & Environment, 3: 318 Schouten M W, de Ruijter W P M, van Leeuwen P J, et al. 2000. Translation, decay and splitting of Agulhas rings in the southeastern Atlantic Ocean. Journal of Geophysical Research: Oceans, 105(C9): 21913–21925. doi: 10.1029/1999JC000046 Schubert R, Gula J, Biastoch A. 2021. Submesoscale flows impact Agulhas leakage in ocean simulations. Communications Earth & Environment, 2(1): 197 Shchepetkin A F, McWilliams J C. 2005. The regional oceanic modeling system (ROMS): a split-explicit, free-surface, topography-following-coordinate oceanic model. Ocean Modelling, 9(4): 347–404. doi: 10.1016/j.ocemod.2004.08.002 Taburet G, Sanchez-Roman A, Ballarotta M, et al. 2019. DUACS DT2018: 25 years of reprocessed sea level altimetry products. Ocean Science, 15(5): 1207–1224. doi: 10.5194/os-15-1207-2019 van Aken H M, van Veldhoven A K, Veth C, et al. 2003. Observations of a young Agulhas ring, Astrid, during MARE in March 2000. Deep Sea Research Part II:Topical Studies in Oceanography, 50(1): 167–195. doi: 10.1016/S0967-0645(02)00383-1 van Sebille E, Barron C N, Biastoch A, et al. 2009a. Relating Agulhas leakage to the Agulhas Current retroflection location. Ocean Science, 5(4): 511–521. doi: 10.5194/os-5-511-2009 van Sebille E, Biastoch A, van Leeuwen P J, et al. 2009b. A weaker Agulhas Current leads to more Agulhas leakage. Geophysical Research Letters, 36(3): L03601 Warner J C, Sherwood C R, Arango H G, et al. 2005. Performance of four turbulence closure models implemented using a generic length scale method. Ocean Modelling, 8(1–2): 81–113. doi: 10.1016/j.ocemod.2003.12.003 Wei Lansu, Wang Chunzai. 2023. Characteristics of ocean mesoscale eddies in the Agulhas and Tasman Leakage regions from two eddy datasets. Deep Sea Research Part II:Topical Studies in Oceanography, 208: 105264. doi: 10.1016/j.dsr2.2023.105264 Zhu Yanan, Li Yuanlong, Zhang Zhengguang, et al. 2021. The observed Agulhas retroflection behaviors during 1993–2018. Journal of Geophysical Research: Oceans, 126(12): e2021JC017995. doi: 10.1029/2021JC017995 -

 下载:
下载:


 点击查看大图
计量
- 文章访问数: 48
- HTML全文浏览量: 18
- 被引次数: 0

